

Abstract
Background:
Celiac disease (CeD) is an autoimmune enteropathy triggered by dietary gluten. Almost 90% of CeD patients have HLA-DQ2 or -DQ8 haplotypes. As a high proportion of first-degree relatives (FDRs) of CeD patients have the same haplotype, it is assumed that they are at a higher risk of disease development than the general population. Nevertheless, the prevalence of CeD among FDRs is considerably low (7.5%).
Materials and Methods:
In order to figure out this discrepancy, a microarray dataset of intestinal mucosal biopsies of CeD patients, FDRs, and control groups was reanalyzed, and a protein-protein interaction network was constructed.
Results:
Principal component analysis showed that CeD and FDR groups are far away in terms of gene expression. Comparing differentially expressed genes of both networks demonstrated inverse expression of some genes mainly related to cell cycle mechanisms. Moreover, analysis of the modular structures of up- and downregulated gene networks determined activation of protein degradation mechanisms and inhibition of ribosome-related protein synthesis in celiac patients with an upside-down pattern in FDRs.
Conclusions:
The top-down systems biology approach determined some regulatory pathways with inverse function in CeD and FDR groups. These genes and molecular mechanisms could be a matter of investigation as potential druggable targets or prognostic markers in CeD.
Keywords: Celiac disease, protein-protein interaction network, systems biology, transcriptome
INTRODUCTION
Celiac disease (CeD), with an overall prevalence of 0.79% in the general population,[1] is an autoimmune enteropathy triggered by the ingestion of dietary gluten protein contained in many grains.[2] Upon entry of gluten into the small intestine, the patient develops painful digestion disorders resulting in inflammation of the intestinal mucosa, villous atrophy, and crypt hyperplasia.[3] As a complex disease, celiac is caused by a combination of genetic and environmental factors.[4] The main genetic susceptibility factors for CeD are human leukocyte antigen (HLA)-DQ2 and -DQ8 haplotypes accounting for approximately 40% of the heritability of CeD.[5,6] Besides, association studies have shown that other genetic factors affect the development of CeD in individuals with these HLA haplotypes.[7] As 80%–85% of first-degree relatives (FDR) of CeD patients have HLA-DQ2/DQ8 haplotypes, it is supposed that they would be at a very high risk of developing the disease. Nevertheless, the prevalence of the disease in the relatives is around 7.5%.[5,8] It seems that compensatory protective mechanisms in healthy FDRs have prevented disease development in these indiviuals. Comparing the molecular phenotype of patients and healthy FDRs is important for determining protective and pathogenic mechanisms in disease progression.[9]
The holistic viewpoint of systems biology allows a better understanding of the molecular mechanisms that cause disease progression. By evaluating the global gene expression profile of CeD patient’s duodenum, Banaganapalli et al.[10] determined biological pathways related to immune system processes, loss of cell division regulation, and impaired metabolism and absorption. In another study, Leonard et al.[11] underscored novel pathways such as the spliceosome, innate immune response, and autoimmunity in the CeD population. Despite these findings, the molecular machinery involved in disease progression and the possible compensatory protective mechanisms in the healthy FDR have not been fully identified. Therefore, a microarray dataset was reanalyzed to get insight into the biological pathways activated in CeD and the possible compensatory protective mechanisms that prevent disease in healthy FDR. The constructed protein-protein interaction (PPI) network and pathway enrichment analysis of differentially expressed genes (DEGs) determined the critical role of pathways associated with immune and inflammatory responses, cell cycle, and cell transport pathways in CeD.
MATERIALS AND METHODS
Microarray data acquisition
mRNA expression profiling deposited by Acharya P et al.[9] with accession number GSE112102 was obtained from the Gene Expression Omnibus (GEO) database (https://www.ncbi.nlm.nih.gov/geo/). The dataset includes the mRNA expression profiles of mucosal biopsies of 12 CeD patients, 12 controls, and 12 healthy FDRs. FDRs were selected randomly, and none of the FDRs were related to CeD patients. In this study, the CeD group had high levels of anti-tissue transglutaminase antibody (anti-tTG Ab), advanced villous abnormalities on histological evaluation, and HLA-DQ2 haplotype. FDRs were asymptomatic, anti-tTG Ab negative with HLA-DQ2 haplotype, and no evidence of enteropathy. The control group had a definitive normal gastrointestinal status on endoscopic examination, had a normal crypt villous ratio, and were anti-tTG Ab negative. The original research article has full details about biopsy sampling and RNA extraction, microarray experiment, and hybridization of arrays.
Data processing and DEGs screening
The quality of microarray data was evaluated by principal component analysis (PCA) using prcomp function of R software and was visualized using the ggplot2 package (https://cran.r-project.org/web/packages/ggplot2/index.html). DEGs were identified using the GEO2R tool of the GEO database, and P value was corrected using the Benjamini–Hochberg false discovery rate. All genes with adjusted P value <0.05 were assumed as DEGs. The volcano plot displaying DEGs between groups of the study was depicted using the ggplot2 R package.
PPI network construction and module identification
Cytoscape software version 3.8.0 was used to construct PPI networks encompassing DEGs for CeD and FDR groups. In addition, the DEGs were classified into upregulated and downregulated genes in these two groups, and then the PPI network was constructed. Different kinds of interactions (activation, inhibition, and posttranslational modification) were retrieved from the STRING database of the Clupedia plugin in Cytoscape software, and the cutoff of interaction confidence was set at 0.7. Due to the small number of nodes in the network of upregulated DEGs in the FDR group, enrichment was performed for this nonintegrated network by adding one node to each node. We used the Cytoscape plugin CytoHubba for ranking hub nodes in these networks. Genes with the highest maximal clique centrality (MCC) score were identified as hub genes. Also, molecular complex detection (MCODE) tool was used to determine functional modules of PPI networks with a degree cutoff of 4, node score cutoff of 0.2, k-core = 2, and max depth of 100.
Functional annotations of cluster networks
The DEGs were applied for gene ontology (GO) enrichment analysis and pathway enrichment analysis by ClueGo plugin of Cytoscape. The Bonferroni step-down method was applied for P value correction. ggplot2 R package was used to depict the scatter plot of the enriched biological process and calculated the rich factor which means the ratio of the number of genes in a particular pathway to the total number of genes in the pathway.
RESULTS
Analyzing networks for all DEGs identified three novel genes with inverse expression in CeD and FDR groups
In this study, GSE112102 was reanalyzed to determine the differential molecular mechanisms activated in CeD and FDR groups [Figure 1a]. PCA demonstrated segregation of the samples of CeD patients, FDR, and control groups [Figure 1b]. Statistical analysis of the gene expression profiles by GEO2R determined 5967 DEGs with adjusted P value ≤0.05 (1,167 upregulated and 4,800 downregulated genes) for CeD patients compared to control. Also, 7863 DEGs with adjusted P value ≤0.05 (187 upregulated and 7,676 downregulated genes) differentiated the FDRs. The volcano plot represents up- and downregulated genes in each comparison [Figure 1c].
Figure 1.
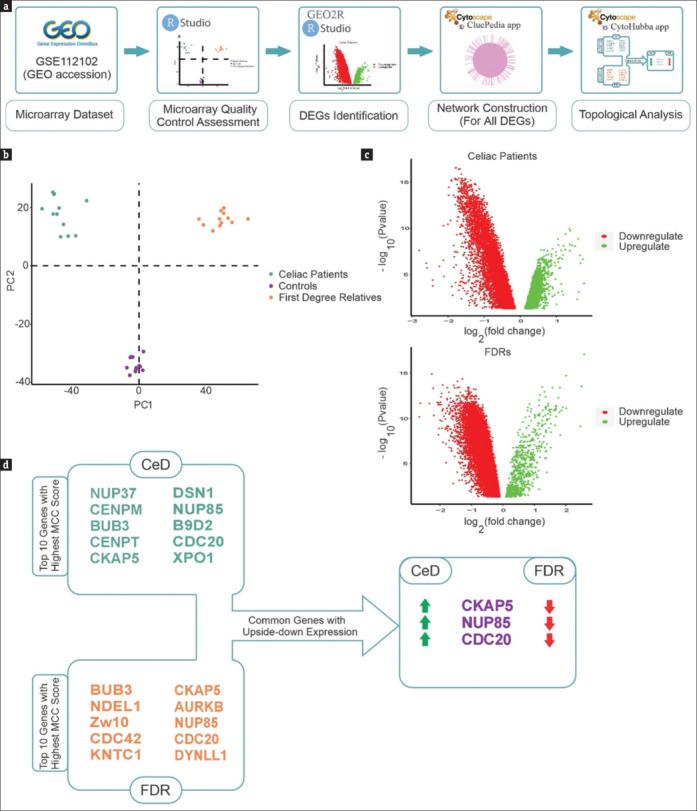
(a) The schematic representation of our approach. (b) PCA depicted with all genes in the dataset. These plots indicate an acceptable quality of microarray dataset, and most samples were segregated according to the experimental groups. The genes with adj. P value ≤0.05 are considered as DEGs. (c) Volcano plots demonstrate expression patterns of DEGs in CeD and FDR groups. Red and green dots represent significantly (false discovery rate < 0.05) upregulated or downregulated genes, respectively. (d) The constructed PPI network was reanalyzed by Cytohubba. The top 10 genes with the highest MCC score are shown. Three common genes (CKAP5, NUP85, and CDC20) were identified with an inverse expression between the two gene categories. The green and red arrows represent upregulated and downregulated expression, respectively
PPI network was constructed for both groups with all DEGs. The constructed network of CeD group included 5,959 nodes (DEGs) and 10,577 edges, and the network of FDR group consisted of 7,850 nodes connected by 13,830 edges [Supplementary data Figures 1 (1.8MB, tif) and 2 (1.6MB, tif) ]. In this study, we evaluated the hub genes by MCC score. The MCC algorithm is a topological analysis method used to assess the essentiality of nodes. It has been identified as the most efficient approach for identifying hub nodes compared to other methods. This local-based approach assesses the score of a node in a network by only taking into account the relationships between the node and its direct neighbors.[12] The top ten genes in terms of the highest MCC score for CeD network were NUP37, CENPM, BUB3, CENPT, CKAP5, DSN1, NUP85, B9D2, CDC20, and XPO1. Also, BUB3, NDEL1, Zw10, CDC42, KNTC1, CKAP5, AURKB, NUP85, CDC20, and DYNLL1 in the FDR group were determined as hub genes with the highest score of MCC. BUB3, CKAP5, NUP85, and CDC20 were common among the hub genes identified in these two networks. Considering the expression of these genes determined that CDC20, NUP85, and CKAP5 have inverse expression patterns in these two groups. While the genes were upregulated in CeD group, they were downregulated in FDR group [Figure 1d].
Analysis of the PPI network of up- and downregulated genes determined significant biological processes
In order to decipher differences between CeD and FDR groups, PPI networks of up- and downregulated genes were constructed and subsequently subjected to various analyses [Figure 2a]. The network of upregulated DEGs in CeD included 1,167 nodes connected by 1,463 edges. However, the PPI network of downregulated genes included 4,800 nodes and 2,819 edges [Supplementary data Figures 3 (1.1MB, tif) and 4 (915KB, tif) ]. In the FDR group, the constructed network of upregulated DEGs included 7,676 nodes connected by 14,317 edges and downregulated genes PPI network included 538 nodes connecting 990 edges [Supplementary data Figures 5 (1.5MB, tif) and 6 (852.8KB, tif) ]. To understand the critical structural parts of each network, module identification was performed by MCODE plugin of the Cytoscape software. MCODE determines highly connected regions by considering the clustering coefficient feature of the genes. The analysis determined 25 and 51 modules for up- and downregulated gene networks of CeD patients and 29 and 125 for FDR-related networks. The top structural module of each network is shown in Figure 2b.
Figure 2.
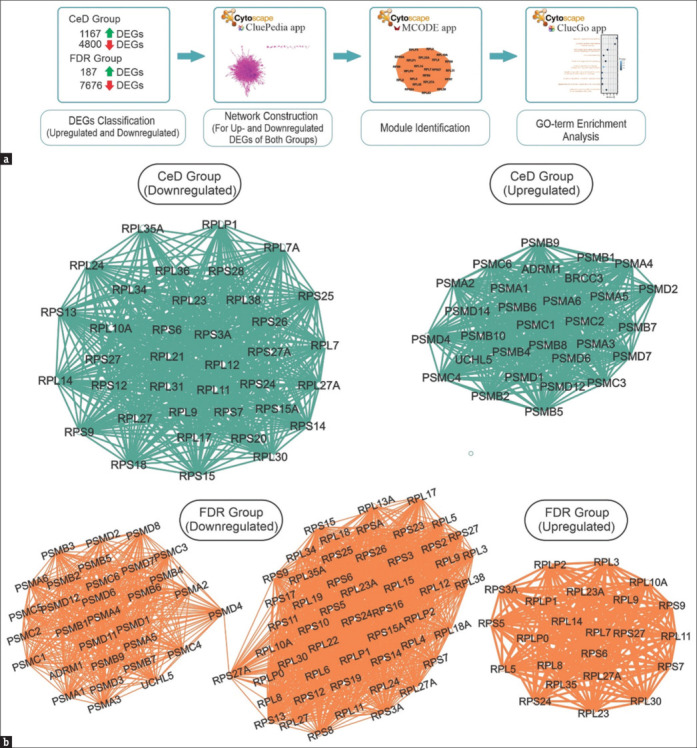
(a) The scheme of analysis approach. (b) The MCODE clusters from DEGs in CeD and FDR groups (Cluster-1, downregulated in FDR group. Cluster-1, upregulated in FDR group. Cluster-1, downregulated in CeD group. Cluster-1, upregulated in CeD group)
Cluster 1 of downregulated PPI network in CeD group was mainly composed of RPL (Ribosomal Protein Large subunit) and RPS (Ribosomal Protein Small subunit) gene families. In addition, the first module of the upregulated genes mainly was formed of proteasome subunit (PSM)-related genes.
However, the first module of the FDR upregulated network consisted of genes belonging mainly to RPL and RPS. While the first module of downregulated genes network was formed of RPL, RPS, and PSM gene families.
It seems that RPL, RPS, and PSM gene families are leading inverse phenomena in CeD patients and healthy relatives.
Gene set enrichment analysis of network modules displays differentially expressed processes associated with CeD and FDR groups
The top module of each network was used for GO analysis by ClueGo plugins of the Cytoscape software. The significant GO terms of each cluster (adjusted P value ≤0.05) are demonstrated in Figure 3. As expected, some of the upregulated pathways in celiac patients were similar to downregulated pathways in FDRs. However, the downregulated pathways in celiac patients and upregulated pathways in the FDRs were common. The similar pathways that were upregulated in CeD patients but downregulated in the FDRs were regulation of innate immune response, interleukin-mediated signaling pathway and antigen processing and presentation, and NF-kappaB signaling pathway, proteasome-activating ATPase activity, regulation of cell cycle, and G2/M transition of the mitotic cell cycle. The downregulated pathways in CeD patients that were upregulated in FDRs were protein localization to the membrane and endoplasmic reticulum and ubiquitin ligase inhibitor activity. Bold terms in Figure 3 show biological processes with inverse expression in CeD group versus FDR group.
Figure 3.
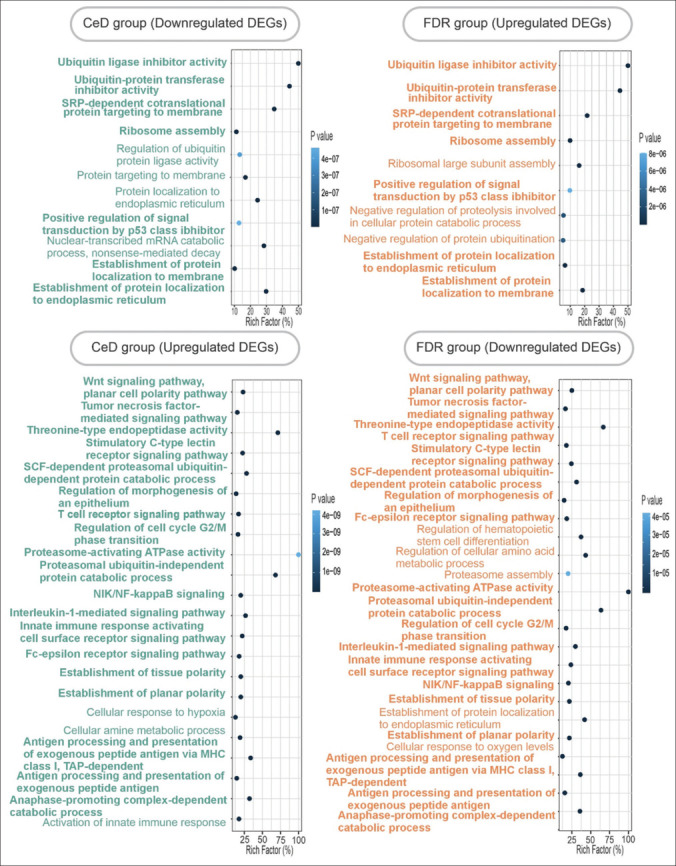
Gene ontology enrichment analysis of the network’s modules. Biological processes related to up- and downregulated DEGs in CeD group (left), and biological process of first modules of up- and downregulated DEGs in FDR group (right) are represented. Bold terms represent common biological processes with inverse change in CeD group versus FDR group
DISCUSSION
CeD is an autoimmune enteropathy manifested by an immune response to gluten in genetically susceptible individuals. The genetic risk factor in patients has been related to HLA-DQ2/DQ8 haplotype. Nevertheless, studies demonstrate that despite the genetic predisposition of many FDRs, only 7.5% of them develop CeD.[5,6] In order to find the difference in molecular mechanisms activated in CeD patients and healthy relatives, a microarray dataset was reanalyzed. The findings indicated the inverse function of some genes in CeD patients and healthy FDRs and proposed some pathways that seem to have a preventive role in FDRs.
Three hub genes (CDC20, NUP85, and CKAP5) were discovered in both CeD and FDR networks with an inverse expression pattern (upregulated in one and downregulated in the other). Interestingly, all these genes are mainly involved in cell cycle-related mechanisms deregulated in CeD.[13] CDC20 (cell division cycle protein 20) has shown to be a central node in CeD patients with an incremental expression pattern.[10] On the other hand, CKAP5 (cytoskeleton-associated protein 5) as a regulator of microtubule dynamics plays a critical role in the mitotic cell cycle by organizing mitotic spindles.[14] The findings of Wilson et al.[15] demonstrated that a marked rearrangement of the actin cytoskeleton and microtubule structure is observed in celiac lesions compared to normal individuals. The other gene, NUP85 (nuclear pore complex protein 85), is an essential component of the nuclear pore complex (NPC) that seems to be required for NPC assembly and maintenance.[16] As NUP85 has been shown to be related to the inflammatory processes through interaction with CCR2/CCR5 signaling,[17,18] and our analysis determined its upregulation in CeD patients, it seems that it could be a potential regulator of inflammation in CeD which should be studied in the future.
Evaluating the modular structures of PPI networks for up- and downregulated genes showed three key gene families (RPL, RPS, and PSM) with inverse expression patterns in the two conditions. Taking a glance at the molecular phenomena controlled by these genes shows that they are related to the synthesis or degradation of proteins. RPL and RPS are ribosomal proteins and have a critical role in ribosome assembly and protein translation. Also, these proteins are shown to be involved in immune system modulation, development, and promotion of various diseases through ribosome-dependent or independent mechanisms.[19,20] However, PSM genes belong to proteasome structures. Proteasomes are involved in various cellular functions, including regulation of protein homeostasis, antigen processing and presentation by MHC class 1, and cell cycle proliferation.[21] Notably, proteasome activation is shown to be a common hallmark of autoimmune diseases such as rheumatoid arthritis,[22] systemic lupus erythematosus,[23] and multiple sclerosis.[24] The upregulation of proteasome-related genes parallel to downregulation of ribosomal proteins highlights the issue that these two mechanisms may be one of the reasons for manifestations of the celiac. In this regard, it is supposed that FDA-approved proteasome inhibitors such as bortezomib might potentially affect the treatment of CeD, which might be an interesting subject to work on.
Inverse behavior was also detectable in the significantly altered signaling pathways. The upregulation of immune-related pathways in celiac patients and the downregulation of similar mechanisms in FDRs show the critical role of immune-related pathways in the pathogenesis of CeD. For instance, the study of Leonard et al[11] highlighted the upregulation of immune-related pathways such as cytokines and chemokines signaling pathways, interferon signaling pathways, NK cell-mediated cytotoxicity-related pathways, antigen processing and presentation pathways related to the innate immune response, and pathways related to autoimmunity in celiac patients. In addition, Qiao et al.[25] determined that the presentation of undigested gluten peptides by antigen-presenting cells is a crucial driver of the immune response in CeD. It seems that downregulation of antigen processing and presentation of exogenous peptide is a potential compensatory protective mechanism in FDRs. Alterations in the cell cycle-related pathways were also observed in celiac patients. Consistent with this finding, several studies have shown increased cell cycle and nuclear division activity in CeD.[10,11,13] A different function of inflammatory mechanisms was another finding of this study. Our results demonstrate the upregulation of the NF-κB pathway in celiac patients and its downregulation in FDRs. This result is in agreement with the findings of Maiuri et al.,[26] which determined activation of NF-κB pathway in the intestinal mucosa of untreated CeD patients. The finding that NF-kB pathway is activated in celiac patients and downregulated in the FDRs denotes it as a possible marker in the progression of the disease. Vesicular trafficking was another term with inverse alterations. Upregulation of vesicular trafficking-related pathways was shown in celiac patients. Remarkably, reports show that alterations in vesicular trafficking in cells from celiac patients increase their sensitivity to the effects of gliadin peptides.[27] Gene set enrichment analysis determined some signaling pathways such as Wnt or proteasomal protein catabolic process that their relation to disease should be further investigated.
CONCLUSION
This study underscores the beneficial role of systems biology in determining critical molecular mechanisms related to CeD and the possible compensatory protective mechanisms in FDR individuals. Various processes involved in the immune system, cell cycle, and cellular transport were identified with inverse function in CeD patients and healthy relatives. The findings of this study would give us some clues about the etiology of the disease and improve our understanding of this complex disorder. Complementary experimental investigations are needed to validate the findings of this study and the proposition of new drug targets.
Availability of data and materials
The datasets generated and/or analysed during the current study are available in the Gene Expression Omnibus (GEO) repository with accession number GSE112102, [https://www.ncbi.nlm.nih.gov/geo].
Financial support and sponsorship
Nil.
Conflicts of interest
There are no conflicts of interest.
The constructed network of CeD group with all DEGs
The constructed network of FDR group with all DEGs
The constructed network of downregulated DEGs in CeD group
The constructed network of upregulated DEGs in CeD group
The constructed network of downregulated DEGs in FDR group
The constructed network of upregulated DEGs in FDR group
Acknowledgments
This study was supported by Isfahan University of Medical Sciences (Grant NO: 1400332).
REFERENCES
- 1.Celdir MG, Jansson-Knodell CL, Hujoel IA, Prokop LJ, Wang Z, Murad MH, et al. Latitude and celiac disease prevalence: A meta-analysis and meta-regression. Clin Gastroenterol Hepatol. 2020;20:e1231–9. doi: 10.1016/j.cgh.2020.09.052. [DOI] [PubMed] [Google Scholar]
- 2.Demin OO, Smirnov SV, Sokolov VV, Cucurull-Sanchez L, Pichardo-Almarza C, Flores M, et al. Modeling of celiac disease immune response and the therapeutic effect of potential drugs. BMC Syst Biol. 2013;7:1–10. doi: 10.1186/1752-0509-7-56. [DOI] [PMC free article] [PubMed] [Google Scholar]
- 3.Emilsson L, Wijmenga C, Murray JA, Ludvigsson JF. Autoimmune disease in first-degree relatives and spouses of individuals with celiac disease. Clin Gastroenterol Hepatol. 2015;13:1271–7.e2. doi: 10.1016/j.cgh.2015.01.026. [DOI] [PubMed] [Google Scholar]
- 4.Martín-Masot R, Diaz-Castro J, Moreno-Fernandez J, Navas-López VM, Nestares T. The role of early programming and early nutrition on the development and progression of celiac disease: A review. Nutrients. 2020;12:3427. doi: 10.3390/nu12113427. [DOI] [PMC free article] [PubMed] [Google Scholar]
- 5.Kang J, Kang A, Green A, Gwee K, Ho K. Systematic review: Worldwide variation in the frequency of coeliac disease and changes over time. Aliment Pharmacology Ther. 2013;38:226–45. doi: 10.1111/apt.12373. [DOI] [PubMed] [Google Scholar]
- 6.Megiorni F, Pizzuti A. HLA-DQA1 and HLA-DQB1 in Celiac disease predisposition: Practical implications of the HLA molecular typing. J Biomed Sci. 2012;19:1–5. doi: 10.1186/1423-0127-19-88. [DOI] [PMC free article] [PubMed] [Google Scholar]
- 7.Bingham SM, Bates MD. Pediatric celiac disease: A review for non-gastroenterologists. Curr Probl Pediatr Adolesc Health Care. 2020;50:100786. doi: 10.1016/j.cppeds.2020.100786. [DOI] [PubMed] [Google Scholar]
- 8.Singh P, Arora S, Lal S, Strand TA, Makharia GK. Risk of celiac disease in the first-and second-degree relatives of patients with celiac disease: A systematic review and meta-analysis. Am J Gastroenterol. 2015;110:1539–48. doi: 10.1038/ajg.2015.296. [DOI] [PubMed] [Google Scholar]
- 9.Acharya P, Kutum R, Pandey R, Mishra A, Saha R, Munjal A, et al. First degree relatives of patients with celiac disease harbour an intestinal transcriptomic signature that might protect them from enterocyte damage. Clin Transl Gastroenterol. 2018;9:195. doi: 10.1038/s41424-018-0059-7. [DOI] [PMC free article] [PubMed] [Google Scholar]
- 10.Banaganapalli B, Mansour H, Mohammed A, Alharthi AM, Aljuaid NM, Nasser KK, et al. Exploring celiac disease candidate pathways by global gene expression profiling and gene network cluster analysis. Sci Rep. 2020;10:1–13. doi: 10.1038/s41598-020-73288-6. [DOI] [PMC free article] [PubMed] [Google Scholar]
- 11.Leonard MM, Bai Y, Serena G, Nickerson KP, Camhi S, Sturgeon C, et al. RNA sequencing of intestinal mucosa reveals novel pathways functionally linked to celiac disease pathogenesis. PloS One. 2019;14:e0215132. doi: 10.1371/journal.pone.0215132. [DOI] [PMC free article] [PubMed] [Google Scholar]
- 12.Chin C-H, Chen S-H, Wu H-H, Ho C-W, Ko M-T, Lin C-Y. cytoHubba: Identifying hub objects and sub-networks from complex interactome. BMC Syst Biol. 2014;8:1–7. doi: 10.1186/1752-0509-8-S4-S11. [DOI] [PMC free article] [PubMed] [Google Scholar]
- 13.Loberman-Nachum N, Sosnovski K, Di Segni A, Efroni G, Braun T, BenShoshan M, et al. Defining the celiac disease transcriptome using clinical pathology specimens reveals biologic pathways and supports diagnosis. Sci Rep. 2019;9:1–10. doi: 10.1038/s41598-019-52733-1. [DOI] [PMC free article] [PubMed] [Google Scholar]
- 14.Miller MP, Asbury CL, Biggins S. A TOG protein confers tension sensitivity to kinetochore-microtubule attachments. Cell. 2016;165:1428–39. doi: 10.1016/j.cell.2016.04.030. [DOI] [PMC free article] [PubMed] [Google Scholar]
- 15.Wilson S, Volkov Y, Feighery C. Rearrangement of enterocyte cytoskeletal proteins in coeliac disease. Endoscopy. 2004;36:46. [Google Scholar]
- 16.Harel A, Orjalo AV, Vincent T, Lachish-Zalait A, Vasu S, Shah S, et al. Removal of a single pore subcomplex results in vertebrate nuclei devoid of nuclear pores. Mol Cell. 2003;11:853–64. doi: 10.1016/s1097-2765(03)00116-3. [DOI] [PubMed] [Google Scholar]
- 17.Sakuma S, D’Angelo MA, editors, editors. The roles of the nuclear pore complex in cellular dysfunction, aging and disease. Semin Cell Dev Biol. 2017;68:72–8. doi: 10.1016/j.semcdb.2017.05.006. [DOI] [PMC free article] [PubMed] [Google Scholar]
- 18.Fantuzzi L, Tagliamonte M, Gauzzi MC, Lopalco L. Dual CCR5/CCR2 targeting: Opportunities for the cure of complex disorders. Cell Mol Life Sci. 2019;76:4869–86. doi: 10.1007/s00018-019-03255-6. [DOI] [PMC free article] [PubMed] [Google Scholar]
- 19.Zhou X, Liao W-J, Liao J-M, Liao P, Lu H. Ribosomal proteins: Functions beyond the ribosome. J Mol Cell Biol. 2015;7:92–104. doi: 10.1093/jmcb/mjv014. [DOI] [PMC free article] [PubMed] [Google Scholar]
- 20.Wei J, Kishton RJ, Angel M, Conn CS, Dalla-Venezia N, Marcel V, et al. Ribosomal proteins regulate MHC class I peptide generation for immunosurveillance. Mol Cell. 2019;73:1162–73.e5. doi: 10.1016/j.molcel.2018.12.020. [DOI] [PMC free article] [PubMed] [Google Scholar]
- 21.Goetzke CC, Ebstein F, Kallinich T. Role of proteasomes in inflammation. J Clin Med. 2021;10:1783. doi: 10.3390/jcm10081783. [DOI] [PMC free article] [PubMed] [Google Scholar]
- 22.Van der Heijden J, Oerlemans R, Lems W, Scheper R, Dijkmans B, Jansen G. The proteasome inhibitor bortezomib inhibits the release of NFkappaB-inducible cytokines and induces apoptosis of activated T cells from rheumatoid arthritis patients. Clin Exp Rheumatol. 2009;27:92–8. [PubMed] [Google Scholar]
- 23.Ichikawa HT, Conley T, Muchamuel T, Jiang J, Lee S, Owen T, et al. Beneficial effect of novel proteasome inhibitors in murine lupus via dual inhibition of type I interferon and autoantibody‐secreting cells. Arthritis Rheum. 2012;64:493–503. doi: 10.1002/art.33333. [DOI] [PMC free article] [PubMed] [Google Scholar]
- 24.Mishto M, Bellavista E, Ligorio C, Textoris-Taube K, Santoro A, Giordano M, et al. Immunoproteasome LMP2 60HH variant alters MBP epitope generation and reduces the risk to develop multiple sclerosis in Italian female population. PloS One. 2010;5:e9287. doi: 10.1371/journal.pone.0009287. [DOI] [PMC free article] [PubMed] [Google Scholar]
- 25.Qiao S-W, Sollid LM, Blumberg RS. Antigen presentation in celiac disease. Curr Opin Immunol. 2009;21:111–7. doi: 10.1016/j.coi.2009.03.004. [DOI] [PMC free article] [PubMed] [Google Scholar]
- 26.Maiuri MC, De Stefano D, Mele G, Fecarotta S, Greco L, Troncone R, et al. Nuclear factor κB is activated in small intestinal mucosa of celiac patients. J Mol Med. 2003;81:373–9. doi: 10.1007/s00109-003-0440-0. [DOI] [PubMed] [Google Scholar]
- 27.Lania G, Nanayakkara M, Maglio M, Auricchio R, Porpora M, Conte M, et al. Constitutive alterations in vesicular trafficking increase the sensitivity of cells from celiac disease patients to gliadin. Commun Biol. 2019;2:1–13. doi: 10.1038/s42003-019-0443-1. [DOI] [PMC free article] [PubMed] [Google Scholar]
Associated Data
This section collects any data citations, data availability statements, or supplementary materials included in this article.
Supplementary Materials
The constructed network of CeD group with all DEGs
The constructed network of FDR group with all DEGs
The constructed network of downregulated DEGs in CeD group
The constructed network of upregulated DEGs in CeD group
The constructed network of downregulated DEGs in FDR group
The constructed network of upregulated DEGs in FDR group
Data Availability Statement
The datasets generated and/or analysed during the current study are available in the Gene Expression Omnibus (GEO) repository with accession number GSE112102, [https://www.ncbi.nlm.nih.gov/geo].