

Abstract
The study of hydrogen concentration distribution law of hydrogen-doped methane pipeline is directly related to the safety and stability of hydrogen-doped methane pipeline network. Based on the theory of fluid dynamics, this paper established a model of hydrogen-doped methane pipeline and simulated the operation and shutdown status of hydrogen-doped methane pipeline by adopting the computational fluid dynamics method and selecting the mixture multiphase model and standard k - ε turbulence model. This paper investigates the hydrogen concentration distribution law in hydrogen-doped methane pipelines as well as the influence law of different hydrogen-doping ratios, operating flow velocities, operating pressures, shutdown time and gas usage on the hydrogen concentration distribution in gas pipeline. The results show that: under the operation condition, there is a weak uneven distribution of hydrogen in the pipeline, the hydrogen-doping ratio, flow velocity, pressure on the hydrogen volume fraction of the change in the 0.9% or less, the effect can be ignored; in the shutdown status, there is a clear stratification phenomenon, the hydrogen-doping ratio increased from 10 to 25%, the change in the volume fraction of hydrogen in the 11.2% or less, a positive correlation; with the extension of the shutdown time to 900s, the pipeline firstly appeared obvious stratification phenomenon in the branch pipe, the thickness of the gas with hydrogen volume fraction above 40% on the upper wall surface of the branch pipe increased to 0.7 mm, and after the shutdown time was extended to 10 h, obvious stratification phenomenon appeared in the main pipeline, and the volume fraction of hydrogen near the top of the main pipe of about 16.5 mm was above 30%, which was positively correlated; In the shutdown status, the shutdown time has the greatest effect on the stratification phenomenon in the pipe, followed by the hydrogen-doping ratio, and the gas usage has the least effect.
Keywords: Hydrogen-doped methane gas, Hydrogen concentration distribution, Numerical simulation, Pipeline
Subject terms: Energy science and technology, Natural gas
Introduction
In the face of the deteriorating global climate environment and rising demand for energy, accelerating energy transition and reducing carbon emissions have become the first choice for solving environmental and energy problems1–3. Hydrogen energy as a clean and efficient secondary energy is being studied and utilized one after another4. The hydrogen energy industry chain is long and involves a wide range of technical fields and numerous categories, among which hydrogen storage and transportation accounts for about one-third of the total industry chain operation cost, which is one of the main bottlenecks restricting the large-scale development of hydrogen energy industry5–7. Among the storage and transportation methods of hydrogen energy, blending hydrogen into natural gas pipeline for transportation with lower economic cost can effectively solve the problem of large-scale transportation of hydrogen, which is of great significance for enriching the gas source, reducing carbon emission, protecting the environment, and promoting the development of energy industry8.
Hydrogen blending in urban gas pipeline network is the main transportation method for downstream residential and industrial users. Compared with natural gas long-distance pipeline, urban gas pipeline network is more complex in terms of user types and pressure rating system, more diverse pipe types, and more complicated in terms of external environment and external loads9. At the same time, the separation of lower content hydrogen- blended natural gas faces greater economic constraints, and lower content hydrogen- blended natural gas can be directly applied in conventional natural gas-based household gas appliances, so at the present stage, direct transmission of hydrogen- blended natural gas at the end of the gas pipeline network can be better to reduce the cost10, 11. The sensitivity of various types of users and different pressure levels to hydrogen is different, and it is of great significance to realize the safe and efficient transportation of hydrogen-doped methane without changing the existing pipeline network and user facilities. However, hydrogen blending into natural gas changes the composition of the pipeline gas, resulting in changes in physical parameters such as compression factor, density, viscosity, and heat generation12. Meanwhile, due to the density difference between hydrogen and natural gas, there is a volume fraction inhomogeneity of hydrogen-doped methane, resulting in stratification in the hydrogen-doped methane transmission pipeline13, 14. Uneven mixing of hydrogen and natural gas is a major safety hazard that affects the safe operation of pipelines, especially for urban gas pipelines, the local hydrogen concentration is too high, which may lead to hydrogen brittleness of the pipeline, hydrogen bubbling and hydrogen corrosion and other risks15, 16, which have an impact on the mechanical properties of the pipe, coupled with the danger of gas pipeline transmission itself, the use of the existing gas pipeline transmission of hydrogen-doped methane has safety problems17, 18. Due to the small molecular volume of hydrogen, the permeation velocity of hydrogen-blended gas is relatively large. In PE pipes and sealing materials of urban gas pipeline network, hydrogen permeability coefficient is 4–5 times larger than that of methane, and hydrogen permeability coefficient in most sealing materials is larger than that of PE pipes, especially the permeability coefficients in natural rubber and nitrile rubber are 26 and 21 times larger than that in PE pipes, respectively, and permeability coefficients increase with the increase of pipeline pressure. Therefore, there is a risk of permeation leakage in hydrogen-enriched areas19. Meanwhile, the explosion limit of hydrogen is 4.0–75.9%, and the explosion limit of methane is 5–15%, and the explosion limit of hydrogen is wide, which is more dangerous than the explosion of methane, and once a leak occurs after blending hydrogen into natural gas there may be a high-speed jet flame20, 21. Therefore, to study the uniformity of hydrogen-blended gas pipeline delivery in urban areas, to predict the hydrogen-enriched areas, and to obtain the distribution law of hydrogen concentration under different influencing factors are the prerequisites and basic conditions for the safety of hydrogen-blended delivery in gas pipelines. At the same time, compared to long-distance pipelines and underground pipelines, hydrogen-doped gas pipelines to households are characterized by unstable operation status. When residential gas demand is high, the pipeline is in flow status during peak gas consumption; when residential gas demand is low, the pipeline is in shutdown status during non-peak gas consumption. And it is common for pipelines to be in shutdown status. When the pipeline is in the shutdown status, the phenomenon of stratification is more likely to occur inside the pipeline. Therefore, it is a prerequisite and basic condition for the safety of hydrogen doping in gas pipelines to study the homogeneity of the gas mixture in the town, to predict the hydrogen-enriched area, and to obtain the distribution law of hydrogen concentration in the shutdown status pipeline and the flow status pipeline under different influencing factors.
At present, the research on hydrogen-doped methane pipeline transport mainly includes experimental research and numerical simulation research, and most of the scholars at home and abroad mainly carry out the research through numerical simulation method, while relatively less research is carried out through experimental way. Uilhoorn et al.22 found that the temperature drop and pressure drop of natural gas pipeline decreases after hydrogen blending. Hafsi et al.23 focused on the flow pattern of hydrogen -doped natural gas in a circular pipeline network and found that increasing the hydrogen-doping ratio decreases the pressure fluctuation and the power of the gas delivered in the pipeline. Abd et al.24 investigated the effect of hydrogen concentration in natural gas on the flow performance and the characteristics of the gas, the results showed that the presence of hydrogen in the mixture increases the critical pressure and decreases the critical temperature. Elaoud25 numerically analyzed the flow of a high-pressure hydrogen-doped methane mixture in a pipeline network under steady state and transient conditions and concluded that hydrogen blending has a significant effect on transient pressure and flow characteristics. The “Hy Deploy” natural gas hydrogen blending project was carried out by Energy Supply UK in 201726, and in the first phase of the project, safety experiments were conducted at the University of Keele, which concluded that the addition of hydrogen at a molar mass fraction of 20% can be safely operated using an existing natural gas pipeline27. The turbulence models commonly used by most scholars in multiphase flow problems include the standard - model, the RNG - model, and the realizable - model. For example, in Ghazanfari V’s study on the influence of nanofluids on the efficiency of heat exchangers, the turbulence models used then include the standard - model, RNG - model, and realizable - model28. Domestic and foreign scholars have also conducted some research on the phenomenon of hydrogen aggregation in hydrogen-doped methane pipeline. Marangon et al.29 experimentally tested the diffusion process of hydrogen-methane mixture from the bottom of a closed box filled with oxygen, and after stopping the injection for 0.78 h, there was an 8% difference in the concentration of hydrogen-methane mixture between the top and the bottom of the box, which indicated that there was a tendency of stratification of the gas mixing after static. Wu 30 conducted a simulation test study of hydrogen-doped methane static in a riser, and the results of the study showed that the hydrogen-doped methane riser does not undergo stratification in the static state. Ren et al.31, 32 studied the effect of inhomogeneous methane-air distribution on gas mixture combustion in closed containers by combining numerical simulation and experiment, and the results showed that the concentration distribution of gas mixture was not uniform under the effect of gravity, and the bigger the container with the larger length-to-diameter ratio, the bigger the gradient of the concentration distribution of gas mixture. Liu et al. 33 used the theoretical method of computational fluid dynamics to construct a mixing model of hydrogen-doped methane, and simulated the change of hydrogen volume fraction under the conditions of storage cylinder, pipeline shutdown, and pipeline flow to obtain the distribution law of the volume fraction of hydrogen components of hydrogen-doped methane under certain parameters. An et al. 34 used CFD software to numerically simulate T-shaped doped pipelines and variable diameter doped pipelines under hydrogen and natural gas doping conditions. The results show that for the T-shaped doped pipeline, there is still significant stratification within the pipe length 35 times the pipe diameter, and the width occupies 1/3 of the pipe diameter. For variable-diameter blending lines, it was found that the closer the variable diameter to the blending center, the narrower the diameter, and the lower the height, the more likely hydrogen enrichment would occur. Zhu et al. 35 investigated the process of static gas stratification after stopping the transmission of undulating natural gas pipelines uniformly blended with different volume ratios of hydrogen, focusing on the effect of height difference on the development of static stratification and the highest volume ratio of hydrogen after stabilization. Yan et al.36 numerically simulated the natural gas blending process with different gas compositions and found that the concentration of the natural gas components varied along the course downstream of the confluence point. Some of the components reached a uniform distribution of cross-section concentration at 150 m from the sink, and the uniform mixing of all components was realized at 280 m. The choice of turbulence model is also a matter of concern in pipeline flow simulation. For example, in Ghazanfari V’s study, the influence of twisted tubes and Al2O3 nanofluid on the thermal performance of the shell and tube heat exchanger is numerically studied. It employed computational fluid dynamics (CFD) with different turbulence models (realizable - and realizable - 2nd order). The results were compared with the published study in which the first-order realizable - model was nominated as the acceptable method 37. In the research related to hydrogen-doped methane in pipeline transmission, there are relatively few studies on the stratification state, especially for the hydrogen aggregation phenomenon in low-pressure urban gas pipelines, and there is a lack of research on the impact of complex gas usage situations.
This paper focuses on the hydrogen concentration distribution law of hydrogen-doped methane in flow status pipeline and shutdown status pipeline, and further researches the influence law of different hydrogen doping ratios, operating flow velocities, operating pressures, shutdown time and gas usage on the distribution of hydrogen concentration in gas pipeline.
Materials and methods
Model assumption
In this paper, the distribution law of hydrogen concentration in hydrogen-doped methane pipelines and the influencing factors are investigated by numerical simulation. The main mathematical models involved are mixture multiphase model and gas turbulence model. The gas turbulence model is standard - turbulence model.
Mixture multiphase model
The Mixture model is a simplified Eulerian multiphase flow model that can be employed to simulate multiphase flows comprising phases moving at disparate velocities, or multiphase flows comprising n phases (fluids or particles). This is achieved by solving the momentum, continuity, and energy equations of the mixture, the volume fraction equations of the secondary phases, and the algebraic expressions for the relative velocities. Solve the governing equation for the hydrogen-doped methane stratification process as:
| 1 |
| 2 |
Of which:
| 3 |
| 4 |
| 5 |
| 6 |
| 7 |
where is the mixture density, kg/m3; is the kth phase density, kg/m3; is the time, s; is the average velocity of the mixture, m/s; is the velocity of the kth phase, m/s; is the volume fraction of the kth phase (hydrogen and natural gas); n is the number of phases; is the mixture kinetic viscosity, Pa· s; is the kth phase kinetic viscosity, Pa· s; is the drift velocity, m/s; is the static pressure, Pa; is the gravitational acceleration, m/s2.
Standard k - ε turbulence model
The standard - model has advantages of high simulation accuracy, moderate computational volume and large accumulation of data, and a wide range of applications. Considering that the flow from the main pipeline to the branch pipeline is in a turbulent state in this model. Therefore, in this paper, the standard - turbulence model is chosen to keep the set of equations closed:
| 8 |
| 9 |
where , and are empirical constants taken as 1.45, 1.30 and 1.90 respectively.
Basic parameters setting
Geometrical model and basic parameters
The research calculations in this paper are scenarios for the study of hydrogen concentration distribution in hydrogen-doped methane pipelines.
The geometric model of the hydrogen-doped methane pipeline consists of a main pipeline and three horizontal branch pipelines. The diameter of the main pipeline is 50 mm and the height is 9,735.5 mm. The diameter of the branch pipeline is 25 mm and the length is 1,500 mm. The Y-axis negative direction is the direction of gravity and the acceleration of gravity is 9.81 m/s2. Taking the center point of the circular surface at the bottom of the main pipeline as the origin, the main pipeline rises vertically in the direction of gravity and branches out into three horizontal branch pipelines at y = 3,000 mm, y = 6,000 mm, and y = 9,000 mm respectively. The horizontal branch pipeline is extended in the positive direction along the x-axis. The horizontal branch pipelines are parallel to each other, and the distance between the branch pipelines is 3,000 mm. Figure 1 shows the schematic diagram of the three-dimensional geometric model established in the CFD fluid dynamics software.
Fig. 1.

Hydrogen-doped methane pipeline geometrical model schematics.
In this simulation, a mixture of methane and hydrogen is chosen instead of a mixture of natural gas and hydrogen to achieve a simplified study of stratification phenomena after hydrogen blending in gas pipelines. Methane is the main component of natural gas and is relatively less dense than the other components. If stratification exists in hydrogen-methane mixtures, it is more pronounced in hydrogen-natural gas. The physical parameters of methane and hydrogen are shown in Table 1.
Table 1.
Physical parameters of methane and hydrogen.
| Gas | Relative density | Volume low calorific value (MJ m−3) |
Mass low calorific value (MJ kg−1) |
Flame speed (cm s−1) | Minimum Ignition Energy (MJ) |
|---|---|---|---|---|---|
| CH4 | 0.5548 | 34.04 | 50.3 | 43 | 0.033 |
| H2 | 0.0695 | 10.23 | 119.9 | 350 | 0.018 |
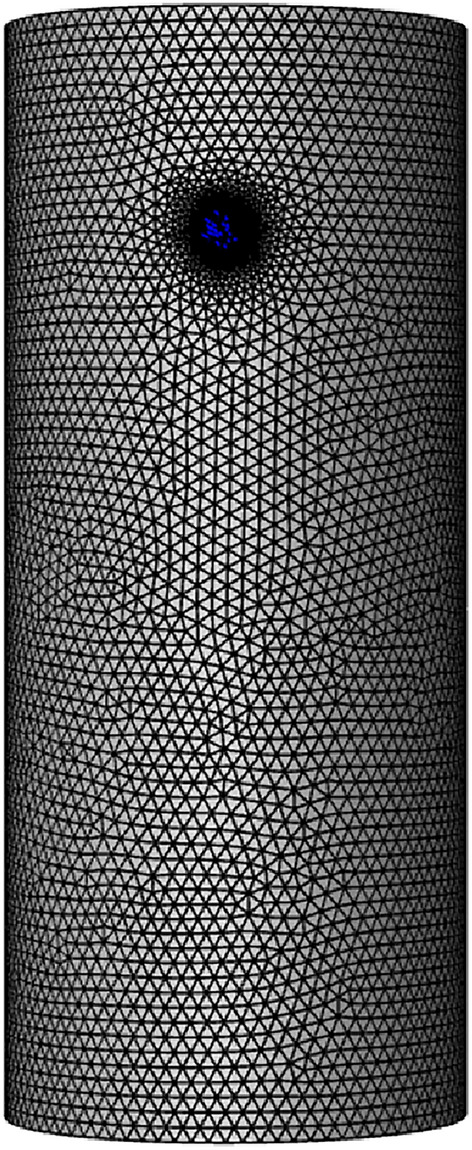
The geometrical model shown is divided using the structured mesh and local encryption of the mesh is done near the inlet of the pipe, the outlet of the pipe, the wall of the pipe, and the reducer. Three monitoring points (S1.1-S3.3) were set at 1 mm from the upper wall surface, at the center of the cross-section, and at 1 mm from the lower wall surface of each branch pipe, and one monitoring point was set at the center of the top of the main pipe, S4. As shown in Fig. 2, a total of 10 monitoring points were set up to monitor the aggregation of hydrogen as well as the changes in hydrogen concentration. The number of mesh cells is changed by changing the mesh cell size, and the total number of meshes is 450,269, 604,262, 802,778, 936,874, 1123,650 in order. This simulation adopts the mixture multiphase model, the pipe inlet is set as the pressure inlet, and the pipe outlet is set as the velocity outlet. In the process of calculating, the heat transfer with the outside world is not considered, and the pipe wall is an adiabatic wall surface. A pipe pressure of 5 kPa, a flow velocity of 2.26 m/s, and a hydrogen-doping ratio of 15% were set to perform grid-independence tests on five grid models. Table 2 shows the results of the comparison between the maximum hydrogen volume fraction and the hydrogen volume fraction at the three monitoring points S1.1, S2.1, and S3.1 at 1 mm above the upper wall at the end of the three branch pipes at different numbers of meshes.
Fig. 2.

Localized diagram of the mesh.
Table 2.
Comparison of simulation results with different number of meshes.
| No. | Number of mesh | Hydrogen volume fraction (%) | |||
|---|---|---|---|---|---|
| Maximum value | S1.1 | S2.1 | S3.1 | ||
| Mesh-1 | 450,269 | 0.1523795 | 0.1521678 | 0.1523700 | 0.1522053 |
| Mesh-2 | 604,262 | 0.1532269 | 0.1525320 | 0.1529804 | 0.1525505 |
| Mesh-3 | 802,778 | 0.1542590 | 0.1533246 | 0.1539689 | 0.1533706 |
| Mesh-4 | 936,874 | 0.1542448 | 0.1533096 | 0.1539567 | 0.1533690 |
| Mesh-5 | 1,123,650 | 0.1542460 | 0.1533099 | 0.1539578 | 0.1533691 |
From Table 2, it can be seen that the choice of Mesh-3 (total number of meshes 802,778) has achieved the expected computational accuracy. Meanwhile, considering the computational power problem, if the mesh is too dense, it occupies larger computational resources. Therefore, Mesh-3 with a total number of 802,778 meshes is selected for numerical calculations in this study, and Fig. 2 shows a localized schematic of the meshes used.
Ultimately, the models and computational methods selected for this study include the following:
About the selection of the mesh: the total number of meshes selected is 802,778, and the meshes near the pipeline inlet, pipeline outlet, pipeline wall, and reducer are encrypted. Taking the pipeline wall as the boundary, the number of boundary layer mesh layers is set to 5, and the height growth rate of layer height is 1.2, which is used to capture the simulation data of the boundary layer.
Regarding the choice of solver: a three-dimensional double-precision, pressure-based solver is chosen. The heat transfer with the outside is not considered, the pipeline wall is an adiabatic wall boundary. The steady state calculation is used for the pipeline flow status and the transient calculation is used for the pipeline shutdown status, and the convergence criterion of the residuals in the calculation monitoring is 10−6. The direction of gravity along the Y-axis is set to be − 9.81 m/s2.
For model selection: The Mixture model was chosen, with phase1 set to methane and phase2 set to hydrogen. The turbulence model chosen is the standard - model.
Setting of the solution algorithm: SIMPLE algorithm and first-order windward format of the pressure-velocity coupling method are used for the calculation.
Setting of boundary conditions: In flow status, the pipeline inlet is set as the boundary of pressure inlet, and the pipeline outlet is set as the boundary of velocity outlet (by selecting the velocity inlet, and at the same time, the velocity takes a negative value to realize the setting of velocity outlet). In the calculation process, the heat transfer with the outside is not considered, and the pipeline wall is the adiabatic wall boundary. Table 3 shows the boundary conditions of the pipeline in flow status.
Table 3.
Boundary condition setting (flow status).
| Boundary name | Boundary condition | Clarification |
|---|---|---|
| Inlet1、Inlet2 | Pressure-inlet | – |
| Outlet | Velocity -inlet | Taking a negative value to achieve velocity outlet |
| Wall | Wall | Adiabatic wall |
| Fluid | Fluid | – |
The simulation study in the shutdown status is based on the steady state results when entering the shutdown status, and the results of the flow status are used as the initial conditions for the transient simulation in the shutdown status, with all the pipeline inlets and pipeline outlets closed, and the boundary type of all the entrances and exits is selected as wall. the pipeline is set up as all-wall to realize the simulation in the shutdown status. The simulation of the pipe in shutdown status adopts transient calculation, in which the time step of the 10 h shutdown simulation is 1 s, and the time step of the rest of the simulation is 0.1 s. In the calculation process, the heat transfer with the outside is not considered, and the pipeline wall is the adiabatic wall boundary. Table 4 shows the boundary conditions of the pipeline in shutdown status.
Table 4.
Boundary condition setting (shutdown status).
| Boundary name | Boundary condition | Clarification |
|---|---|---|
| Inlet1、Inlet2 | Wall | – |
| Outlet | Wall | – |
| Wall | Wall | Adiabatic wall |
| Fluid | Fluid | – |
Control variable settings
This paper focuses on the distribution of hydrogen concentration in a hydrogen-doped methane pipeline under flow status and shutdown status, and the main control variables are hydrogen-doping ratio, flow velocity, pressure, shutdown time and gas usage. A total of 25 cases are set up in this simulation, as shown in Table 5.
Table 5.
Case parameter settings.
| Case | Pipeline operating status | Hydrogen-doping ratio (%) | Flow velocity (m/s) | Pressure (Pa) | Time (s) | |
|---|---|---|---|---|---|---|
| 1 | Full flow status | 15 | 2.26 | 5000 | – | |
| 2 | Full flow status | 10 | 2.26 | 5000 | – | |
| 3 | Full flow status | 20 | 2.26 | 5000 | – | |
| 4 | Full flow status | 25 | 2.26 | 5000 | – | |
| 5 | Full flow status | 15 | 1.695 | 5000 | – | |
| 6 | Full flow status | 15 | 2.825 | 5000 | – | |
| 7 | Full flow status | 15 | 3.390 | 5000 | – | |
| 8 | Full flow status | 15 | 2.260 | 3000 | – | |
| 9 | Full flow status | 15 | 2.260 | 7000 | – | |
| 10 | Full shutdown status | 15 | – | 5000 | 150 | |
| 11 | Full shutdown status | 15 | – | 5000 | 300 | |
| 12 | Full shutdown status | 15 | – | 5000 | 450 | |
| 13 | Full shutdown status | 15 | – | 5000 | 600 | |
| 14 | Full shutdown status | 15 | – | 5000 | 750 | |
| 15 | Full shutdown status | 15 | – | 5000 | 900 | |
| 16 | Full shutdown status | 10 | - | 5000 | 600 | |
| 17 | Full shutdown status | 20 | - | 5000 | 600 | |
| 18 | Full shutdown status | 25 | – | 5000 | 600 | |
| 19 | Full shutdown status | 15 | – | 5000 | 36,000 | |
| 20 | First branch shutdown | 15 | 2.260 | 5000 | 300 | |
| 21 | Second branch shutdown | 15 | 2.260 | 5000 | 300 | |
| 22 | Third branch shutdown | 15 | 2.260 | 5000 | 300 | |
| 23 | First and second branch shutdown | 15 | 2.260 | 5000 | 300 | |
| 24 | First and third branch shutdown | 15 | 2.260 | 5000 | 300 | |
| 25 | Second and third branch shutdown | 15 | 2.260 | 5000 | 300 | |
The hydrogen-doping ratios are set at 10%, 15%, 20% and 25% by synthesizing the hydrogen blending demonstration projects around the world and the studies of other scholars. The setting of flow velocity according to the relevant standards and the data of domestic gas, the consumption of natural gas for single-eye stove is 0.1–0.4 m3/h, and the water heater is 2 m3/h. If both double-eye stove and water heater are used at the same time, the flow velocity can be up to 2.8 m3/h. Meanwhile, taking into account the corrections and the safety coefficients, the basic flow velocity of this study is set to be 4 m3/h, and the basic flow velocity of the branch pipe is 2.26 m/s. The simulated flow velocity values are set at 0.75–1.5 times the base flow velocity, namely 1.695 m/s, 2.260 m/s, 2.825 m/s, and 3.390 m/s. The indoor gas pressure is based on the Liaoning Chaoyang Hydrogen Blending Demonstration Project, and this simulation sets the base pressure at 5 kPa, and sets the pressure control groups at 3 and 7 kPa. Six different gas usage scenarios are set up, taking into account the fact that some of the branches may be in operation, and some of them are in a shutdown status at different times of the day when the gas is being used by the users.
Numerical method verification
There is no research report on the shutdown stratification experiments of hydrogen and methane gas mixtures. Therefore, in order to prove the reliability of the model established in this paper, the experimental results of methane diffusion by injection into an air-filled closed tank were chosen for simulation verification38. A model identical to the experimental setup in the literature was developed as shown in Fig. 3. The height of the tank is 0.33 m, the diameter of the tank is 0.14 m, the wall thickness is 10 mm, the initial pressure is 1 MPa, and the initial temperature is 294 K. The filling inlet is located at 4/5 of the height of the vessel, and the diameter of the circular filling inlet is 10 mm, and the filling pressure is 0.11 MPa. The simulation is performed using the multiphase flow Mixture model, the SIMPLE algorithm, transient calculations and parameter settings are exactly the same as the experiments. The mesh adopts tetrahedral grids with the number of 253,233. Time step set to 0.01s and the convergence criterion of the residuals in the calculation monitoring is 10−6. Heat transfer to the outside is not considered in the calculation process.
Fig. 3.
The model of numerical method verification.
In the cited literature, the average methane concentrations measured at 1/5 and 4/5 vessel height were 14.2 and 15.9%, respectively. In the simulation results, the methane concentrations at 1/5 and 4/5 vessel height were 14.52132 and 15.4962%, respectively. Figure 4 shows the comparison between the simulation and experimental results.
Fig. 4.
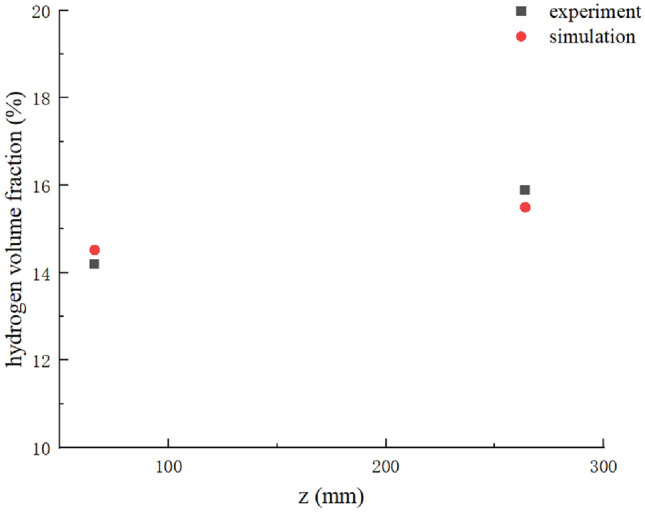
Numerical method verification results graph.
As shown in Fig. 4, the simulated values can be in good agreement with the experimental values, and the maximum error is only 2.54%. Therefore, it can be considered that it is feasible to use this numerical simulation method to simulate the stratification phenomenon of hydrogen-doped methane.
Results and discussion
Pipeline flow status
Cases 1-9 are numerical simulations of hydrogen concentration distribution in hydrogen-doped methane pipeline under flow status. This part of the simulation is based on case 1, to explore the stratification phenomenon in the pipeline under the flow status of hydrogen-doped methane pipeline, and to carry out the research on the influence of hydrogen-doping ratio, flow velocity and pressure on the hydrogen concentration distribution law in the hydrogen-doped methane pipeline under flow status. In analyzing the factors influencing the phenomenon of stratification in the pipeline under flow status, the method of changing a single parameter and controlling the other parameters to be fixed is adopted. The effects of changes in the hydrogen doping ratio, flow velocity, and pressure on the distribution law of hydrogen concentration in the hydrogen-doped methane pipeline were studied separately and individually.
Stratification phenomenon in pipeline flow status
Based on case 1, the pipeline is initially filled with a well-mixed methane-hydrogen gas with a methane volume fraction of 85% and a hydrogen volume fraction of 15%. The flow inside the hydrogen-blended gas pipeline is simulated at a hydrogen-doping ratio of 15%, a pressure of 5 kPa and a flow velocity of 2.26 m/s. As shown in Fig. 5, the hydrogen-doped methane showed a non-uniform distribution of hydrogen concentration during the flow in the gas pipeline. As the horizontal flow distance increases, in the region near the upper wall surface of the three branches of the model, a red region representing a higher hydrogen volume fraction appears, which represents a localized increase in hydrogen concentration in the horizontal branch in the region near the upper wall surface. In the region near the lower wall of the three branches of the model, a blue region representing a lower hydrogen volume fraction appears, which represents a localized decrease in hydrogen concentration in the horizontal branch near the lower wall.
Fig. 5.

Cloud figure of hydrogen volume fraction distribution for hydrogen-doped methane pipeline model (flow status).
As shown in Fig. 6, the cross sections were taken at 0.4 m, 0.9 m and 1.2 m of the second branch pipe along the flow direction and the contour cloud plots of hydrogen volume fraction distribution were generated. In Fig. 6, the pipeline cross-section cloud map at 0.4 m along the flow direction of the branch pipe shows uniform coloring, at which point the hydrogen and methane are more evenly mixed. With the increase of the horizontal flow distance, the upper wall area of the pipeline cross-section cloud map at 0.9 m shows a localized yellow color, and the upper wall area of the pipeline cross-section cloud map at 1.2 m shows a red color representing a higher hydrogen volume fraction. The gas mixture in the branch gradually becomes inhomogeneous from a uniformly mixed state, with increasing contour lines and gradients.
Fig. 6.

Cloud figure of hydrogen volume fraction distribution in the second branch pipe (flow status).
The hydrogen volume fraction data of the three horizontal branch pipes were taken at equal distance from 0.4 m to 1.2 m along the flow direction, 1 mm from the upper wall and 1 mm from the lower wall and read for graphing. The hydrogen volume fraction change curve of each horizontal branch along the flow direction was obtained, as shown in Fig. 7. With the increase of flow distance, the three curves at 1 mm from the lower wall surface of the three branches showed a gradual decreasing trend, and the hydrogen volume fraction decreased from about 14.87% to about 14.66%, with an average decrease of 0.21%. The three curves at 1 mm from the upper wall surface of the three branches showed a gradual increasing trend, and the hydrogen volume fraction increased from about 15.06% to about 15.27%, with an average increase of 0.21%. The decreasing value of hydrogen volume fraction is basically equal in magnitude to the corresponding increasing value of hydrogen volume fraction. This is consistent with the changes in the cloud diagram in Fig. 6.
Fig. 7.
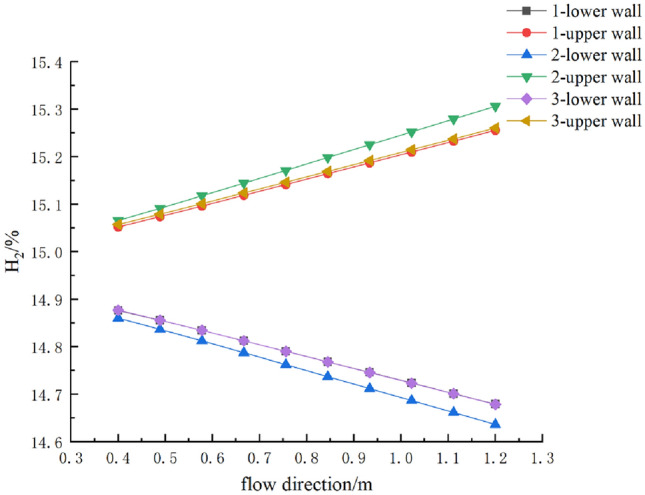
Hydrogen volume fraction change curve in horizontal branch flow direction.
Figure 7 Hydrogen volume fraction change curve in horizontal branch flow direction.
The density of hydrogen is much less than that of methane, and under the effect of gravity, the less dense hydrogen will drift upward in the direction of gravity. In the flow state, a low-flow zone occurs near the wall of the pipeline, and the closer to the wall, the lower the flow velocity of the fluid. This causes hydrogen to accumulate more easily near the upper wall surface. The phenomenon of non-uniform distribution of hydrogen in the pipeline is slowly presented. At the same time, when the hydrogen-doped natural gas enters the branch pipe along the main pipe, the flow direction is changed, at this time, the turbulence intensity of the fluid in the pipeline is larger, and the hydrogen and natural gas are mixed more evenly. With the increase of the flow distance, the flow in the pipe tends to stabilize, and the turbulence intensity is weakened. The upward drift of hydrogen along the direction of gravity is enhanced at this time, and a weak non-uniform distribution of hydrogen volume fraction occurs in the pipeline.
Therefore, it can be concluded that in the flow status, hydrogen-blended natural gas pipeline in the horizontal pipeline of gas pipeline, with the increase of the flow distance, the hydrogen gas gradually drifts upward inside the pipeline, and there will be a slight non-uniform distribution phenomenon of hydrogen gas. The hydrogen volume fraction distribution is higher up and lower down, and a slight stratification phenomenon occurs.
Analysis of the effect of hydrogen-doping ratio on hydrogen concentration distribution law in the flow status of pipelines
In order to study the hydrogen concentration distribution law in the hydrogen-doped methane pipeline, and to further investigate the effect of hydrogen-doping ratio on the hydrogen concentration distribution in the hydrogen-doped methane pipeline, this section carries out the study based on Case 1. The fixed flow velocity is 2.26 m/s, the pressure is 5 kPa, and the hydrogen-doping ratios are changed to 10%, 15%, 20%, and 25% in order to carry out the numerical simulation of hydrogen distribution in hydrogen-doped methane pipeline with different hydrogen-doping ratios under the flow status of the pipeline. Table 6 shows the maximum and minimum values of hydrogen volume fraction and the gradient values of hydrogen volume fraction in hydrogen-doped methane pipelines with different hydrogen-doping ratios under the flow status of the pipelines.
Table 6.
Simulation results of different hydrogen-doping ratios (flow status).
| Hydrogen-doping ratios (%) | Hydrogen volume fraction (%) | |||||
|---|---|---|---|---|---|---|
| S1.1 | S2.1 | S3.1 | Minimum value | Maximum value | Gradient value | |
| 10 | 10.24490 | 10.29245 | 10.24828 | 9.64653 | 10.31411 | 0.66758 |
| 15 | 15.33246 | 15.39689 | 15.33706 | 14.51901 | 15.42590 | 0.90689 |
| 20 | 20.39863 | 20.47650 | 20.40432 | 19.42199 | 20.51131 | 1.08932 |
| 25 | 25.44664 | 25.53284 | 25.45276 | 24.35324 | 25.57165 | 1.21841 |
In Table 6, the gradient of hydrogen volume fraction in the hydrogen-doped methane pipeline in the gravity direction increased from 0.66758 to 1.21841% as the hydrogen-doping ratio increased from 10 to 25%. The hydrogen volume fraction at each monitoring point also increased with the increase in hydrogen-doping ratio. The upward drift of hydrogen along the direction of gravity was more pronounced. However, overall, there is no significant aggregation and the stratification in the pipeline is weak.
Figure 8 shows the hydrogen volume fraction distribution curves of the second branch pipe at 1 mm from the upper wall along the flow direction and at the end of the branch pipe along the radial direction with different hydrogen-doping ratios, respectively. In Fig. 8, the hydrogen-doped methane with different hydrogen-doping ratios showed a slow increase in the hydrogen volume fraction along the flow direction and a first increase, then stabilization and then increase along the radial direction.
Fig. 8.

Hydrogen volume fraction curves in branch flow direction and radial direction for different hydrogen-doping ratios.
Figure 9 shows the cloud figure of hydrogen volume fraction distribution in radial section at the end of the second branch pipe for different hydrogen-doping ratios. In Fig. 9, the arc-shaped region of increasing hydrogen concentration occurs in all the upper wall regions and the arc-shaped region of decreasing hydrogen concentration occurs in all the lower wall regions of the branch pipe, and the higher the hydrogen-doping ratio is, the larger the gradient of hydrogen volume fraction is. The density of hydrogen is small, the higher the hydrogen volume fraction in the pipeline under flow status, the greater the percentage of hydrogen drifting upward along the direction of gravity. The aggregation of hydrogen continues to accumulate, and the aggregation near the upper wall surface of the pipeline is relatively more obvious, and the hydrogen volume fraction gradient rises. Therefore, it can be concluded that the hydrogen-doping ratio has a slight effect on the hydrogen aggregation phenomenon under the flow status of the pipeline, which is positively correlated.
Fig. 9.

Cloud figure of hydrogen volume fraction distribution for different hydrogen-doping ratios (flow status).
Analysis of the effect of flow velocity on hydrogen concentration distribution law in the flow status of pipelines
In order to study the hydrogen concentration distribution law in the hydrogen-doped methane pipeline, and further study the effect of flow velocity on the hydrogen concentration distribution in the hydrogen-blended gas pipeline, this section is based on the case 1, and the numerical simulation of hydrogen distribution in the hydrogen-blended gas pipeline with different flow velocities under the pipeline flow status is carried out. The fixed hydrogen-doping ratio is 15%, the pressure is 5 kPa, and the flow velocity is changed to 1.695 m/s, 2.260 m/s, 2.825 m/s, and 3.390 m/s in order. Table 7 shows the maximum and minimum values of hydrogen volume fraction and the gradient values of hydrogen volume fraction in hydrogen-doped methane pipelines with different flow velocities under the flow status of the pipelines.
Table 7.
Simulation results at different flow velocities (flow status).
| Flow velocity (m/s) |
Hydrogen volume fraction (%) | |||||
|---|---|---|---|---|---|---|
| S1.1 | S2.1 | S3.1 | Minimum value | Maximum value | Gradient value | |
| 1.695 | 15.52092 | 15.62254 | 15.52737 | 14.27947 | 15.66812 | 1.38865 |
| 2.260 | 15.33246 | 15.39689 | 15.33706 | 14.51901 | 15.42590 | 0.90689 |
| 2.825 | 15.23355 | 15.27812 | 15.23627 | 14.64523 | 15.29867 | 0.65344 |
| 3.390 | 15.17184 | 15.20603 | 15.17492 | 14.71990 | 15.22148 | 0.50158 |
In Table 7, as the flow velocity increases from 1.695 m/s to 3.390 m/s, the minimum hydrogen volume fraction in the hydrogen-doped methane pipeline gradually increases and the maximum hydrogen volume fraction gradually decreases, and the gradient of hydrogen volume fraction in the hydrogen-doped methane pipeline in the gravity direction decreases from 1.38865 to 0.50158%. The hydrogen volume fraction at each monitoring point also decreased with increasing flow velocity.
Figure 10a shows the distribution curves of hydrogen volume fraction in the second branch pipe in the flow direction at a distance of 1 mm from the upper wall at different flow velocities. On the basis of other working conditions remaining unchanged, the hydrogen volume fraction increases with the distance of flow in the horizontal branch pipe to varying degrees. The smaller the flow velocity of hydrogen-doped methane, the faster the increase of hydrogen volume fraction in the flow direction. Figure 10b shows the distribution curve of hydrogen volume fraction in the gravity direction of the pipe diameter at the end section of the branch pipe. In the radial direction of the end section of the branch pipe, the hydrogen volume fraction shows a gradual decrease near the lower wall, a gradual increase near the upper wall, and a more stable trend in the middle of the pipe. The smaller the flow velocity, the larger the gradient of hydrogen volume fraction in the pipe, and the more obvious the change in the gravity direction.
Fig. 10.

Hydrogen volume fraction curves in branch flow direction and radial direction for different flow velocities.
Figure 11 shows the contour cloud figure of hydrogen volume fraction distribution at the end section of the second branch pipe for different flow velocities. In the flow branches with different flow velocities, there are arc-shaped regions of gradually increasing hydrogen concentration in the upper wall region of the branch, and arc-shaped regions of gradually decreasing hydrogen concentration in the lower wall of the branch. And the lower the flow velocity, the more dark-colored regions representing higher hydrogen volume fractions and the larger the hydrogen volume fraction gradient.
Fig. 11.

Contour cloud figure of hydrogen volume fraction distribution for different flow velocities.
Under the hydrogen-doped methane pipeline operating status, the higher the flow velocity of the fluid in the pipeline, the more unstable its flow status is, and the intensity of turbulence is greater. It will lead to the movement between hydrogen and methane is relatively more intense, and the hydrogen accumulation phenomenon is relatively weakened. From the above analysis of the simulation results, it can be concluded that under the flow status of the pipeline, the smaller the flow velocity is, the more obvious the phenomenon of hydrogen drifting upward and gathering in the hydrogen-doped methane pipeline.
Analysis of the effect of pressure on hydrogen concentration distribution law in the flow status of pipelines
In order to study the hydrogen concentration distribution law in the hydrogen-doped methane pipeline, and further study the effect of pressure on the hydrogen concentration distribution in the hydrogen-doped methane pipeline, this section is based on case 1, and numerical simulation of hydrogen distribution in the hydrogen-blended gas pipeline with different pressures in the flow status of the pipeline is carried out. The fixed hydrogen-doped methane pipeline blending ratio is 15%, the flow velocity is 2.260 m/s, and the flow velocity pressure is changed to 3 kPa, 5 kPa, and 7 kPa. Table 8 shows the maximum and minimum values of the hydrogen volume fraction and the gradient values of the hydrogen volume fraction in the hydrogen-doped methane pipeline with different pressures under the flow status of the pipeline.
Table 8.
Simulation results at different pressures (flow status).
| Pressure (Pa) |
Hydrogen volume fraction (%) | |||||
|---|---|---|---|---|---|---|
| S1.1 | S2.1 | S3.1 | Minimum value | Maximum value | Gradient value | |
| 3000 | 15.33211 | 15.39691 | 15.33684 | 14.51901 | 15.42593 | 0.90692 |
| 5000 | 15.33246 | 15.39689 | 15.33706 | 14.51901 | 15.42590 | 0.90689 |
| 7000 | 15.33212 | 15.39693 | 15.33682 | 14.51911 | 15.42593 | 0.90682 |
The pressure at the end of gas pipelines in town is low, especially in the pipelines entering households. Therefore, a pressure range of 3–5 kPa was used in this study. When the pressure range varied from 3 kPa to 7 kPa, the hydrogen volume fraction at each monitoring point did not change by more than 0.035%, the change in the lowest value of hydrogen concentration in the pipeline did not exceed 0.01%, the change in the highest value did not exceed 0.003%, and the change in the hydrogen volume fraction gradient did not exceed 0.01%. According to the simulation results, the change in pressure affects the hydrogen volume fraction inside the hydrogen-doped gas pipeline within 0.035%, and has little effect on the distribution of hydrogen volume fraction inside the hydrogen-doped methane pipeline.
The pressure change range receives the constraints of the operating range of the town gas pipeline, which is relatively small, and the effect of this change on the phenomenon of upward drift of hydrogen by gravity and the molecular movement in the pipeline is relatively small. Therefore, in the gas pipeline operating pressure range, the effect of pressure on the stratification phenomenon of the pipeline is negligible.
Sensitivity analysis of pipeline in flow status
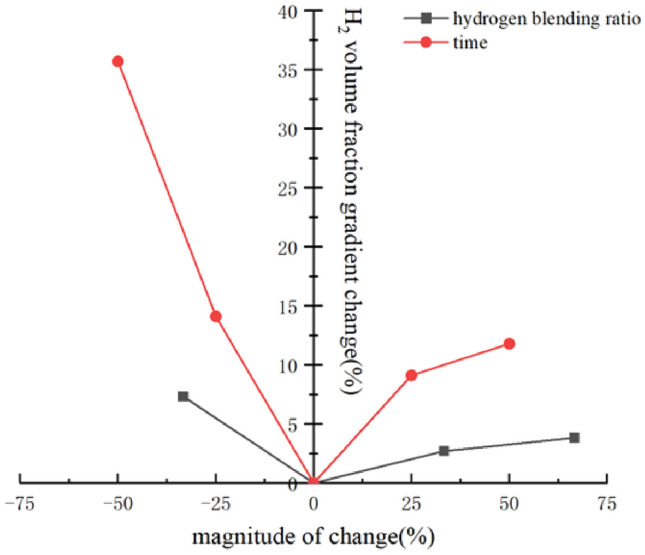
The ratio of the change in the gradient value of the hydrogen volume fraction within a hydrogen-doped methane pipeline to the change in the corresponding parameter value is used as the sensitivity coefficient. By comparing the sensitivity coefficients of different parameters, the degree of influence of a specific pipeline parameter on the phenomenon of non-uniform distribution of hydrogen in the pipeline was derived. A hydrogen doping ratio of 15%, a pressure of 5 kPa, and a flow rate of 2.26 m/s were selected as the base parameters. The sensitivity analysis was carried out by taking ± 75% of the base parameter value as the analysis interval, and the sensitivity analysis figure of the influence of each pipeline parameter on the gradient value of hydrogen volume fraction in the pipeline was obtained, as shown in Fig. 12.
Fig. 12.
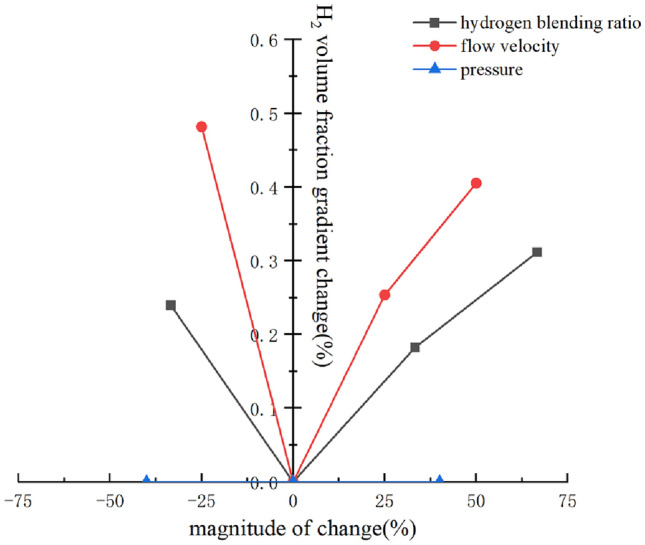
Sensitivity analysis curves of pipeline parameters (flow status).
The sensitivity analysis revealed that the influence of different parameters on the gradient value of hydrogen volume fraction in the hydrogen-doped methane pipeline varied greatly. The influence of flow velocity was the largest and had the highest sensitivity. The hydrogen doping ratio had the second highest effect. The sensitivity coefficient of pressure is the smallest, and its hydrogen volume fraction gradient value is almost unchanged in the selected analysis interval. Therefore, it can be concluded that under the flow status in the pipeline, the flow velocity in the pipeline has relatively the greatest influence on the phenomenon of upward drift and aggregation of hydrogen, followed by the hydrogen doping ratio, and the pressure has the smallest influence.
Pipeline shutdown status
Cases 10-25 show the numerical simulation study of hydrogen concentration distribution law of hydrogen-doped methane pipeline under shutdown status. In order to investigate the stratification phenomenon in the hydrogen-doped methane pipeline under the shutdown status, the study on the influence of hydrogen-doping ratio, shutdown time and gas usage on the hydrogen concentration distribution law in the hydrogen-doped methane pipeline under the shutdown status is carried out. In analyzing the factors influencing the phenomenon of stratification in the pipeline under shutdown status, the method of changing a single parameter and controlling the other parameters to be fixed is adopted. The effects of changes in the hydrogen doping ratio, shutdown time, and gas usage on the distribution law of hydrogen concentration in the hydrogen-doped methane pipeline were studied separately and individually.
Stratification phenomenon in pipeline shutdown status
In case 11, the pipe is initially filled with a well-mixed methane-hydrogen gas with a methane volume fraction of 85% and a hydrogen volume fraction of 15%. And a methane-hydrogen gas mixture with a hydrogen-doping ratio of 15% is injected into the pipe at a flow velocity of 2.26 m/s. After the operation was stabilized, the boundary conditions were set to full-wall, and transient calculations were performed to simulate the shutdown condition inside the hydrogen-doped methane pipeline at a hydrogen-doping ratio of 15%, a pressure of 5 kPa, and a shutdown time of 300s. Figure 13 shows a cloud figure of the hydrogen volume fraction distribution after the calculation under the above simulation conditions. Due to the large gradient of the hydrogen volume fraction, the zoomed-in three horizontal branches were turned around the X-axis by 90° to show a top-down view for convenient observation. As shown in Fig. 13, during the 300s shutdown of the hydrogen-doped methane pipeline, a non-uniform distribution of hydrogen concentration was observed in all three branch pipes. As the horizontal flow distance increases, in the region near the upper wall surface of the three branches of the model, a red region representing a higher hydrogen volume fraction appears, which represents a localized increase in hydrogen concentration in the horizontal branch in the region near the upper wall surface. In the region near the lower wall of the three branches of the model, a blue region representing a lower hydrogen volume fraction appears, which represents a localized decrease in hydrogen concentration in the horizontal branch near the lower wall.
Fig. 13.

Cloud figure of hydrogen volume fraction distribution for hydrogen-doped methane pipeline model (shutdown status).
Figure 14 shows the contour cloud figures of hydrogen volume fraction distribution along the flow direction at 0.4 m, 0.9 m, and 1.2 m of the second branch pipe. As shown in Fig. 14, the hydrogen-doped methane shows obvious stratification after 300s of shutdown, red areas representing higher hydrogen volume fractions appear at the top of the cross section, blue areas representing lower hydrogen volume fractions appear at the bottom, and in the middle of the cross-section are large areas of more uniformly colored green. The stratification is obvious and relatively large gradient in the cloud figure.
Fig. 14.

Cloud figure of hydrogen volume fraction distribution in the second branch pipe (shutdown status).
By taking equally spaced points along the radial direction of the three horizontal branches at x = 0.9 m and reading their hydrogen volume fraction data for graphing, the hydrogen volume fraction variation curves along the radial direction of each horizontal branch under the shutdown status were obtained, as shown in Fig. 15. Along the negative direction of gravity, the hydrogen volume fraction in the cross section at x = 0.9 m of the three branch pipelines shows a rapid increase from about 1.20–15% and then stabilized, and then increased abruptly to 51.46%. The gradient value of hydrogen volume fraction in the pipeline reaches more than 50% after the pipeline shutdown for 300s.
Fig. 15.
Hydrogen volume fraction change curve for horizontal branch radial direction.
Compared with the flow status of the pipeline, also due to the fact that the density of hydrogen is much smaller than that of methane, under the gravity, the less dense hydrogen will drift upward along the direction of gravity, presenting a stratification phenomenon in which the hydrogen concentration in the pipeline rises in the region near the upper wall and decreases in the region near the lower wall. The difference is that, since the pipeline in the shutdown status, at this time under the action of gravity the upward drift phenomenon of hydrogen and the downward deposition phenomenon of methane are in the dominant position. As the shutdown time progresses, a clear stratification phenomenon occurs in the hydrogen-doped methane pipe. Inside the pipeline near the upper wall area, there is a clear phenomenon of hydrogen aggregation, and hydrogen continues to accumulate. Near the lower wall, hydrogen moves upward, methane accumulates, and hydrogen concentration decreases.
Therefore, it can be concluded that hydrogen-doped methane in the horizontal pipeline of gas pipeline in the status of shutdown will show obvious non-uniform distribution of hydrogen and obvious stratification in the pipeline.
Analysis of the effect of hydrogen-doping ratio on hydrogen concentration distribution law in the shutdown status of pipelines
In order to study the hydrogen concentration distribution law in the hydrogen-doped methane pipeline and further investigate the effect of hydrogen-doping ratio on the hydrogen concentration distribution in the hydrogen-doped methane pipeline, numerical simulation of hydrogen distribution in the hydrogen-doped methane pipeline with different hydrogen-doping ratios in the pipeline shutdown status is carried out in this section. The fixed shutdown time is 600s, the pressure is 5 kPa, the boundary condition is full-wall, and the hydrogen-doping ratios are changed to 10%, 15%, 20%, and 25% sequentially. Table 9 shows the maximum and minimum values of hydrogen volume fractions and gradient values of hydrogen volume fractions in hydrogen-doped methane pipelines with different hydrogen-doping ratios under the pipeline shutdown status.
Table 9.
Simulation results at different hydrogen-doping ratios (shutdown status).
| Hydrogen-doping ratios | Hydrogen volume fraction (%) | |||||
|---|---|---|---|---|---|---|
| S1.1 | S2.1 | S3.1 | Minimum value | Maximum value | Gradient value | |
| 10% | 72.44481 | 77.33951 | 74.68802 | 0.03379 | 80.89529 | 80.86150 |
| 15% | 81.08907 | 84.84687 | 82.71891 | 0.07185 | 88.26281 | 88.19096 |
| 20% | 85.17834 | 87.85433 | 86.36208 | 0.07704 | 90.97193 | 90.89489 |
| 25% | 87.16202 | 89.35244 | 88.06142 | 0.10326 | 92.13586 | 92.03260 |
As can be seen from Table 9, the minimum hydrogen volume fraction in the hydrogen-doped methane pipeline increases slightly and the maximum hydrogen volume fraction increases gradually as the hydrogen-doping ratio increases from 10 to 25%, and the gradient of the hydrogen volume fraction in the hydrogen-blended gas pipeline in the gravity direction increases from 80.86150 to 92.03260%. The hydrogen volume fraction at each monitoring point also increased with the hydrogen-doping ratio.
Figure 16 shows the distribution curves of hydrogen volume fraction in the flow direction of the branch pipe 1 mm from the upper wall and the radial direction of the end of the branch pipe after the shutdown of 600 s with different hydrogen-doping ratios. From Fig. 16a, it can be seen that on the basis of other working conditions remain unchanged, the hydrogen in the region of the branch pipe near the upper wall surface increases rapidly from the initial value of the respective hydrogen-doping ratio to 70% and then rises slowly. And with the increase of hydrogen-doping ratio, the hydrogen volume fraction is higher. From Fig. 16(b), the hydrogen volume fraction at the end of the branch pipe shows a trend of firstly increasing, then stabilizing and then rapidly increasing along the radial direction under the condition of other working conditions being unchanged. Obvious stratification occurs in the branch pipe. And the larger the hydrogen-doping ratio is, the more obvious the stratification phenomenon is.
Fig. 16.

Hydrogen volume fraction curves in branch flow direction and radial direction for different hydrogen-doping ratio.
Figure 17 shows the variation curve of hydrogen volume fraction with shutdown time at monitoring point S2.1. From Fig. 17, it can be seen that on the basis of other working conditions, the higher the hydrogen-doping ratio, the higher the hydrogen volume fraction at the end of the branch pipe, and the more obvious the hydrogen aggregation phenomenon. However, the change rate of hydrogen volume fraction at the end of the branch pipe with shutdown time for different hydrogen-doping ratios is relatively small.
Fig. 17.
Hydrogen volume fraction curve of S2.1.
Figure 18 shows the cloud figure of hydrogen distribution at the end section of the branch pipe with different hydrogen-doping ratios after 600s shutdown. As can be seen from Fig. 18, after 600s shutdown, hydrogen aggregates in the region near the upper wall of the pipeline. In the middle of the pipeline, hydrogen and natural gas are in a relatively uniform mixing state. Near the lower wall area, there is a decrease of hydrogen volume fraction. Different hydrogen-doped methane pipelines with different hydrogen-doping ratios show the phenomenon of stratification, and the local hydrogen volume fraction reaches more than 95%.
Fig. 18.

Cloud figure of hydrogen volume fraction distribution for different hydrogen-doping ratios (shutdown status).
In the shutdown status of the pipeline, hydrogen drifts upward also due to gravity. The higher the hydrogen content in the pipeline, the larger the proportion of hydrogen drifting upward along the direction of gravity, and the hydrogen aggregation continues to accumulate. And because the pipeline is in a more stable shutdown status, the aggregation phenomenon near the upper wall of the pipeline is relatively more obvious, and the gradient of the hydrogen volume fraction rises accordingly. From the above simulation results and analysis, it can be concluded that in the shutdown status of the pipeline, the higher the hydrogen doping ratio, the more obvious the stratification phenomenon in the pipeline.
Analysis of the effect of shutdown time on hydrogen concentration distribution law in the shutdown status of pipelines
In order to study the hydrogen concentration distribution law in the hydrogen-doped methane pipeline and further investigate the effect of the shutdown time on the hydrogen concentration distribution, this section is divided into two parts: short shutdown time and long shutdown time.
Shutdown time of 15 min.
The hydrogen-doping ratio was fixed at 15%, the pressure was 5 kPa, and the pipeline shutdown times were changed sequentially to 150s, 300s, 450s, 600s, 750s, and 900s for numerical simulation of hydrogen distribution in the branch of hydrogen-doped methane pipeline under the pipeline shutdown status with different shutdown times. Table 10 shows the maximum and minimum values of hydrogen volume fraction and gradient values of hydrogen volume fraction in the hydrogen-doped methane pipeline for different shutdown times under short pipeline shutdown status.
Table 10.
Simulation results at different shutdown time (15 min).
| Time(s) | Hydrogen volume fraction (%) | |||||
|---|---|---|---|---|---|---|
| S1.1 | S2.1 | S3.1 | Minimum value | Maximum value | Gradient value | |
| 0 | 15.33246 | 15.39689 | 15.33706 | 14.51901 | 15.42590 | 0.90689 |
| 150 | 32.00617 | 33.68160 | 32.02705 | 4.34499 | 34.42110 | 30.07611 |
| 300 | 49.93739 | 51.81378 | 49.42603 | 1.04532 | 53.51762 | 52.47230 |
| 450 | 68.20180 | 71.44794 | 68.98804 | 0.23963 | 74.32046 | 74.08083 |
| 600 | 81.08907 | 84.84687 | 82.71891 | 0.07185 | 88.26281 | 88.19096 |
| 750 | 90.24841 | 93.61774 | 92.65952 | 0.01792 | 97.33655 | 97.31863 |
| 900 | 96.44072 | 96.96952 | 90.22393 | 0 | 100 | 100 |
As shown in Table 10, the minimum hydrogen volume fraction in the hydrogen-doped methane pipeline gradually decreases to 0 and the maximum hydrogen volume fraction gradually increases to 100% as the shutdown time moves to 900 s. The gradient of hydrogen volume fraction in the hydrogen-doped methane pipeline in the gravity direction increases from 30.07611 to 100%. The hydrogen volume fraction at each monitoring point also increased with the shutdown time.
Figure 19a, b and c show the hydrogen volume fraction at each monitoring point of the three branch pipes with the shutdown time, respectively. As can be seen from the curve graphs, the hydrogen volume fraction at each monitoring point near the wall in each horizontal branch pipe increases with the shutdown time on the basis of other working conditions remaining unchanged. The volume fraction at the monitoring point at the central axis of the branch basically stabilizes at the set hydrogen-doping ratio of 15%. The hydrogen volume fraction at the monitoring point at the lower wall of the branch decreases with shutdown time. Figure 19d shows the variation curve of the maximum hydrogen volume fraction with time. The maximum hydrogen volume fraction shows a general trend of increasing with the shutdown time, and the growth rate decreases with time until the maximum hydrogen volume fraction stabilizes.
Fig. 19.

Hydrogen volume fraction curves for different shutdown time (15 min).
Figure 20 shows the cloud figure of hydrogen volume fraction distribution with time in the radial section at the end of the second branch pipe. In the cloud figure, as the shutdown time progresses, the hydrogen inside the pipe drifts upward along the direction of gravity, and more and more obvious hydrogen aggregation gradually occurs in the region close to the upper wall surface of the pipe.
Fig. 20.

Cloud figure of hydrogen volume fraction distribution for different shutdown time (15 min).
Figure 21 shows the contour cloud figures of hydrogen volume fraction at the end of the branch pipe after 300s, 600s and 900s of pipe resting, respectively. As can be seen from Fig. 21, the range of low concentration of hydrogen in the lower half of the pipeline is gradually extended, and the hydrogen volume fraction in the upper half of the pipeline is gradually increased. Obvious stratification phenomenon appears. The thickness of the gas with hydrogen volume fraction above 40% near the upper wall surface gradually increases from 0.3 mm to 0.7 mm, and locally it can reach more than 95%.
Fig. 21.

Cloud figure of hydrogen volume fraction distribution in the second branch pipe (15 min).
Hydrogen has a low density, and in a mixed fluid, hydrogen will continuously drift upward under the effect of gravity. In a hydrogen-doped methane pipeline in a short time shutdown status, the intermolecular motion in the pipeline is much weaker than in the flow status, mainly hydrogen drifting upward and methane settling downward. Therefore, with the time progress, the hydrogen continuously drifts upward and accumulates on the upper wall of the pipeline, and obvious stratification phenomenon occurs in the horizontal branches. And the longer the shutdown time, the more obvious the stratification phenomenon in the horizontal branch pipe.
-
(2)
Shutdown time of 10 h.
The hydrogen concentration distribution inside the hydrogen-doped methane pipeline with a 10-hour shutdown is explored with Case 19. Table 11 shows the maximum and minimum values of hydrogen volume fraction and the gradient values of hydrogen volume fraction in the hydrogen-doped methane pipeline with different shutdown time for the pipeline in the long shutdown status.
Table 11.
Simulation results at different shutdown time (10 h).
| Time(h) | Hydrogen volume fraction (%) | ||||||
|---|---|---|---|---|---|---|---|
| S1.1 | S2.1 | S3.1 | S4 | Min value | Max value | Gradient value | |
| 0 | 15.33246 | 15.39689 | 15.33706 | 14.99992 | 14.51901 | 15.42590 | 0.90689 |
| 2 | 46.63521 | 57.75838 | 49.21426 | 26.94329 | 0 | 81.85851 | 81.85851 |
| 4 | 45.82100 | 57.45369 | 49.38400 | 30.00226 | 0 | 83.09588 | 83.09588 |
| 6 | 44.85306 | 57.15122 | 49.42030 | 31.33072 | 0 | 83.99305 | 83.99305 |
| 8 | 44.10211 | 56.87966 | 49.51479 | 32.67772 | 0 | 84.19154 | 84.19154 |
| 10 | 43.21634 | 56.59164 | 49.67474 | 33.27146 | 0 | 84.02245 | 84.02245 |
As shown in Table 11, the highest hydrogen volume fraction in the hydrogen-doped methane pipeline gradually increased to 84.02245% as the shutdown time moved to 10 h. The gradient of hydrogen volume fraction in the hydrogen-doped methane pipeline in the direction of gravity increased from 0.90689 to 84.02245%. Meanwhile the hydrogen volume fraction at each monitoring point increases with the shutdown time.
Figure 22 shows the variation curve of hydrogen volume fraction with shutdown time at each monitoring point. On the basis of other working conditions, the hydrogen volume fraction at each monitoring point on the branch pipe shows a trend of rapid increase to reach the peak and then decrease to a stable state with the shutdown time. The monitoring points at the main pipe showed a slow increase. The hydrogen volume fraction at the monitoring points at the branch pipe basically stabilized at about 50%, and the hydrogen volume fraction at the monitoring points on the top of the main pipe slowly increased to 33% with the shutdown time.
Fig. 22.
Hydrogen volume fraction curve for different shutdown time (10 h).
Figure 23 shows the variation curve of hydrogen volume fraction with the height of the main pipe from 9 m to the top center axis of the main pipe. From the curve graph, it can be concluded that on the basis of other working conditions remaining unchanged, with the increase in height, there is a significant hydrogen aggregation at the top of the main pipe. The hydrogen volume fraction near the top of the main pipe of about 465.5 mm is more than 20%, and the hydrogen volume fraction of about 16.5 mm is more than 30%.
Fig. 23.
Hydrogen volume fraction curve at the top of the main pipeline (10 h).
Figure 24 shows the cloud figure of hydrogen volume fraction with time from 9 m to 9.7355 m of the hydrogen-doped methane pipeline. It can be clearly seen with the figure that with the increase of the shutdown time, the hydrogen gradually drifts upward in the main pipe. An increasingly obvious stratification is formed near the top of the main pipe.
Fig. 24.

Cloud figure of hydrogen volume fraction distribution at the top of the main pipeline.
Hydrogen in the main pipeline likewise drifts upward along the pipeline under the influence of gravity. The drift distance is longer, and the time required for significant stratification to occur is longer than the time required for significant stratification to occur in the branch pipe. In the completely shutdown status, the stratification phenomenon in the pipeline will appear in the upper wall of the branch pipe and the top of the main pipe, and with the progress of the shutdown time, the hydrogen accumulation phenomenon continues to accrue, and the stratification phenomenon becomes more and more obvious.
From the above analysis, it can be concluded that when a hydrogen-doped methane pipeline is in shutdown status for a long period of time, an increasing hydrogen volume fraction will appear at the top of the main pipeline, which will have a negative impact on the safety of the hydrogen-doped gas pipeline, mainly including:
As time increases, the hydrogen volume fraction near the top of the main will increase, which will pose a serious safety concern for the gas piping. When hydrogen accumulates locally in the pipeline, the infiltration of hydrogen into the pipeline will bring hydrogen embrittlement, hydrogen cracking and other risks of pipe failure to the gas pipeline. Once the pipe is damaged, it may cause serious consequences such as fire and explosion. At the same time, because the gas pipeline in this study is a gas pipeline for residential buildings in towns, the population density of residential buildings is large and the environment is complex. Once the pipe failure, it brings great threat to the safety of life and property.
Due to the non-uniform distribution of hydrogen within the main pipe, high-rise residents may use high concentrations of hydrogen-doped natural gas for a short period of time when it is restarted after a long shutdown period, which poses a significant challenge to the residents’ stoves and other appliances that use hydrogen-doped natural gas. Once the acceptable hydrogen concentration range for stoves or other appliances using hydrogen-doped natural gas is exceeded, there is a potential for a safety incident.
At the end of town gas pipelines entering households, pipelines are mostly made of PE pipes and sealing materials, and in PE pipes and sealing materials, the hydrogen permeability coefficient is 4 to 5 times larger than that of methane. Once the high concentration of hydrogen comes into contact with these materials, leakage accidents are very likely to occur.
Analysis of the effect of gas usage cases on hydrogen concentration distribution law in the shutdown status of pipeline
In order to study the hydrogen concentration distribution law in the hydrogen-doped methane pipeline, and further study the influence of different gas usage cases on the hydrogen concentration distribution, this section carries out the numerical simulation of the hydrogen distribution in the hydrogen-doped methane pipeline under different gas usage cases in the shutdown status. The hydrogen-doping ratio is fixed at 15%, the pressure is 5 kPa, the shutdown time is 300 s, and the operation of each branch pipe is changed sequentially. Table 12 shows the maximum and minimum values of hydrogen volume fraction and gradient values of hydrogen volume fraction in the hydrogen-doped methane pipeline for different gas usage cases.
Table 12.
Simulation results at different gas usage cases.
| Shutdown pipeline | Hydrogen volume fraction (%) | |||||
|---|---|---|---|---|---|---|
| S1.1 | S2.1 | S3.1 | Min value | Max value | Gradient value | |
| First branch shutdown | 49.59601 | 15.39710 | 15.33686 | 1.28811 | 51.38816 | 50.10005 |
| Second branch shutdown | 15.33501 | 51.81573 | 15.33687 | 1.04535 | 53.79253 | 52.74718 |
| Third branch shutdown | 15.33504 | 15.40003 | 49.79341 | 1.18312 | 51.55011 | 50.36699 |
| First and second branch shutdown | 49.60064 | 51.81584 | 15.33708 | 1.04541 | 53.51803 | 52.47262 |
| First and third branch shutdown | 49.60052 | 15.40007 | 49.26865 | 1.18417 | 52.07106 | 50.88689 |
| Second and third branch shutdown | 15.33796 | 51.81578 | 49.79519 | 1.04533 | 53.78534 | 52.74001 |
As shown in Table 12, the hydrogen volume fraction gradient in the shutdown branch is large, up to more than 50%, when part of the branch is shutdown. Significant stratification occurs in the shutdown branch pipe. There is a slight increase in the hydrogen volume fraction at the monitoring point near the upper wall of the flow branch, and a slight uneven distribution of hydrogen. The effect of the number of shutdown branches on the hydrogen volume fraction is small.
Fgures 25, 26 and 27 show the cloud figure of hydrogen gas volume fraction distribution in the hydrogen-doped methane pipeline model when one branch pipe is in shutdown status and the rest of the branch pipes are in flow status. Due to the large gradient of the hydrogen volume fraction, the zoomed-in three horizontal branches were turned around the X-axis by 90° to show a top-down view for convenient observation. As can be seen from the figure, when a branch pipe is shutdown, the branch pipe in the shutdown status in the distance from the main pipe and branch pipe intersection of about 0.06 m, near the upper wall area of the hydrogen aggregation phenomenon, the local hydrogen volume fraction increased significantly, the pipeline appeared in the stratification phenomenon. The branch pipe in flow status did not show obvious stratification on the cloud figures.
Fig. 25.

Cloud figure of hydrogen volume fraction distribution for hydrogen-doped methane pipeline model (first branch shutdown).
Fig. 26.

Cloud figure of hydrogen volume fraction distribution for hydrogen-doped methane pipeline model (second branch shutdown).
Fig. 27.

Cloud figure of hydrogen volume fraction distribution for hydrogen-doped methane pipeline model (third branch shutdown).
Figures 28, 29 and 30 show the cloud figures of hydrogen volume fraction distribution of the hydrogen-doped methane pipeline model when one branch pipe is in flow status and the rest of the branch pipes are in shutdown. Due to the large gradient of the hydrogen volume fraction, the zoomed-in three horizontal branches were turned around the X-axis by 90° to show a top-down view for convenient observation. As can be seen from the figures, when two branch pipes are shutdown, the branch pipe in flow status does not see obvious stratification on the cloud figure. The branch pipe in the shutdown status is about 0.06 m away from the intersection of the main pipe and the branch pipe, near the upper wall area, there is obvious hydrogen aggregation phenomenon, and the local hydrogen volume fraction is obviously increased. Obvious stratification was observed in the pipe of the shutdown branch.
Fig. 28.

Cloud figure of hydrogen volume fraction distribution for hydrogen-doped methane pipeline model (first and second branch shutdown).
Fig. 29.

Cloud figure of hydrogen volume fraction distribution for hydrogen-doped methane pipeline model (first and third branch shutdown).
Fig. 30.

Cloud figure of hydrogen volume fraction distribution for hydrogen-doped methane pipeline model (second and third branch shutdown).
Figure 30 Cloud figure of hydrogen volume fraction distribution for hydrogen-doped methane pipeline model (second and third branch shutdown).
The error data in Fig. 31 are derived from the error ranges obtained in the numerical simulation validation. Figure 31a shows the distribution curve of hydrogen volume fraction along the flow direction at 1 mm from the upper wall of the shutdown branch pipe when one branch pipe is shutdown. Figure 31b shows the hydrogen volume fraction distribution curve along the flow direction at 1 mm from the upper wall of the running stub when two branch pipes are shutdown. As can be seen from Fig. 31a, the hydrogen volume fraction in the region near the upper wall of the shutdown branch pipe shows a trend of rapid increase from the initial hydrogen-doping ratio and then stabilizes along the flow direction, while other working conditions remain unchanged. From Fig. 31b, it can be seen that the hydrogen volume fraction in the region near the upper wall of the operating branch pipe increases steadily along the flow direction, while other working conditions remain unchanged.
Fig. 31.

Hydrogen volume fraction curves along the flow direction in the branch pipe for different gas usage.
When some of the branches of the hydrogen-doped methane pipeline are in the shutdown status, although the main pipeline and the operating branches are in the flow status with high turbulence intensity, the branch in the shutdown status is less affected by the turbulence effect. Hydrogen drifts upward under the effect of gravity and accumulates on the upper wall of the shutdown branch pipeline, showing the phenomenon of stratification. And the change of the number and height of the shutdown branch pipe has less influence on the stratification phenomenon. Therefore, it can be concluded that significant stratification occurs in the shutdown branch for all different gas usage cases, and upward drift of hydrogen along the direction of gravity occurs in the operating branch.
Sensitivity analysis of pipeline in shutdown status
The ratio of the change in the gradient value of the hydrogen volume fraction within a hydrogen-doped methane pipeline to the change in the corresponding parameter value is used as the sensitivity coefficient. By comparing the sensitivity coefficients of different parameters, the degree of influence of a specific pipeline parameter on the phenomenon of non-uniform distribution of hydrogen in the pipeline was derived. Hydrogen doping ratio of 15%, pressure of 5 kPa, and shutdown time of 600s were selected as the base parameters. The sensitivity analysis was carried out by taking ± 75% of the base parameter value as the analysis interval, and the sensitivity analysis figure of the influence of each pipeline parameter on the gradient value of hydrogen volume fraction in the pipeline was obtained, as shown in Fig. 32. The sensitivity ratio for the gas usage was not calculated because the magnitude of the change in the different gas usage scenarios is not easy to quantify. However, the data from the simulation results show that the effect of the change in gas usage on the hydrogen volume fraction gradient value is within 3%. The effect of gas usage is minimal compared to the hydrogen doping ratio and shutdown time.
Fig. 32.
Sensitivity analysis curves of pipeline parameters (shutdown status).
After sensitivity analysis, it was found that the degree of influence of different parameters on the gradient value of hydrogen volume fraction in the hydrogen-doped methane pipeline under the shutdown status varied greatly. Among them, the effect of shutdown time was the largest with the highest sensitivity. The effect of hydrogen doping ratio is the second highest. Therefore, it can be concluded that in the pipeline shutdown status, the effect of the shutdown time on the phenomenon of stratification in the pipeline is relatively the largest, followed by the hydrogen doping ratio, and the effect of the gas usage situation is the smallest.
Conclusions
In order to further study the hydrogen-doped methane pipeline hydrogen concentration distribution law and the influence of hydrogen-doped methane in the gas pipeline, based on the hydrogen-doped methane pipeline model established in this paper, numerical simulation of the pipeline flow status and pipeline shutdown status. The effects of different hydrogen-doping ratios, operating flow velocities, operating pressures, shutdown time, and gas usage on the hydrogen concentration distribution law in the hydrogen-doped methane pipeline are analyzed.
The results show that:
In the hydrogen-doped methane pipeline flow status, the hydrogen-doping ratio increases from 10 to 25%, and the gradient of hydrogen volume fraction in the gravity direction in the hydrogen-doped methane pipeline increases from 0.66758 to 1.21841%, which is positively correlated. The gradient of hydrogen volume fraction in the gravity direction in the hydrogen-doped methane pipeline decreases from 1.38865 to 0.50158% with a negative correlation when the flow velocity is increased from 1.695 m/s to 3.390 m/s. The pressure is increased from 3 kPa to 5 kPa with a negative correlation when the flow velocity is increased from 10 to 25%. The increase of pressure from 3 kPa to 5 kPa has little effect on the distribution of hydrogen volume fraction in the hydrogen-doped methane pipeline, which is negligible.
Under the hydrogen-doped methane pipeline flow status, the change of hydrogen-doping ratio, flow velocity, and pressure on the volume fraction of hydrogen is within 0.9%, and the influence effect is negligible.
In the hydrogen-doped methane pipeline under the shutdown status, obvious stratification phenomenon appears in the pipeline. The hydrogen-doping ratio increased from 10 to 25%, and the gradient of hydrogen volume fraction in the gravity direction in the hydrogen-doped methane pipeline increased from 80.86150 to 92.03260%, with basically the same rate of change with time. There is a clear stratification phenomenon. The shutdown time was extended to 10 h, and obvious stratification phenomenon appeared in the main pipeline, and the volume fraction of hydrogen near the top of the main pipeline about 16.5 mm was above 30%. In different gas usage cases, obvious stratification occurred in the shutdown branch pipe, and hydrogen drifted upward along the direction of gravity in all the operating branch pipes.
The shutdown status of the hydrogen-doped methane pipeline, the shutdown time has the greatest effect on the stratification phenomenon in the pipeline, followed by the hydrogen-doping ratio, and the gas usage has the smallest effect.
Based on the simulation results and conclusions, this study concludes that there is indeed a risk of stratification in the mixing and transportation of hydrogen and natural gas in gas pipelines, which mainly stems from the significant density difference between the two. This stratification phenomenon may not only lead to localized enrichment of hydrogen concentration in the pipeline, but also increase the risk of hydrogen damage, which poses a serious challenge to the safe operation of hydrogen-doped natural gas pipelines. In order to cope with this challenge, the following points are proposed in this paper:
Pipe preferably hydrogen embrittlement-resistant materials, selecting materials with lower sensitivity to hydrogen, such as hydrogen embrittlement-resistant alloy steel, in order to minimize the risk of hydrogen damage, especially in the position of valves and welding points close to the upper wall surface of the pipeline and the top of pipeline position, which need to be more attentive to hydrogen embrittlement-resistant safety protection.
Optimize the pipeline structure at the pipeline design stage. Considering the physical properties of hydrogen and natural gas, optimize the pipeline structure, such as adding mixing devices or changing the shape of the pipeline, in order to promote the uniform mixing of hydrogen and natural gas. Meanwhile, multiple hydrogen concentration monitoring points are set up along the pipeline to monitor the distribution of hydrogen in the pipeline in real time to ensure timely detection of stratification phenomenon and hydrogen-doped natural gas leakage.
Use gas appliances with higher hydrogen resistance. Also, within tolerance, increase the flow rate. The increase in flow velocity will reduce the upward drift of hydrogen in the direction of gravity.
Acknowledgements
This research was funded by the Postdoctoral Foundation of PetroChina Southwest Oil & Gasfield Company (grant number 20230312-10).
Author contributions
J.B. wrote and edited the main manuscript. L.Z. reviewed and edited the manuscript. R.S. and W.Y. provided project administration and supervision. M.H. and G.L. provided methodology and formal analysis. X.W. prepared resources and project administration. All authors reviewed the manuscript.
Data availability
Date is provided within the manuscript.
Competing interests
The authors declare no competing interests.
Footnotes
Publisher’s note
Springer Nature remains neutral with regard to jurisdictional claims in published maps and institutional affiliations.
References
- 1.Li, F., Dong, S. H., Chen, L., Zhu, X. P. & Han, Z. C. Key safety technologies and advances in long-distance pipeline transportation of hydrogen blended natural gas. Mech. Eng.45(2), 230–244 (2023). [Google Scholar]
- 2.Li, J. F. et al. Research progress and development trends of key technologies for hydrogen energy storage and transportation. Oil Gas Storage Transp.42(8), 856–871 (2023). [Google Scholar]
- 3.Meng, X. Y. et al. China’s hydrogen development strategy in the context of double carbon targets. Nat. Gas Ind. B9(6), 521–547 (2022). 10.1016/j.ngib.2022.11.004 [DOI] [Google Scholar]
- 4.Acar, C. & Dincer, I. The potential role of hydrogen as a sustainable transportation fuel to combat global warming. Int. J. Hydrog. Energy45(5), 3396–3406 (2020). 10.1016/j.ijhydene.2018.10.149 [DOI] [Google Scholar]
- 5.Kouchachvili, L. & Entchev, E. Power to gas and H 2 /NG blend in SMART energy networks concept. Renew. Energy125, 456–464 (2018). 10.1016/j.renene.2018.02.088 [DOI] [Google Scholar]
- 6.Öney, F., Veziro, T. N. & Dülger, Z. Evaluation of pipeline transportation of hydrogen and natural gas mixtures. Int. J. Hydrog. Energy19(10), 813–822 (1994). 10.1016/0360-3199(94)90198-8 [DOI] [Google Scholar]
- 7.Zhang, C. Y. et al. Key technologies of pure hydrogen and hydrogen-mixed natural gas pipeline transportation. ACS Omega8(22), 19212–19222 (2023). 10.1021/acsomega.3c01131 [DOI] [PMC free article] [PubMed] [Google Scholar]
- 8.Li, J. F., Su, Y., Zhang, H. & Yu, B. Research progresses on pipeline transportation of hydrogen-blended natural gas. Nat. Gas. Ind.41(4), 137–152 (2021). [Google Scholar]
- 9.Qiao, J., Guo, B. L., Ma, X. Q., Hou, J. C. & Yan, S. Discussion on key technologies of hydrogen blending transportation in urban gas pipeline network. Gas Heat43(3), 19–22 (2023). [Google Scholar]
- 10.Tan, Y. et al. Scheme and economic analysis of hydrogen-blended natural gas separation. Chem. Eng. Oil Gas52(4), 41–47 (2023). [Google Scholar]
- 11.Luo, Z., Xu, H. & Yuan, M. Safety and emission performance test and evaluation of natural gas mixed with hydrogen combustion on domestic gas appliances. Chem. Eng. Oil Gas48(2), 50–56 (2019). [Google Scholar]
- 12.Mou, L. et al. Adaptability analysis of operating conditions of hydrogen-blended compressors in the first west-east gas pipeline. Chem. Eng. Oil Gas52(2), 133–141 (2023). [Google Scholar]
- 13.Lowesmith, B. J., Hankinson, G., Spataru, C. & Stobbart, M. Gas build-up in a domestic property following releases of methane/hydrogen mixtures. Int. J. Hydrog. Energy34(14), 5932–59392 (2009). 10.1016/j.ijhydene.2009.01.060 [DOI] [Google Scholar]
- 14.Chen, J. W. et al. Discussion on the safety in design of hydrogen blended natural gas pipelines. Nat. Gas Oil. 38 (6), 8–13 (2020). [Google Scholar]
- 15.Singh, V., Raj, A., Mahajan, D. K. Investigation into hydrogen assisted fracture in nickel Oligocrystals. Mater. Sci. Eng. 895:146257 (2024).
- 16.Zhang, H. W. et al. Research progress on corrosion and hydrogen embrittlement in hydrogen–natural gas pipeline transportation. Nat. Gas Ind. B10(6), 570–582 (2023). 10.1016/j.ngib.2023.11.001 [DOI] [Google Scholar]
- 17.Tian, X. & Pei, J. J. Study progress on the pipeline transportation safety of hydrogen-blended natural gas. Heliyon9(11), 21454 (2023). 10.1016/j.heliyon.2023.e21454 [DOI] [PMC free article] [PubMed] [Google Scholar]
- 18.Liu, X. B. et al. Advances and challenges of hydrogen-blended natural gas pipeline integrity assessment technology. Mech. Eng.45(2), 245–259 (2023). [Google Scholar]
- 19.Birkitt, K., Loo-Morrey, M., Sanchez, C. & O’Sullivan, L. Materials aspects associated with the addition of up to 20 mol% hydrogen into an existing natural gas distribution network. Int. J. Hydrog. Energy46(23), 12290–12299 (2021). 10.1016/j.ijhydene.2020.09.061 [DOI] [Google Scholar]
- 20.Tabkhi, F., Azzaro-Pantel, C., Pibouleau, L. & Domenech, S. A Mathematical framework for modelling and evaluating natural gas pipeline networks under hydrogen injection. Int. J. Hydrog. Energy33(21), 6222–6231 (2008). 10.1016/j.ijhydene.2008.07.103 [DOI] [Google Scholar]
- 21.Ren, F., Chu, H. Q., Xiang, L. K., Han, W. W. & Gu, M. Y. Effect of hydrogen addition on the laminar premixed combustion characteristics the main components of natural gas. J. Energy Inst.92(4), 1178–1190 (2019). 10.1016/j.joei.2018.05.011 [DOI] [Google Scholar]
- 22.Uilhoorn, & Frits, E. A comparison between psrk and gerg-2004 equation of state for simulation of non-isothermal compressible natural gases mixed with hydrogen in Pipelines/porównanie równań Stanu Opracowanych Wedug Metody psrk oraz gerg-2004 Wykorzystanych do Symulacji za. Arch. Min. Sci.58(2), 579–590 (2013). [Google Scholar]
- 23.Hafsi, Z., Elaoud, S. & Mishra, M. A computational modelling of natural gas flow in looped network: Effect of upstream hydrogen injection on the structural integrity of gas pipelines. J. Nat. Gas Sci. Eng.64, 107–117 (2019). 10.1016/j.jngse.2019.01.021 [DOI] [Google Scholar]
- 24.Abd, A. A., Naji, S. Z., Thian, T. C. & Othman, M. R. Evaluation of hydrogen concentration effect on the natural gas properties and flow performance. Int. J. Hydrog. Energy46(1), 974–983 (2021). 10.1016/j.ijhydene.2020.09.141 [DOI] [Google Scholar]
- 25.Elaoud, S., Hafsi, Z. & Hadj-Taieb, L. Numerical modelling of hydrogen-natural gas mixtures flows in looped networks. J. Petrol. Sci. Eng.159, 532–541 (2017). 10.1016/j.petrol.2017.09.063 [DOI] [Google Scholar]
- 26.Zhang, L. Y. et al. Research progress of natural gas follow-up hydrogen mixing technology. Mech. Eng.44(4), 755–766 (2022). [Google Scholar]
- 27.Isaac, T. & HyDeploy,. The UK’s first hydrogen blending deployment project. Clean. Energy3(2), 114–125 (2019). 10.1093/ce/zkz006 [DOI] [Google Scholar]
- 28.Ghazanfari, V. et al. Enhancing heat transfer in a heat exchanger: CFD study of twisted tube and nanofluid (Al2O3, Cu, CuO, and TiO2) effects. Case Stud. Therm. Eng.53, 103864 (2024). 10.1016/j.csite.2023.103864 [DOI] [Google Scholar]
- 29.Marangon, A. & Carcassi, M. N. Hydrogen–methane mixtures: Dispersion and stratification studies. Int. J. Hydrog. Energy39(11), 6160–6168 (2014). 10.1016/j.ijhydene.2013.10.159 [DOI] [Google Scholar]
- 30.Wu, C. Feasibility study on blending hydrogen into natural gas distribution networks. Chongqing: Chongqing University (2018).
- 31.Ren, S. Y. Study on mixing and explosion propagation laws of natural gas in confined space. J. Saf. Sci. Technol.12(11), 130–135 (2016). [Google Scholar]
- 32.Ren, S. & Zhang, Q. Influence of concentration distribution of hydrogen in air on measured flammability limits. J. Loss Prev. Process Ind.34, 82–91 (2015). 10.1016/j.jlp.2015.01.027 [DOI] [Google Scholar]
- 33.Liu, C. W. et al. Study on the stratification of the blended gas in the pipeline with hydrogen into natural gas. Int. J. Hydrog. Energy48(13), 5186–5196 (2023). 10.1016/j.ijhydene.2022.11.074 [DOI] [Google Scholar]
- 34.An, Y. W. et al. Hydrogen concentration distribution in flow of hydrogen blended to natural gas in pipeline. Mech. Eng.44(4), 767–775 (2022). [Google Scholar]
- 35.Zhu, H. J., Chen, J. W., Su, H. Z., Tang, T. & He, S. Numerical investigation of the natural gas-hydrogen mixture stratification process in an undulating pipeline. J. Southwest. Petroleum Univ. (Science Technology Edition)44(6), 132–140 (2022). [Google Scholar]
- 36.Yan, W. C. et al. A method for determining the installation location of an on-line gas chromatograph in the mixed transportation pipelines with multiple sources. Nat. Gas. Ind.37(10), 87–92 (2017). [Google Scholar]
- 37.Ghazanfari, V. et al. Numerical study on the thermal performance of the shell and tube heat exchanger using twisted tubes and Al2O3 nanoparticles. Prog. Nucl. Energy155, 104526 (2023). 10.1016/j.pnucene.2022.104526 [DOI] [Google Scholar]
- 38.Ren, S. Y. Gas mixing process and flammability in confined space. Beijing: Beijing Inst. Technology (2016).
Associated Data
This section collects any data citations, data availability statements, or supplementary materials included in this article.
Data Availability Statement
Date is provided within the manuscript.