Abstract
Since assessing aerobic capacity is key to enhancing swimming performance, a simple and widely applicable technology should be developed. Therefore, we aimed to noninvasively visualize real‐time changes in sweat lactate (sLA) levels during swimming and investigate the relationship between lactate thresholds in sweat (sLT) and blood (bLT). This prospective study included 24 university swimmers (age: 20.7 s ± 1.8 years, 58% male) who underwent exercise tests at incremental speeds with or without breaks in a swimming flume to measure heart rate (HR), bLT, and sLT based on sLA levels using a waterproof wearable lactate sensor attached to the dorsal upper arm on two different days. The correlation coefficient and Bland–Altman methods were used to verify the similarities of the sLT with bLT and personal performance. In all tests, dynamic changes in sLA levels were continuously measured and projected onto the wearable device without delay, artifacts, or contamination. Following an initial minimal current response, with increasing speed the sLA levels increased substantially, coinciding with a continuous rise in HR. The speed at sLT strongly correlated with that at bLT (p < 0.01 and r = 0.824). The Bland–Altman plot showed a strong agreement (mean difference: 0.08 ± 0.1 m/s). This prospective study achieved real‐time sLA monitoring during swimming, even with vigorous movement. The sLT closely approximated bLT; both were subsequently validated for their relevance to performance.
Keywords: aerobic fitness, assessment, endurance, metabolism, technology
Highlights
A new technique using a wearable device can measure sweat lactate (sLA) levels during swimming without artifacts or contamination.
Lactate threshold assessed using sLA dynamics is consistent with that calculated from blood samples.
The current novel measurement method is expected to promote a personalized training regimen and simultaneous multi‐person measurements.
1. INTRODUCTION
In swimming, as in other sports, assessing aerobic capacity is important. Aerobic capacity has been associated with performance (Hering & Stepan, 2021; Puccinelli et al., 2020) and is often used as a benchmark for training intensity (Baldassarre et al., 2017; Skorski et al., 2012). Among several definitions and indexes, the maximal lactate steady state (MLSS) has been widely used as the gold standard tool for measuring aerobic capacity in swimming (Pelarigo et al., 2017). In contrast, MLSS has a major limitation in that it requires frequent 30‐min constant load tests (Beneke, 2003; Pelarigo et al., 2017, 2018), making regular assessments of MLSS difficult. Therefore, evaluating aerobic capacity during swimming simply and feasibly is preferable. Previously, studies have reported different methods assessing the anaerobic threshold (AT), such as measuring the lactate threshold (LT) and ventilatory threshold (VT), during swimming as alternatives to the MLSS for measuring the aerobic capacity (Nikitakis & Toubekis, 2021; Pelarigo et al., 2017, 2018). The most common technique involves measuring the LT using blood lactate. However, collecting the blood sample requires stopping the activity and may not accurately reflect the actual physical function level during swimming. Moreover, the measurement of VT can accurately assess respiratory metabolism (Ribeiro et al., 2015). However, measurement is impractical and can only be conducted by a group of experts because of the size and high cost of the necessary equipment and required expertise needed to conduct these measures. Therefore, there is an urgent need to develop a simple and accurate method for determining AT during swimming using incremental loading exercises in the water.
Methods to visualize the lactate dynamics of sweat during exercise on land in a noninvasive, simple, and real‐time manner have been previously reported (Katsumata et al., 2021; Okawara et al., 2022a, 2022b; Seki et al., 2021). Furthermore, sweat LT (sLT) assessed using sLA dynamics is consistent with LTs calculated from blood samples (bLT) and VT (Seki et al., 2021).
Therefore, this study aimed to examine whether LT estimated from sLA levels obtained from participants during a non‐intermittent incremental swimming exercise could replace the conventional LT measurement using blood lactate (bLA) levels during an intermittent incremental swimming exercise and to evaluate the usability and validity of sLT obtained from participants during a non‐intermittent incremental swimming exercise.
2. MATERIALS AND METHODS
All applicable institutional and governmental regulations concerning the ethical use of human volunteers were followed throughout this study. The study protocol was conducted in compliance with the ethical guidelines for medical and health research involving human participants and was approved by the Ethics Committees of the university's School of Medicine (approval no. 20180357) prior to the investigation. Written informed consent was obtained from all the study participants for participation and publication of the findings. There was no patient or public involvement.
Participants were recruited from the university's swimming teams between May and September 2022; 24 swimmers aged between 19 and 28 years volunteered to participate in this study. The swimmers were beginner‐ to middle‐ or higher‐level swimmers. All swimmers were free from musculoskeletal injury or cardiorespiratory diseases.
The sample size was calculated using the IBM SPSS Statistics 28.0 (IBM). According to the results of a previous study (Seki et al., 2021), the correlation between sLT and bLT in healthy volunteers is approximately 0.7. Based on this value, the minimum required sample size was 20 with a power of 95%. Considering dropouts, the sample size was set at 24 as previously described (Seki et al., 2021).
In this prospective study, two distinct exercise testing protocols were conducted in the same order, each involving incrementally increasing speed in water. These tests were performed on two different days in a swimming flume with an adjustable flow speed (SM‐40, JAPAN AQUA TEC CO., LTD) located at a gym and university in Tokyo. The tests were scheduled to avoid periods of competition or events that would cause exhaustion. To allow for recovery from the first test, the two tests were scheduled to take place at least 48 h apart from each other (resulting in an average interval of 14 days between the two tests). In addition, participants were asked to refrain from intense load fatigue during the 24 h prior to the start of the test. Both tests were conducted at the same time of day when possible to minimize circadian effects. To ensure consistency, the front crawl swimming style was standardized for all participants. The flowchart of the study protocol is shown in Figure 1. First, an incremental exercise test with breaks in test 1 was conducted to determine the blood LT speed (bLT‐speed) by the bLA level, which is currently practiced. Additionally, since sLA can be measured with or without a break, sLA was also monitored in test 1, and the sLA threshold speed (sLT‐speed) was also evaluated. Next, as test 2, an incremental exercise test without breaks was conducted on a separate day to determine the sLT‐speed by sLA measurement. On both test days, a fixed chest strap heart rate (HR) monitor (Polar H10N, Polar Japan) was attached to continuously measure the HR at 1 Hz. A wearable sLA device (Grace Imaging Inc.) was attached to the swimmer's dorsal upper arm to measure sLA levels. For the sLA device, waterproof tape (3MTM TegadermTM Film Roll, 3M Japan Limited) was applied so that the device was completely covered to achieve stability and waterproofing by overlapping three sheets each along the long axis and the circumference of the upper arm. Prior to exercise testing, the swimmers performed preparatory exercises, such as stretching, on land. The swimmers then entered the swimming flume and swam for 60 s at +0.2 m/s of the starting speed of the exercise testing, as a warm‐up exercise, which was repeated. A 60‐s rest was allowed between the two warm‐up exercises. Thereafter, exercise testing was performed up to the speed at which the exercise could be maintained. The stop criteria for the exercise were determined by the swimmers themselves or when the examiner determined that the swimmers could not resist the water flow and would be pushed toward the back of the swimming flume. Previous studies have reported that the LT speed of national‐level top swimmers is approximately 1.2–1.5 m/s (Carvalho et al., 2020; Pelarigo et al., 2018; Ribeiro et al., 2015), and the initial flow speed was adjusted according to the individual swimming ability to reach LT within 3–5 min after the start of exercise (0.6–0.9 m/s). Specifically, the initial flow speed was 0.9 m/s for the top male swimmers, 0.8 m/s for the top female swimmers and middle level male swimmers with competition experience, 0.7 m/s for the middle level female swimmers and beginner level male swimmers, and 0.6 m/s for the beginner level female swimmers. In test 1, the flow speed was increased by 0.1 m/s per minute and a 60‐s rest at 2‐min intervals was incorporated. The bLA levels were then measured at each 60‐s rest using a blood lactate analyzer (Lactate Pro 2; ARKRAY, Inc.), with blood drawn from the fingertips. In test 2, the flow speed was increased by 0.1 m/s per minute as in test 1 without the 60‐s rest interval.
FIGURE 1.
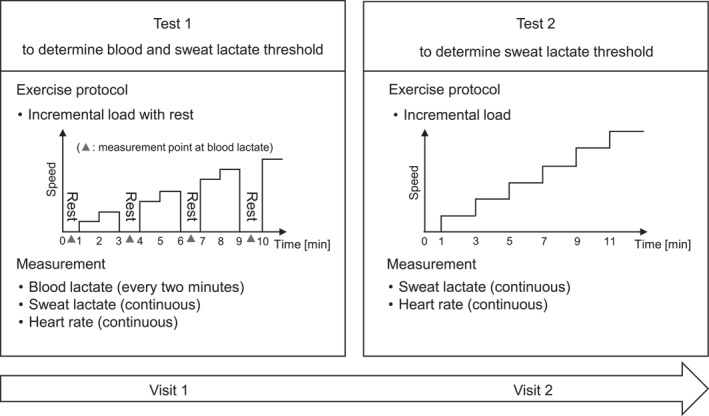
Flowchart of the study protocol.
The bLA level was measured by puncturing the fingertips using a puncture device (NIPRO LS Lancet 28G, NIPRO CORPORATION) and gently squeezing the puncture site to obtain a capillary blood sample during each rest period in test 1. The volume of blood required for a single blood lactate measurement was 0.3 μL. After the blood droplet was estimated to have the required volume, the tip of the sensor of the blood lactate analyzer was placed on the droplet and the measurement was performed. The bLT was determined according to a graph‐based method previously described (Faude et al., 2009). The individual data points corresponding to bLA levels measured every 2 min were connected with a line and visually inspected by two experienced researchers, who independently determined the point at which the levels rose from the baseline. In case of disagreement between the two researchers, a third researcher was consulted to resolve the difference by independently determining the bLT. The three researchers then jointly agreed on the bLT. The speed at which the bLT was reached was recorded as the bLT‐speed. In cases where the bLT point corresponded with the 60‐s rest period, the speed immediately preceding the rest period was recorded as the bLT‐speed.
The sLA level was measured using a wearable device consisting of a disposable sensor chip and a sensor, which quantified the lactate concentration as an electric current value (Seki et al., 2021). The sensor chip generates the current value proportional to the lactate concentration by catalyzing the enzymatic immobilization on its surface to oxidize lactate, which reduces hydrogen peroxide. A previous in vitro study has shown that the sLA sensor responds linearly to increasing lactate concentrations, particularly in the range of 0–5 mmol/L, which is optimal for determining the LT (Seki et al., 2021). Data were recorded continuously at a sampling frequency of 1 Hz for mobile applications using a Bluetooth connection. The application used in this study was originally designed and programmed by Grace imaging Inc. (Tokyo, Japan), which also developed the sLA sensor device. The recorded data were converted to moving average values over 13‐s intervals and individually underwent zero corrections using the baseline value. The sLT was defined as the first significant increase in the sLA level above the baseline based on graphical plots and Change Finder scores calculated by the Change Finder algorithm (Seki et al., 2021) by three researchers in consultation. Then, the speed at which the sLT was reached was used in the analysis as the sLT‐speed.
Data are presented as mean (standard deviation and standard error: SD and SE). The Shapiro–Wilk test was used to examine the normality of the data distribution. Then, a paired t‐test was performed to compare the sLT‐speed with the bLT‐speed in test 1. The water temperature in the swimming flume between tests 1 and 2 was also compared using a paired t‐test. One‐way analysis of variance (ANOVA) with the Bonferroni test for post hoc analysis was applied to the sLA and bLA levels and the HR to clarify the transitional feature over time. Additionally, the relationship between the sLT‐speed in test 1 and bLT‐speed in test 1 was investigated using Pearson's correlation coefficient test. Furthermore, the Bland–Altman technique was applied to verify the similarities among the different LT speed determination methods. As a secondary analysis, a correlation analysis was performed to examine the relationship between the sLT‐speed in test 2 and bLT‐speed in test 1. The Bland–Altman plots of the sLT‐speed in test 2 and bLT‐speed in test 1 were also confirmed. Statistical analyses were performed using the IBM SPSS Statistics 28.0 (IBM Corp.), and the level of statistical significance was set at 0.05.
3. RESULTS
Twenty‐four participants met the inclusion criteria, completed the study protocol, and were included in the analysis. The participants were 14 men and 10 women with a mean age of 20.7 (SD: 1.8 and SE: 0.4) years, height of 169.7 (SD: 7.9 and SE: 1.6) cm, and body weight of 62.2 (SD: 8.2 and SE: 1.7) kg. Participants had 9.6 (SD: 7.4 and SE: 1.5) years of swimming experience.
Figure 2 demonstrates the sLA and bLA levels during the incremental swimming exercise in test 1. Dynamic changes in the sLA level during the exercise tests were continuously measured and monitored (even underwater) on the smartphone device connected to a wearable sLA sensor device via Bluetooth without delay. During the warm‐up and the start of swimming with an incremental speed, the lactate biosensor registered a negligible current response due to the absence of sweat. In the middle of the incremental speed increase, a drastic rise in the sLA level occurred, which was consistent with the conversion point in the bLA level from a steady state to an increase (Figure 2 and Table 1). Contrary to the results of the sLA, the HR gradually increased from the initiation of the incremental‐speed swimming exercise to the end of exercise in test 1, although the HR fell during each rest period for blood sampling (Figure 2 and Table 1). Because sLT determination was not possible due to the suppression of continuous perspiration by resting, the test 1 data from four participants were excluded from analysis. Despite vigorous upper arm movement in the front crawl at individual peak swimming speeds, no artifacts from the sLA data and no water contamination in the waterproof area around the biosensor chip were observed in any participant after the test (Supplementary Video).
FIGURE 2.
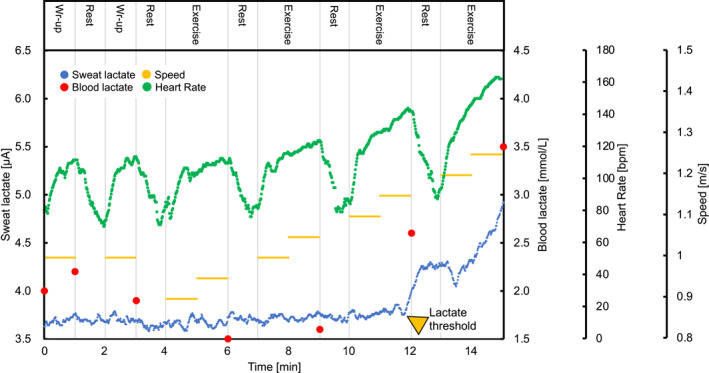
Imaging of the lactate in the sweat and blood during the incremental swimming exercise. Representative graphs of the sweat and blood lactate and heart rate during exercise with a step protocol swimming are shown (test 1).
TABLE 1.
Transition of sweat and blood lactate level and heart rate over time during incremental swimming exercise with and without rest.
| Test 1 (incremental exercise test with breaks) | |||||
|---|---|---|---|---|---|
| Rest | Warm‐up | bLT | sLT | Final | |
| Flow speed, m/s | 0 | 0.87 | 1.15 | 1.22 | 1.39 |
| (0/0) | (0.14/0.03) | (0.12/0.03) | (0.16/0.04) | (0.14 / 0.03) | |
| HR, bpm | 87.9 | 101.1 | 134.3 | 141.6 | 172.1 |
| (14.3/3.2) c , d , e | (10.7/2.4) c , d , e | (16.5/3.7) b , e | (19.5 / 4.4) b , e | (12.2/2.7) b , c , d | |
| bLA, mmol/L | 2.8 | 2.5 | 2.8 | ‐ | 7.4 |
| (0.9/0.2) e | (0.6/0.1) e | (1.1/0.2) e | (3.2/0.7) b , c | ||
| sLA, μA | 3.91 | 3.81 | 3.83 | 3.66 | 5.48 |
| (0.72/0.16) e | (0.69/0.15) e | (1.40/0.31) e | (1.03 / 0.23) e | (1.92 / 0.43) | |
| Test 2 (incremental exercise test without breaks) | |||||
|---|---|---|---|---|---|
| Rest | Warm‐up | bLT | sLT | Final | |
| Flow speed, m/s | 0 | 0.87 | ‐ | 1.13 | 1.22 |
| (0 / 0) | (0.14 / 0.03) | (0.15 / 0.03) | (0.16/0.04) | ||
| HR, bpm | 92.5 | 106.6 | ‐ | 146.5 | 178.2 |
| (15.8/3.5) a , c , e | (14.4 / 3.2) d , e | (18.7/4.2) b , e | (14.5/3.2) b , d | ||
| sLA, μA | 3.76 | 3.62 | ‐ | 4.14 | 6.55 |
| (0.55/0.12) e | (0.53 / 0.11) e | (1.36/0.30) e | (2.54/0.57) | ||
Note: Transition of blood lactate (bLA) and sweat lactate (sLA) and heart rate (HR) in test 1 (incremental exercise test with breaks) and test 2 (incremental exercise test without breaks) are shown. Data are presented as mean (standard deviation/standard error). One‐way ANOVA with post‐hoc test showed that bLA and sLA increased immediately after each threshold, whereas HR increased gradually.
Versus warm‐up (p < 0.05).
Versus warm‐up (p < 0.01).
Versus bLT (p < 0.01).
Versus sLT (p < 0.01).
Versus Final (p < 0.01).
In test 1, the final speed and HR were 1.39 (SD: 0.14 and SE: 0.03) m/s and 172 (SD: 12 and SE: 3) beats per minute (bpm), respectively, whereas in test 2, the values were 1.35 (SD: 0.15 and SE: 0.03) m/s and 179 (SD: 15 and SE: 3) bpm. The final bLA level in test 1 was 7.4 (SD: 3.2 and SE: 0.7) mmol/L. The water temperature in the swimming pool was 30.8°C (SD: 0.8 and SE: 0.2) in test 1 and 30.6°C (SD: 0.6 and SE: 0.1) in test 2 with no significant difference (p = 0.41).
In 20 participants in test 1, the mean sLT‐speed was 1.22 m/s (SD: 0.16, SE: 0.04, and range: 1.00–1.60), and the mean bLT‐speed was 1.15 m/s (SD: 0.12, SE: 0.03, and range: 0.90–1.30). A paired t‐test revealed no significant difference between the sLT‐speed and bLT‐speed (p = 0.09, Figure 3). As shown in Figure 4, the sLT‐speed strongly correlated with the bLT‐speed (p < 0.01 and r = 0.824). The Bland–Altman plot visually demonstrated a negative fixed error between the sLT‐speed and bLT‐speed (sLT‐speed > bLT‐speed), as evidenced by the range of the limit of agreement for these variables (Figure 5). Additionally, the 95% confidence interval (CI) of the difference between the sLT‐speed and bLT‐speed and the significant correlation between the difference and mean in these two values showed systematic errors. Furthermore, when the sLT‐speed and bLT‐speed were compared separately for men (n = 12) and women (n = 8), the results were similar (Figures S3, S4, S5, and S6).
FIGURE 3.
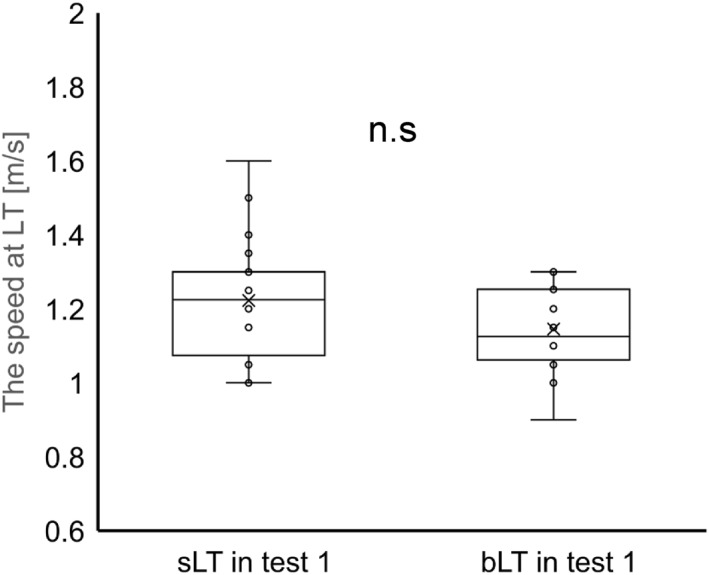
Comparison of the speed at the blood and sweat lactate threshold in test 1. There was no significant difference between the speed at the sweat lactate threshold and the blood lactate threshold.
FIGURE 4.
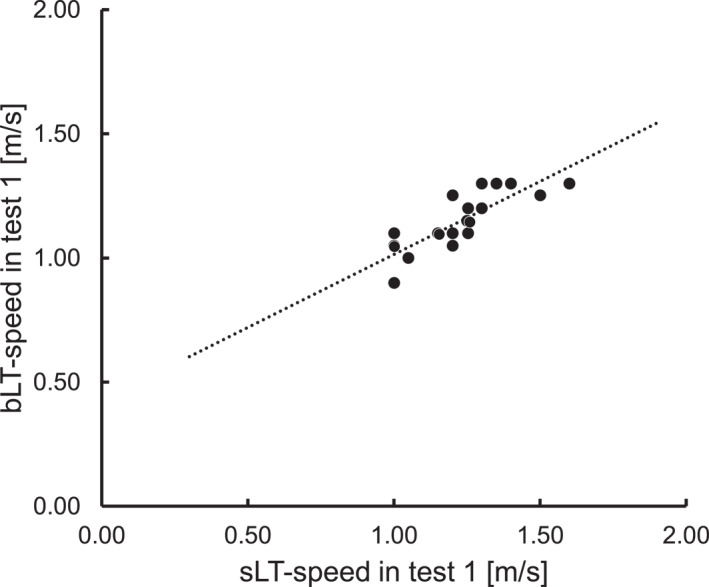
Scatter plot of the speed at the blood lactate threshold and sweat lactate threshold in incremental exercise test without breaks (test 1). In this scatter plot, speed at the sweat lactate threshold was highly correlated with speed at the blood lactate threshold (Pearson correlation coefficient = 0.824 and p < 0.01).
FIGURE 5.
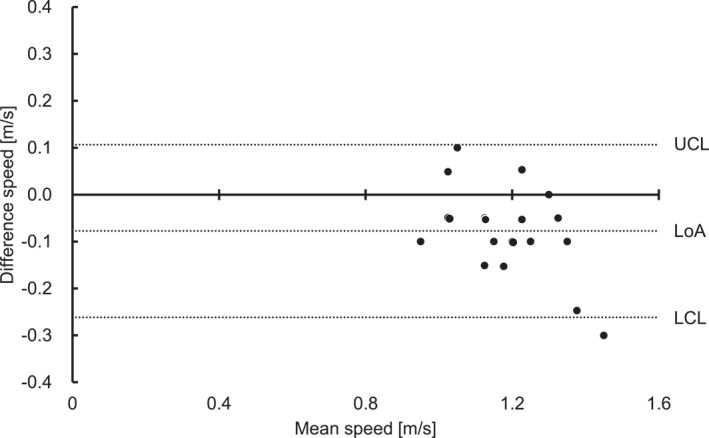
Bland–Altman plot of the speed at the blood lactate threshold and sweat lactate threshold in incremental exercise test without breaks (test 1). This graph shows a scatter plot between the difference and average of the speed at the blood lactate threshold and sweat lactate threshold. The mean difference was 0.08 ± 0.01 m/s. There was fixed bias based on a 95% CI of the difference between the speed at the blood lactate threshold and sweat lactate threshold (95% CI: −0.03 ∼ −0.12). In addition, significant correlation showed proportional bias. CI, confidence interval; LoA, limit of agreement; UCL, upper coefficient limit; and LCL, lower coefficient limit.
In the incremental exercise test without breaks (test 2), it was possible to determine sLT in all 24 participants (representative data are shown in Figure S1 and averaged data in Table 1). The sLT‐speed detected in test 2 strongly correlated with the bLT‐speed in test 1 as shown in Figure 6 (p < 0.001 and r = 0.868). Moreover, the Bland–Altman plot between the sLT‐speed in test 2 and bLT‐speed in test 1 ruled out the existence of any systematic error (Figure 7). Additionally, the Bland–Altman plot between the sLT‐speed in tests 1 and 2 demonstrated the negative fixed error (sLT‐speed in test 1 > test 2, Figure S2).
FIGURE 6.
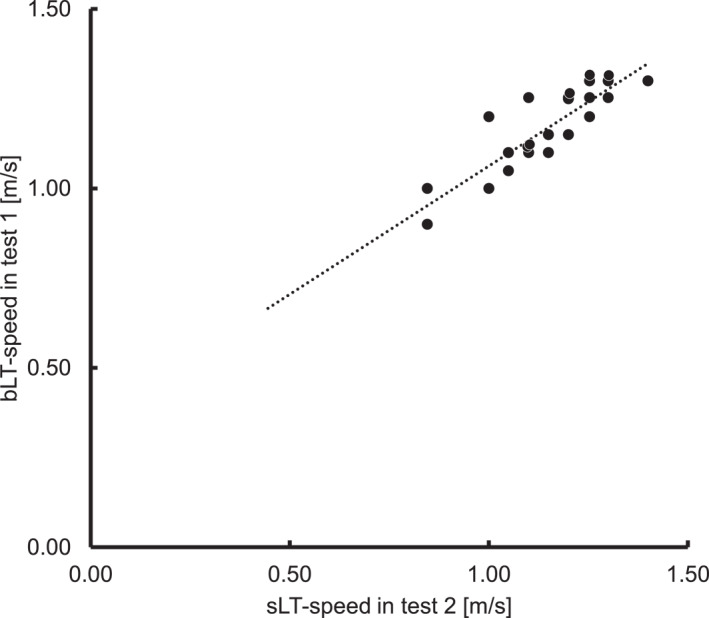
Scatter plot of the speed at sweat lactate threshold in incremental exercise test without breaks (test 2) and blood lactate threshold in incremental exercise test with breaks (test 1). In this scatter plot, speed at the sweat lactate threshold obtained in test 1 was correlated with it obtained in test 2 (Pearson correlation coefficient = 0.868 and p < 0.001).
FIGURE 7.
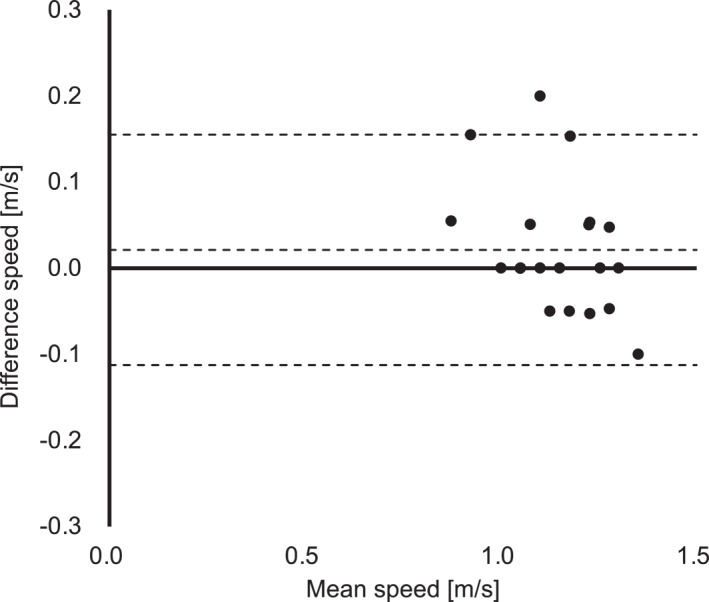
Bland–Altman plot of the speed at sweat lactate threshold in incremental exercise test without breaks (test 2) and blood lactate threshold in incremental exercise test with breaks (test 1). This graph shows no systematic error in the speed at sweat lactate threshold in incremental exercise test without breaks (test 2) and blood lactate threshold in incremental exercise test with breaks (test 1).
4. DISCUSSION
This prospective study provided novel evidence that a waterproof wearable sLA sensor is effective in measuring continuous and real‐time sLA values during swimming exercise tests. The most striking result was that the sLT approximated the bLT, which was traditionally adopted to estimate swimming performance and plan training strategies; this was verified with strong statistical power. This innovative method of measuring the sLT is expected to enable the noninvasive estimation of the transitional point in metabolism during swimming (Figure 8).
FIGURE 8.
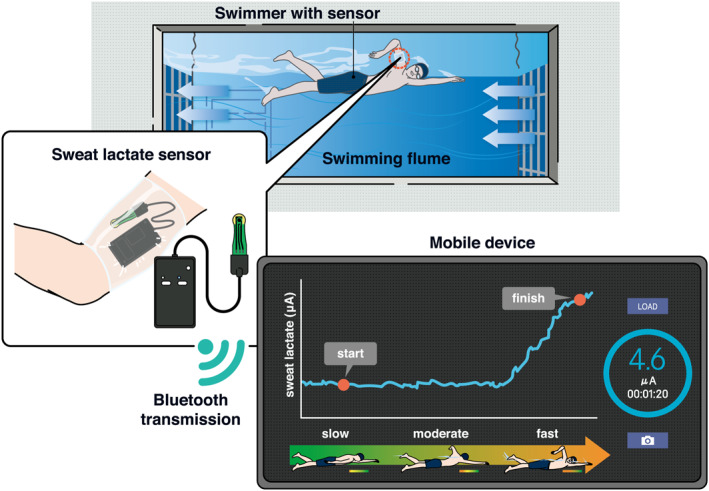
Schematic of the lactate sensing during swimming.
Generally, sLA is considered a byproduct of sweat gland metabolism through perspiration. In the sLA sensor used in this study, lactate oxidase immobilized on the sensor chip reacts with lactate in the sweat (Seki et al., 2021). Therefore, sweating is an essential requirement for detecting sLA. There are two mechanisms of sweating, thermogenic and non‐thermogenic sweating, which are modulated by various internal and external factors (Baker, 2019). Among the various factors, the environment, including the air temperature and humidity, and metabolism mainly affect sweating during exercise on land (Baker, 2017). In contrast, the immersion water temperature directly affects perspiration during swimming, and higher temperatures promote perspiration through increased metabolic expenditure (McMurray & Horvath, 1979). Compared with previous reports of certified sweat during swimming (Maughan et al., 2009), the higher water temperature in the present study (average of 30.8°C) may have resulted in more sweating. Other evidence of warranted sweating was the participant's physical response to incremental increases in the water speed. Generally, greater exercise intensity is likely to promote sweating through the increased requirement of sweat evaporation for heat balance (Baker, 2017). In the current study, with an increase in swimming speed, the HR gradually rose until exercise termination, peaking at 142 bpm (SD: 20 and SE: 4) at sLT and finally 172 bpm (SD: 12 and SE: 3) (Table 1). These values were higher than previously reported sweating thresholds (Torii et al., 1995), which supports the occurrence of sweating in the present experiment. Nonetheless, the difficulty of accurately confirming sweating underwater with currently available technology hindered confirmation of the actual timing of sweating in this study. Meanwhile, although the water temperature used by swimmers for training is even lower than that in the swimming flume used in the present experiment (25–28°C), perspiration is presumed to still occur in those conditions because the incremental evaporative demand for heat balance is provoked by the incremental swimming load (McMurray & Horvath, 1979). Hence, the proposed method is also expected to be effective for noninvasive estimation of the transitional point in metabolism under the conditions normally used for swimming practice. Nevertheless, further verification is needed to determine the practical applications of the method.
Another important consideration is that the application of wearable biosensors for swimming has several problems, including artifacts and water contamination, caused by the swimming motion. As shown in Supplementary Video, in general, the front crawl at a higher speed enhances the stroke rate (Figueiredo et al., 2013), which evokes a high impact at the water surface. Therefore, although the attachment of the sensor to the upper arm used in the present study, as in previous studies (Katsumata et al., 2021; Okawara et al., 2022a, 2022b), might raise concerns, artifacts were not observed in the present study (Figure 2 and Figure S1). In addition, no water contamination was observed around the sensor. Although the torso and forehead are advantageous locations because they do not usually cause artifacts during exercise (Havenith et al., 2008; Okawara et al., 2022a, 2022b), application to these points is likely to induce high perspiration and will lead to simultaneous dilution of the analyte (Ament et al., 1997; Derbyshire et al., 2012). Hence, the attachment of sensors to these body parts may make it difficult to interpret the results, particularly in well‐trained athletes with low sweating thresholds (Baker, 2019). In addition, the fact that these potential sources of measurement errors did not affect the results even in conditions of high impact surface swimming and strong water flow suggests that this method could successfully be applied to free swimming, despite the turning and wall pushing movements involved in that type of swimming. Therefore, the current finding that the sensor attached to the upper arm enabled measurement without dilution or artifacts, even at high speeds, strongly implies that wearable biosensors for analytes in sweat could be useful during swimming.
Unlike on land, the previously reported methods of estimating AT in swimming required intermittent exercise test protocols for the collection of analytes. One possible reason for this is that in a specific water‐covered environment, various limitations, including the sensor portability, waterproofed device performance, and preservation of analytes, disturb reliable and validated bioinformation sensing. To address these limitations, Reeder et al. attempted to analyze sweat using a waterproof sensor in water; however, they did not refer to practical applications to estimate AT (Reeder et al., 2019). Therefore, the present study applied a novel sLA measurement technique to the real‐time assessment of AT during swimming.
Originally, sLA levels were reported to not reflect bLA levels during land‐based exercise (Baker & Wolfe, 2020). However, the application of the inflection point in sLA analysis has demonstrated good capability of detecting AT on land (Katsumata et al., 2021; Seki et al., 2021), and the current study enabled real‐time assessment of AT in water with the advantage of no interruptions. Understandably, the biological response and information derived from intermittent exercise differ from those in continuous exercise (Combes et al., 2018; Nicolò et al., 2014). Thus, a new measurement method that does not require exercise interruptions to collect analytes enables the evaluation of more practical bioinformation during swimming. Notably, the sLT‐speed in test 2 (without interruption) was significantly lower than that in test 1 (with interruption). This beneficial, continual sensing is attributed to the ultraviolet lamp coating on the sensor chip, as this coating prevents the rapid response of lactate oxidase and prompts longer responsiveness. In addition, continual sensing facilitated the determination of the inflection point in the sLA. Over the years, several concepts and methods have been applied to determine the bLT (Faude et al., 2009). Nonetheless, most of these had reciprocal problems. For instance, infrequent blood sampling complicates the identification of the inflection point, whereas frequent sampling was deemed too invasive. In contrast, continuous sLA sampling yields noninvasive and simple sLT measurements; this method has shown excellent reliability in determining sLA (Okawara et al., 2023). For several years, MLSS or bLT, both with a favorable association with swim performance, have contributed to the planning of individualized training regimens (Hering & Stepan, 2021; Puccinelli et al., 2020). Considering the limitations of these traditional indicators, the ability of the sLT to estimate performance is valuable for improving training strategies in swimming. Furthermore, the advantages of a single, noninvasive, and simple measurement may facilitate repeated AT evaluations at shorter intervals. Frequent AT assessments may promote the development of ideal regimens for personalized training with appropriate loads that alter physical performance, thereby contributing to further improvements in swimming performance. In addition, not requiring the manual collection of analytes in AT assessments to facilitate simultaneous multi‐person measurements is also valuable for athletes and coaches. Meanwhile, the sLT‐speed obtained from the exercise test in the flume in the current study is not necessarily applicable to free‐swimming conditions directly, as an exact match between the flow speed in the flume and the speed achieved by the athlete during free swimming is unlikely. However, considering that physiological measurements obtained in the flume have been validated in previous reports (Nagle et al., 2023; Ruiz‐Navarro et al., 2020), the sLT‐speed obtained using the present methodology could be a useful indicator of aerobic capacity for athletes and coaches following the application of a formula for conversion. Further research is needed to determine the appropriate conversion algorithm. With the recent introduction of hypoxic training to swimming (Trincat et al., 2017), future swimming activities are expected to include a wide range of environmental conditions. Progress has also been made in the application of the current method of AT estimation using sLA to a range of environmental conditions including hypoxia (Okawara et al., 2023). Hence, further studies focused on different participant backgrounds and environments are required, which could ultimately provide benefits for coaches and athletes in the future.
The findings of this study should be interpreted in light of the following limitations. First, the participation of swimmers with a wide range of performances resulted in findings representative of the general population; therefore, the influence of a selection bias could not be completely excluded. However, these heterogeneous participant characteristics, including sex and performance, suggest the possibility of the broader application of this measurement technology for general swimmers. This is also suggested by the similar results obtained in the cases of either male or female swimmers in this study. Second, potential contamination with sweat evoked by the high temperature and humidity of the flume room might have resulted in higher than anticipated resting bLA values before immersion. However, this would not have affected the determination of the bLT. Third, because water temperature affects human physiological responses (Wilcock et al., 2006), the water temperature of the measurement environment may have affected the results. Additionally, the feasibility of applying this measurement technology to an AT evaluation performed in a normal pool requires further investigation to ensure its widespread practical application. Finally, since the protocol for test 1 involved the measurement of blood lactate every 2 min during the swimming motion, one must consider that the actual blood lactate levels during the first minute of swimming were unknown, and therefore, the point of bLT defined in this study was an estimate. Regardless, we strongly believe that this method of estimating the LT using sLA is useful and that it overcomes the major disadvantages of previous estimation methods using blood lactate, which require stopping the swimming motion for the measurement.
5. CONCLUSION
This study achieved real‐time monitoring of sLA levels using a waterproof wearable sensor during swimming with vigorous arm movements. The simple and noninvasive method introduced in the study provided sLT measurements that approximated those of bLT obtained during incremental swimming exercise.
AUTHOR CONTRIBUTIONS
Hiroki Okawara: Conceptualization, Methodology, Formal analysis, Investigation, Resources, Writing – Original Draft, Visualization. Tomonori Sawada: Conceptualization, Methodology, Formal analysis, Investigation, Resources, Writing – Original Draft, Visualization. Daisuke Nakashima: Conceptualization, Methodology, Resources, Writing – Review & Editing, Supervision. Haruki Fujitsuka: Conceptualization, Methodology, Investigation, Writing – Review & Editing, Visualization. Yuki Muramoto: Investigation, Writing – Review & Editing. Daigo Hinokuma: Investigation, Writing – Review & Editing. Yuta Oshikiri: Conceptualization, Methodology, Investigation, Writing – Review & Editing, Visualization. Keisuke Ishizaki: Investigation, Writing – Review & Editing, Visualization. Jiro Miki: Investigation, Resources, Writing – Review & Editing, Supervision. Reira Hara: Investigation, Resources, Writing – Review & Editing, Supervision. Motoaki Sano: Conceptualization, Methodology, Resources, Writing – Review & Editing, Project administration. Kazuki Sato: Conceptualization, Methodology, Resources, Writing – Review & Editing, Project administration. Masaya Nakamura: Conceptualization, Methodology, Resources, Writing – Review & Editing, Project administration. Takeo Nagura: Conceptualization, Methodology, Resources, Writing – Review & Editing, Project administration. Yoshinori Katsumata: Conceptualization, Methodology, Formal analysis, Investigation, Writing – Review & Editing, Visualization, Supervision, Project administration, Funding acquisition. All authors certificated the final version manuscript and agreed the submission of it and the accountability for all aspects of this work.
CONFLICT OF INTEREST STATEMENT
Daisuke Nakashima is the president of Grace Imaging Inc. and holds shares in this company, which sells lactic acid‐sensing equipment. Nakashima was not involved in the data acquisition and analysis. Hiroki Okawara, Tomonori Sawada, Haruki Fujitsuka, Yuki Muramoto, Daigo Hinokuma, Yuta Oshikiri, Keisuke Ishizaki, Jiro Miki, Reira Hara, Motoaki Sano, Kazuki Sato, Masaya Nakamura, Takeo Nagura, and Yoshinori Katsumata declare no competing interests. The authors declare that the results of the study are presented clearly, honestly, and without fabrication, falsification, or inappropriate data manipulation.
PATIENT CONSENT STATEMENT
Written informed consent was obtained from all the study participants for participation and publication of the findings. There was no patient and public involvement.
Supporting information
Supporting Information S1
Supporting Information S2
Video S1
ACKNOWLEDGMENTS
The authors thank AQUA LAB and the Nihon University swimming team for their assistance with the measurements. The authors also thank Masato Suzuki for technical assistance. The authors are grateful to Editage for editing the manuscript. This study was funded by the Japan Agency for Medical Research and Development (award number: 21ek0210130h0003), the Keio University Global Research Institute IoT Healthcare Research Consortium (grant number: 02‐066‐0008), and the Japan Science and Technology Agency (grant number: JPMJPF2101). The funders had no role in the study design, data collection and analysis, decision to publish, or manuscript preparation.
Hiroki Okawara and Tomonori Sawada are co‐first authors
Contributor Information
Daisuke Nakashima, Email: nakashima@keio.jp.
Yoshinori Katsumata, Email: goodcentury21@keio.jp.
DATA AVAILABILITY STATEMENT
The data that support the findings of this study are available from the corresponding author upon reasonable request.
REFERENCES
- Ament, W. , Huizenga J., Mook G., Gips C., and Verkerke Cj. 1997. “Lactate and Ammonia Concentration in Blood and Sweat during Incremental Cycle Ergometer Exercise.” International Journal of Sports Medicine 18(1): 35–39. 10.1055/s-2007-972592. [DOI] [PubMed] [Google Scholar]
- Baker, Lindsay B. 2017. “Sweating Rate and Sweat Sodium Concentration in Athletes: A Review of Methodology and Intra/interindividual Variability.” Sports Medicine 47(Suppl. 1): 111–128. 10.1007/s40279-017-0691-5. [DOI] [PMC free article] [PubMed] [Google Scholar]
- Baker, Lindsay B. 2019. “Physiology of Sweat Gland Function: The Roles of Sweating and Sweat Composition in Human Health.” Temperature 6(3): 211–259. 10.1080/23328940.2019.1632145. [DOI] [PMC free article] [PubMed] [Google Scholar]
- Baker, Lindsay B. , and Wolfe Anthony S.. 2020. “Physiological Mechanisms Determining Eccrine Sweat Composition.” European Journal of Applied Physiology 120(4): 719–752. 10.1007/s00421-020-04323-7. [DOI] [PMC free article] [PubMed] [Google Scholar]
- Baldassarre, Roberto , Bonifazi Marco, Zamparo Paola, and Piacentini Maria Francesca. 2017. “Characteristics and Challenges of Open‐Water Swimming Performance: A Review.” International Journal of Sports Physiology and Performance 12(10): 1275–1284. 10.1123/ijspp.2017-0230. [DOI] [PubMed] [Google Scholar]
- Beneke, Ralph . 2003. “Methodological Aspects of Maximal Lactate Steady State‐Implications for Performance Testing.” European Journal of Applied Physiology 89(1): 95–99. 10.1007/s00421-002-0783-1. [DOI] [PubMed] [Google Scholar]
- Carvalho, Diogo Duarte , Soares Susana, Zacca Rodrigo, Sousa João, Marinho Daniel Almeida, Silva António José, Vilas‐Boas João Paulo, Fernandes Ricardo J., and Fernandes R. J.. 2020. “Anaerobic Threshold Biophysical Characterisation of the Four Swimming Techniques.” International Journal of Sports Medicine 41(5): 318–327. 10.1055/a-0975-9532. [DOI] [PubMed] [Google Scholar]
- Combes, Adrien , Dekerle Jeanne, Bougault Valérie, and Daussin Frédéric N.. 2018. “Physiological Comparison of Intensity‐Controlled, Isocaloric Intermittent and Continuous Exercise.” European Journal of Sport Science 18(10): 1368–1375. 10.1080/17461391.2018.1491627. [DOI] [PubMed] [Google Scholar]
- Derbyshire, Philip J. , Barr Hugh, Davis Frank, and Higson Seamus P. J.. 2012. “Lactate in Human Sweat: A Critical Review of Research to the Present Day.” The Journal of Physiological Sciences 62(6): 429–440. 10.1007/s12576-012-0213-z. [DOI] [PMC free article] [PubMed] [Google Scholar]
- Faude, Oliver , Kindermann Wilfried, and Meyer Tim. 2009. “Lactate Threshold Concepts: How Valid Are They?” Sports Medicine 39(6): 469–490. 10.2165/00007256-200939060-00003. [DOI] [PubMed] [Google Scholar]
- Figueiredo, Pedro , Morais Pedro, Vilas‐Boas João Paulo, and Fernandes Ricardo J.. 2013. “Changes in Arm Coordination and Stroke Parameters on Transition through the Lactate Threshold.” European Journal of Applied Physiology 113(8): 1957–1964. 10.1007/s00421-013-2617-8. [DOI] [PubMed] [Google Scholar]
- Havenith, George , Fogarty Alison, Bartlett Rebecca, Smith Caroline J., and Ventenat Vincent. 2008. “Male and Female Upper Body Sweat Distribution during Running Measured with Technical Absorbents.” European Journal of Applied Physiology 104(2): 245–255. 10.1007/s00421-007-0636-z. [DOI] [PubMed] [Google Scholar]
- Hering, Gernot O. , and Stepan Jens. 2021. “The Maximal Lactate Steady State Workload Determines Individual Swimming Performance.” Frontiers in Physiology 12: 668123. 10.3389/fphys.2021.668123. [DOI] [PMC free article] [PubMed] [Google Scholar]
- Katsumata, Yoshinori , Sano Motoaki, Okawara Hiroki, Sawada Tomonori, Nakashima Daisuke, Ichihara Genki, Fukuda Keiichi, Sato Kazuki, Kobayashi Eiji, and Kobayashi E.. 2021. “Laminar Flow Ventilation System to Prevent Airborne Infection during Exercise in the COVID‐19 Crisis: A Single‐Center Observational Study.” PLoS One 16(11): e0257549. 10.1371/journal.pone.0257549. [DOI] [PMC free article] [PubMed] [Google Scholar]
- Maughan, Ronald J. , Dargavel Lisa A., Hares Rachael, and Shirreffs Susan M.. 2009. “Water and Salt Balance of Well‐Trained Swimmers in Training.” International Journal of Sport Nutrition and Exercise Metabolism 19(6): 598–606. 10.1123/ijsnem.19.6.598. [DOI] [PubMed] [Google Scholar]
- McMurray, R. G. , and Horvath S. M.. 1979. “Thermoregulation in Swimmers and Runners.” Journal of Applied Physiology: Respiratory, Environmental & Exercise Physiology 46(6): 1086–1092. 10.1152/jappl.1979.46.6.1086. [DOI] [PubMed] [Google Scholar]
- Nagle, Elizabeth F. , Nagai Takashi, Beethe Anne, Lovalekar Mita, Tuite Meghan S., Beckner Meaghan E., Zera Jacquelyn N., et al. 2023. “Reliability and Validity of a Flume‐Based Maximal Oxygen Uptake Swimming Test.” Sports 11(2): 42. 10.3390/sports11020042. [DOI] [PMC free article] [PubMed] [Google Scholar]
- Nicolò, Andrea , Bazzucchi Ilenia, Haxhi Jonida, Felici Francesco, and Sacchetti Massimo. 2014. “Comparing Continuous and Intermittent Exercise: An “Isoeffort” and “Isotime” Approach.” PLoS One 9(4): e94990. 10.1371/journal.pone.0094990. [DOI] [PMC free article] [PubMed] [Google Scholar]
- Nikitakis, Ioannis S. , and Toubekis Argyris G.. 2021. “Lactate Threshold Evaluation in Swimmers: The Importance of Age and Method.” International Journal of Sports Medicine 42(9): 818–824. 10.1055/a-1342-7446. [DOI] [PubMed] [Google Scholar]
- Okawara, Hiroki , Iwasawa Yuji, Sawada Tomonori, Sugai Kazuhisa, Daigo Kyohei, Seki Yuta, Ichihara Genki, et al. 2023. “Anaerobic Threshold Using Sweat Lactate Sensor under Hypoxia.” Scientific Reports 13(1): 22865. 10.1038/s41598-023-49369-7. [DOI] [PMC free article] [PubMed] [Google Scholar]
- Okawara, Hiroki , Sawada Tomonori, Nakashima Daisuke, Maeda Yuta, Minoji Shunsuke, Morisue Takashi, Katsumata Yoshinori, et al. 2022a. “Kinetic Changes in Sweat Lactate Following Fatigue during Constant Workload Exercise.” Physiological Reports 10(2): e15169. 10.14814/phy2.15169. [DOI] [PMC free article] [PubMed] [Google Scholar]
- Okawara, Hiroki , Sawada Tomonori, Nakashima Daisuke, Maeda Yuta, Minoji Shunsuke, Morisue Takashi, Katsumata Yoshinori, et al. 2022b. “Realtime Monitoring of Local Sweat Rate Kinetics during Constant‐Load Exercise Using Perspiration‐Meter with Airflow Compensation System.” Sensors 22(15): 5473. 10.3390/s22155473. [DOI] [PMC free article] [PubMed] [Google Scholar]
- Pelarigo, Jailton G. , Fernandes Ricardo J., Ribeiro João, Denadai Benedito S., Greco Camila C., and Vilas‐Boas João P.. 2018. “Comparison of Different Methods for the Swimming Aerobic Capacity Evaluation.” The Journal of Strength & Conditioning Research 32(12): 3542–3551. 10.1519/JSC.0000000000001873. [DOI] [PubMed] [Google Scholar]
- Pelarigo, Jailton Gregório , Machado Leandro, Fernandes Ricardo Jorge, Greco Camila Coelho, and Vilas‐Boas João Paulo. 2017. “Oxygen Uptake Kinetics and Energy System’s Contribution Around Maximal Lactate Steady State Swimming Intensity.” PLoS One 12(2): e0167263. 10.1371/journal.pone.0167263. [DOI] [PMC free article] [PubMed] [Google Scholar]
- Puccinelli, Paulo J. , Lima Giscard H. O., Pesquero João B., de Lira Claudio A. B., Vancini Rodrigo L., Nikolaids Pantelis T., Knechtle Beat, Andrade Marilia S., and Andrade M. S.. 2020. “Previous Experience, Aerobic Capacity and Body Composition Are the Best Predictors for Olympic Distance Triathlon Performance: Predictors in Amateur Triathlon.” Physiology and Behavior 225: 113110. 10.1016/j.physbeh.2020.113110. [DOI] [PubMed] [Google Scholar]
- Reeder, Jonathan T. , Choi Jungil, Xue Yeguang, Gutruf Philipp, Hanson Justin, Liu Mark, Ray Tyler, et al. 2019. “Waterproof, Electronics‐Enabled, Epidermal Microfluidic Devices for Sweat Collection, Biomarker Analysis, and Thermography in Aquatic Settings.” Science Advances 5(1): eaau6356. 10.1126/sciadv.aau6356. [DOI] [PMC free article] [PubMed] [Google Scholar]
- Ribeiro, J. , Figueiredo P., Sousa M., De Jesus K., Keskinen K., Vilas‐Boas J. P., and Fernandes R. J.. 2015. “Metabolic and Ventilatory Thresholds Assessment in Front Crawl Swimming.” The Journal of Sports Medicine and Physical Fitness 55(7–8): 701–707. [PubMed] [Google Scholar]
- Ruiz‐Navarro, Jesús J. , Morouço Pedro G., and Arellano Raúl. 2020. “Relationship between Tethered Swimming in a Flume and Swimming Performance.” International Journal of Sports Physiology and Performance 15(8): 1087–1094. 10.1123/ijspp.2019-0466. [DOI] [PubMed] [Google Scholar]
- Seki, Yuta , Nakashima Daisuke, Shiraishi Yasuyuki, Ryuzaki Toshinobu, Ikura Hidehiko, Miura Kotaro, Suzuki Masato, et al. 2021. “A Novel Device for Detecting Anaerobic Threshold Using Sweat Lactate during Exercise.” Scientific Reports 11(1): 4929. 10.1038/s41598-021-84381-9. [DOI] [PMC free article] [PubMed] [Google Scholar]
- Skorski, Sabrina , Faude Oliver, Urhausen Axel, Kindermann Wilfried, and Meyer Tim. 2012. “Intensity Control in Swim Training by Means of the Individual Anaerobic Threshold.” The Journal of Strength & Conditioning Research 26(12): 3304–3311. 10.1519/JSC.0b013e31824b6014. [DOI] [PubMed] [Google Scholar]
- Torii, M. , Nakayama H., and Sasaki T.. 1995. “Thermoregulation of Exercising Men in the Morning Rise and Evening Fall Phases of Internal Temperature.” British Journal of Sports Medicine 29(2): 113–120. 10.1136/bjsm.29.2.113. [DOI] [PMC free article] [PubMed] [Google Scholar]
- Trincat, Laurent , Woorons Xavier, and Millet Grégoire P.. 2017. “Repeated‐sprint Training in Hypoxia Induced by Voluntary Hypoventilation in Swimming.” International Journal of Sports Physiology and Performance 12(3): 329–335. 10.1123/ijspp.2015-0674. [DOI] [PubMed] [Google Scholar]
- Wilcock, Ian M. , Cronin John B., and Hing Wayne A.. 2006. “Physiological Response to Water Immersion: A Method for Sport Recovery?” Sports Medicine 36(9): 747–765. 10.2165/00007256-200636090-00003. [DOI] [PubMed] [Google Scholar]
Associated Data
This section collects any data citations, data availability statements, or supplementary materials included in this article.
Supplementary Materials
Supporting Information S1
Supporting Information S2
Video S1
Data Availability Statement
The data that support the findings of this study are available from the corresponding author upon reasonable request.


