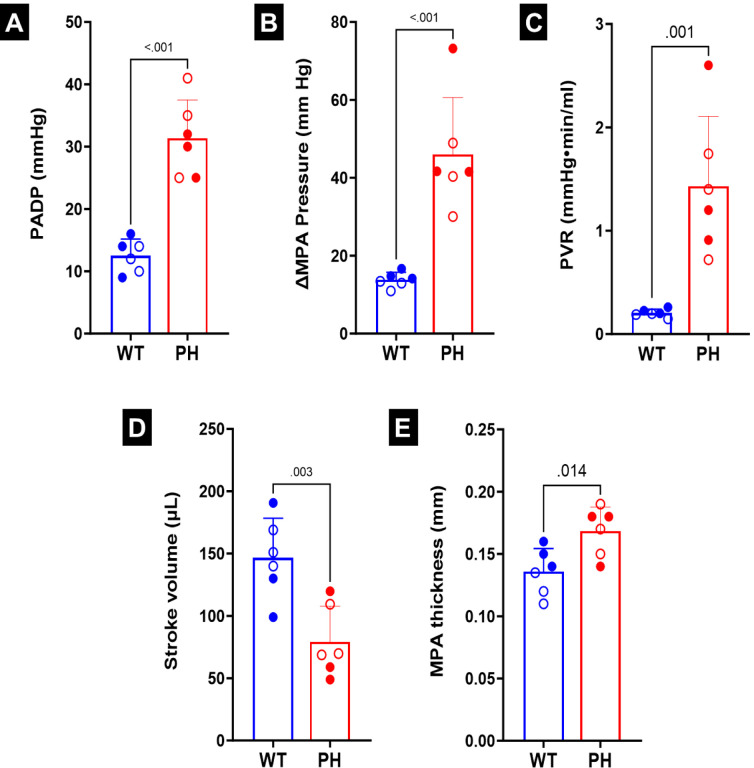
Fig. 3.
(A) Pressure in the main pulmonary artery (MPA) at diastole (PADP). (B) Difference in MPA pressure between systole and diastole (ΔMPA pressure).(C) Pulmonary vascular resistance (PVR.) (D) Stroke volume. (E) MPA thickness. Statistics were performed using student t-tests. Male and female animals are denoted by filled and hollow markers, respectively. CTL: n=6, PH: n=6.

