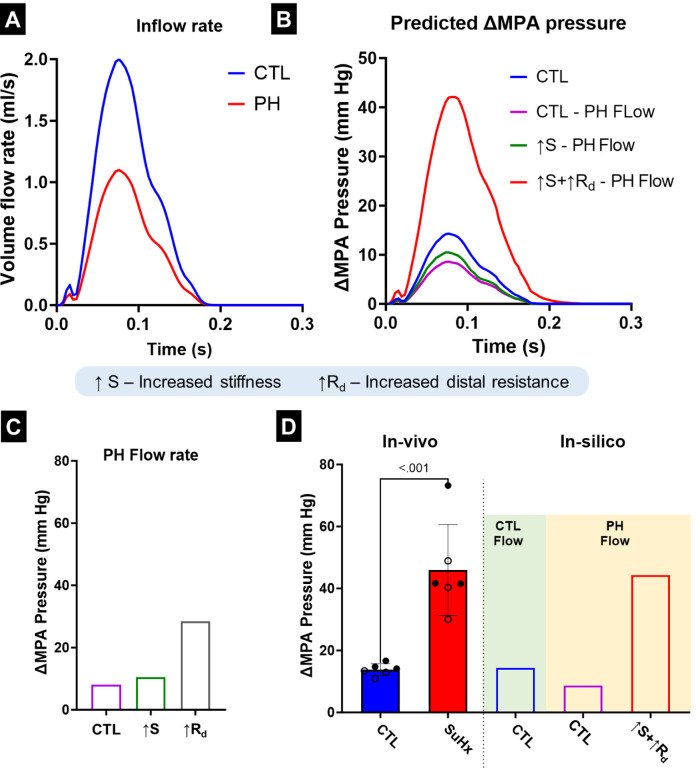
Fig. 5.
(A) Measured main pulmonary artery (MPA) flow profile in the control (CTL) and pulmonary hypertension (PH) rats used in the in-silico model. (B) The simulated pressure waveform obtained from the in-silico model for the MPA after altering flow and remodeling parameters. (C) Simulated changes in ΔMPA pressure as a result of individual remodeling parameters. (D) The ΔMPA pressure obtained through in-vivo measurements and in-silico simulations. Male and female animals are denoted by filled and hollow markers, respectively. CTL: n=6, PH: n=6. ΔMPA Pressure: difference in the MPA pressure between systole and diastole.

