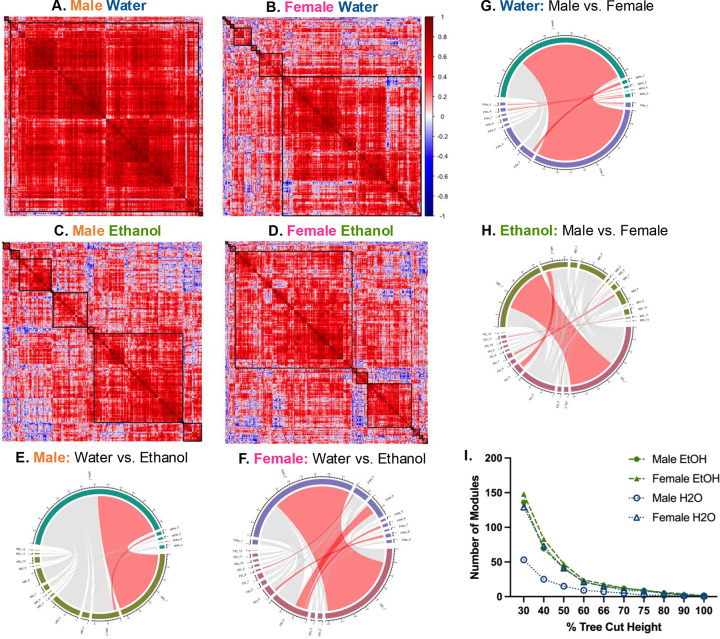
Figure 3: Sex and fluid determine network module number, size, and composition.
(A-D) Hierarchically clustered heatmaps of Pearson’s correlation matrices [R, square root transformed c-Fos density (cells/mm3)] for each sex and fluid group. Black squares denote the modules determined when the cluster dendrogram was cut at 70% tree height.
(A) Male water (n=5 modules).
(B) Female water (n=9 modules).
(C) Male ethanol (n=12 modules).
(D) Female ethanol (n=12 modules).
(E-H) Chord diagrams comparing number of regions in each module within sex (E&F) or fluid (G&H) groups. Red chords indicate modules with a significant number of regions that overlap between networks (fisher’s test, fdr<0.05).
(E) Significant overlap of regions between MWa1 and MEt, and MWa2 and MEt2.
(F) Significant overlap of regions between FWa2 and FEt1, FWa3 and FEt8, FWa4 and FEt4, FWa6 and FEt4, and FWa8 and FEt5.
(G) Significant overlap of regions between MEt1 and FEt1, MEt2 and FEt5, MEt5 and FEt3, MEt8 and FEt7, and MEt11 and FEt11.
(H) Significant overlap of regions between MWa1 and FWa2, MWa2 and FWa3, MWa3 and FWa8, MWa4 and FWa8, MWa5 and FWa1, and MWa5 and FWa9.
(I) Number of modules by percent tree cut height.
Ethanol denoted by green, filled symbols, water denoted by open, blue symbols. Females denoted as triangles, males denoted by circles. MWa, male water; MEt, male ethanol; FWa, female water; FEt, female ethanol. See Tables S6, S8, S10, and S12 for further information.

