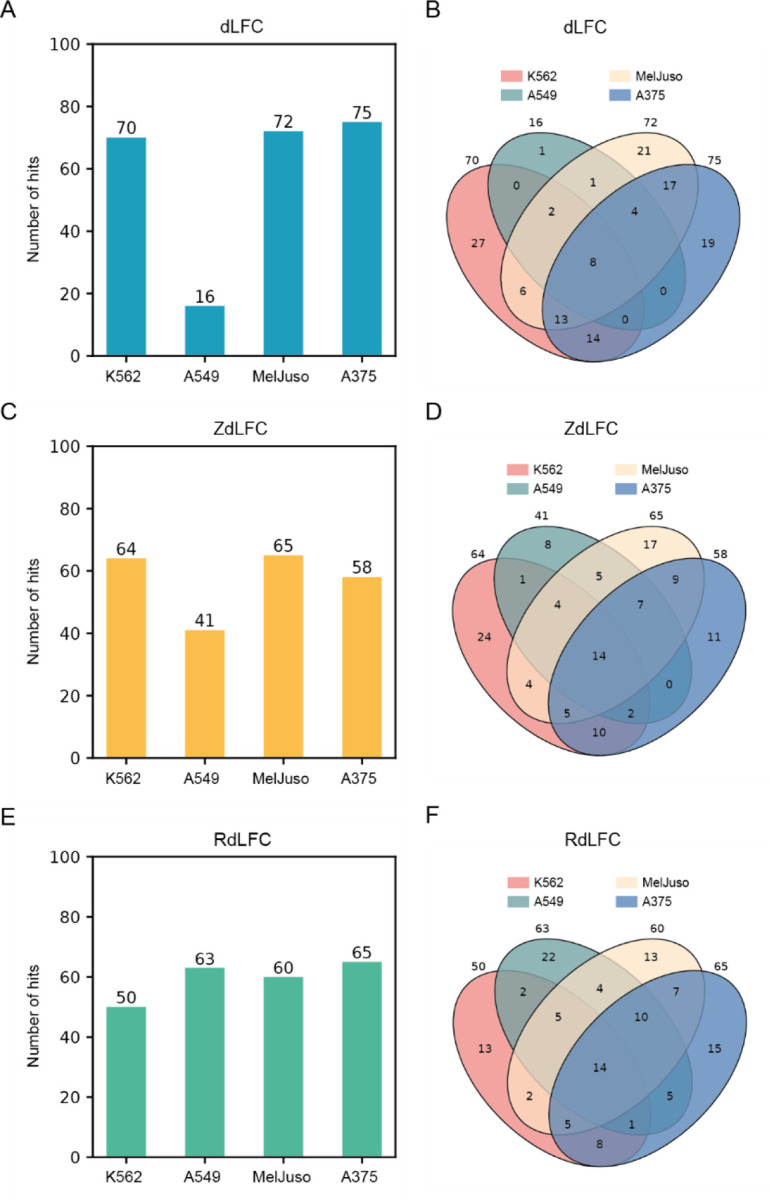
Figure 2.

(A) Bar plot showing the number of synthetic lethal hits in each screen identified using the dLFC method with a threshold of dLFC < −1 and LFC < −1. (C) Bar plot showing the number of synthetic lethal hits in each screen identified using the ZdLFC method with a threshold of ZdLFC < −2 and ZLFC < −2. (E) Bar plot showing the number of synthetic lethal hits in each screen identified using the RdLFC method with a threshold of RdLFC < −0.7 and ZLFC < −2. (B, D, F) Venn diagrams illustrating the overlap of synthetic lethal hits identified in each of the four cell lines using the dLFC, ZdLFC, and RdLFC methods, respectively.
