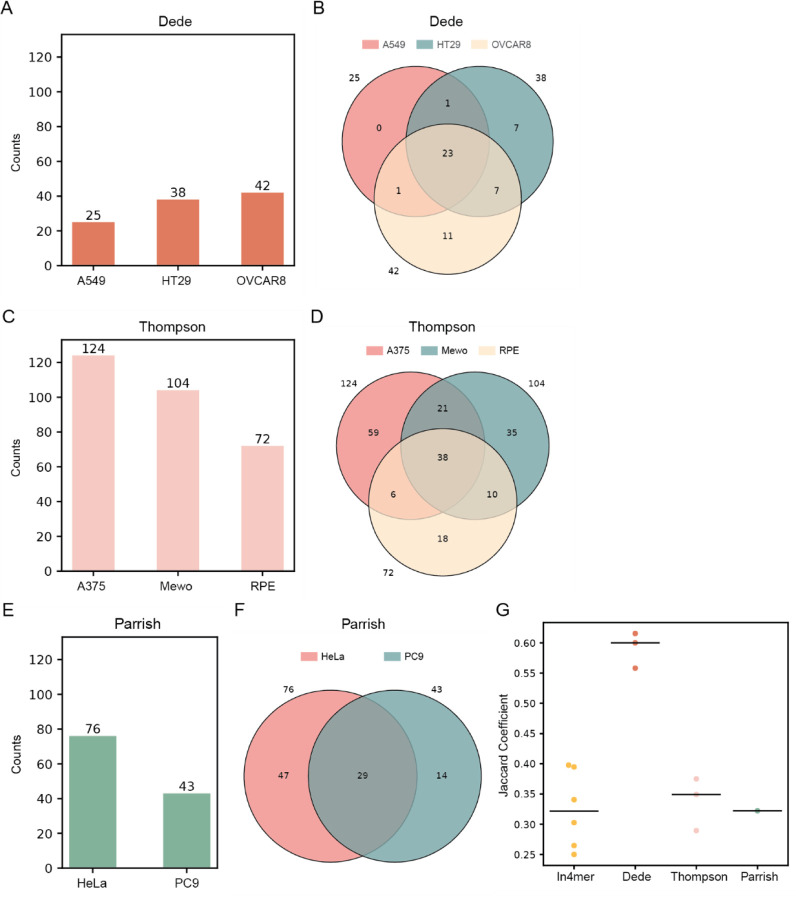
Figure 4.
(A, C, E) Bar plots showing the number of synthetic lethal hits in each cell line from three other studies: a Cas12a-based screen6 and two SpCas9-based screens7,8. Hits were identified using the ZdLFC method with a threshold of ZdLFC < −2 and ZLFC < −2. (B, D, F) Venn diagrams illustrating the overlap of synthetic lethal hits identified in each cell line from the three studies using the ZdLFC method. (G) Jaccard coefficients comparing the hits across all pairs of cell lines within each study. Black line indicates the median of Jaccard coefficients for each study.

