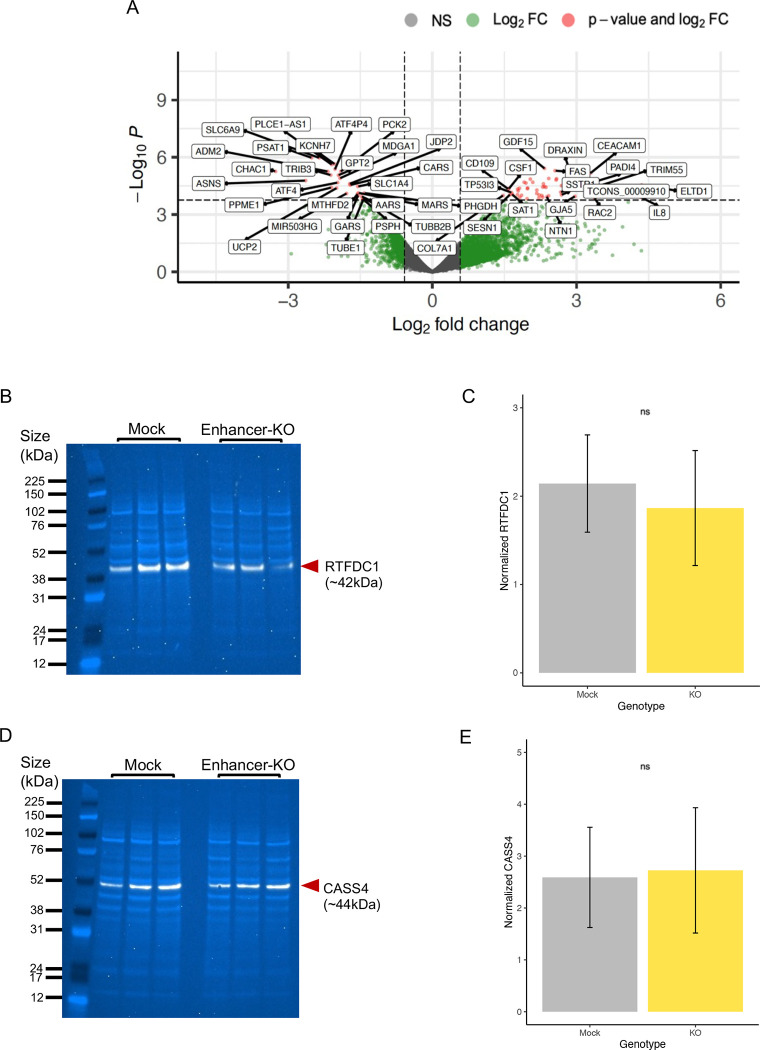
Figure 3: Molecular characterization of rs6024870-enhancer KO HMC3 clones.
(A) Volcano plot showing differentially expressed genes between 3 homozygous KO and 2 control mock clones. (B) Immunoblot for RTFDC1 in mock and enhancer-KO clones. White band: RTFDC1. Light blue bands: whole protein stain. (C) Quantification of RTFDC1 immunoblots in mock and enhancer-KO clones. For each genotype, N=6 (3 clones, 2 protein samples per clone). Bars represent sample mean, error bars represet +/−1 standard deviation of the mean. P=0.44 by Student’s 2-sample T-test. (D) Same as B, but for CASS4. (E) Same as C, but for CASS4. P=0.83 by Student’s 2-sample T-test.

