

SUMMARY
Glioblastoma (GBM) is an aggressive brain cancer with limited therapeutic options. Natural killer (NK) cells are innate immune cells with strong anti-tumor activity and may offer a promising treatment strategy for GBM. We compared the anti-GBM activity of NK cells engineered to express IL-15 or IL-21. Using multiple in vivo models, IL-21 NK cells were superior to IL-15 NK cells both in terms of safety and long-term anti-tumor activity, with locoregionally-administered IL-15 NK cells proving toxic and ineffective at tumor control. IL-21 NK cells displayed a unique chromatin accessibility signature, with CCAAT/Enhancer-Binding Proteins (C/EBP), especially CEBPD, serving as key transcription factors regulating their enhanced function. Deletion of CEBPD resulted in loss of IL-21 NK cell potency while its overexpression increased NK cell long-term cytotoxicity and metabolic fitness. These results suggest that IL-21, through C/EBP transcription factors, drives epigenetic reprogramming of NK cells, enhancing their anti-tumor efficacy against GBM.
Keywords: GBM, NK cells, IL-21, CEBPD
eTOC Blurb
Glioblastoma (GBM) represents an aggressive brain malignancy with limited treatments. Shanley et al. engineer NK cells to express IL-21, which show superior safety and long-term anti-tumor activity compared to IL-15 NK cells. Key transcription factors like CEBPD drive this enhanced function, suggesting that IL-21 reprograms NK cells epigenetically, enhancing their therapeutic efficacy against GBM.
Graphical Abstract

INTRODUCTION
Glioblastoma (GBM) is the most common and aggressive primary brain tumor and presents a significant therapeutic challenge. Current treatments, including surgery, radiotherapy and chemotherapy 1, offer limited efficacy, with a median survival of only 18 to 21 months 2. Glioblastoma stem cell–like cells (GSCs) play a crucial role in tumor development and recurrence, and are resistant to conventional chemotherapy and radiotherapy 3. Natural killer (NK) cells have an innate ability to recognize and kill GSCs 4,5 and may therefore offer a promising immunotherapeutic strategy against this disease.
Cytokines can be used to further enhance the potency and in vivo persistence of NK cells against cancer. To date, IL-15 has been the primary focus of the translational and clinical work, as it promotes the cytotoxicity, proliferation and persistence of NK cells 6,7. Numerous preclinical studies and early clinical trials in patients with lymphoid malignancies support the overall safety and promising activity of systemically administered NK cells engineered to express IL-15 and a chimeric antigen receptor (CAR) 8–12. In addition, several studies have explored the safety and efficacy of locoregionally administered CAR T cells and NK cells in GBM 13–15. However, the safety and activity of locoregionally administered IL-15 NK cells in the context of GBM has not been explored. IL-21 is another attractive cytokine for cancer immunotherapy, and is known to induce metabolic reprogramming and mitochondrial biogenesis in T cells 16. IL-21 also promotes NK cell proliferation, maturation and metabolic fitness 17–19. Recombinant IL-21 was tested in several clinical trials of metastatic cancer, and despite its acceptable safety profile, its short half-life and the need for repeated dosing limited its clinical application 20,21.
Using multiple patient-derived GSCs and orthotopic in vivo models, we report that locoregionally administered IL-15 NK cells are highly toxic and ineffective at tumor control. In contrast, IL-21 NK cells administered similarly were safe and resulted in long-term anti-tumor activity. IL-21 NK cells exhibited distinct epigenetic and transcriptional signatures, with the CCAAT/Enhancer-Binding Proteins (C/EBP) family of transcription factors (TFs) emerging as critical regulators of IL-21 NK cell response against GBM. Deletion of CEBPD, the most differentially expressed member of the C/EBP TFs in IL-21 NK cells, impaired their potency and long-term anti-tumor response, while CEBPD overexpression in NK cells increased their functional capacity and metabolic fitness. Furthermore, we identified STAT1 and STAT3 as a key signaling pathway for CEBPD-mediated gene expression regulation.
These data identify CEBPD as an important transcriptional and epigenetic coordinator of NK cell responses to cancer, and support arming NK cells with IL-21 as a potential immunotherapeutic approach for GBM.
RESULTS
Cytokine-engineered NK cells show robust anti-GSC activity
Cytokine engineering has been used as a tool to improve the proliferation, persistence and cytotoxicity of T and NK cells against cancer 22. GSCs have tumor-regenerative potential with distinct transcriptional, epigenetic, and metabolic features 23. To determine the impact of cytokine-arming on NK cell responses against GSCs, we engineered cord blood (CB)-derived NK cells to express and autonomously release IL-15 or IL-21 (Figure 1A–C) and assessed their response against two different GSC lines. Non-transduced (NT) NK cells were used as controls. No significant difference in proliferation was observed among the three NK cell groups following ex vivo culture with K562-based feeder cells and IL-2 (Figure S1A). In contrast, both IL-15 and IL-21 NK cells exerted enhanced cytotoxicity against GSC20 and GSC8–11 compared to NT NK cells (Figure 1D, Figure S1B).
Figure 1. Cytokine arming improves NK cell anti-tumor activity against GSCs.

(A) Schematic representation of retroviral vectors used to transduce NK cells to secrete IL-15 or IL-21. (B) NK cell transduction efficiency determined by flow cytometry assessing human IgG1 expression (n=5–6 donors). Mean ± standard error of the mean (SEM); One-way ANOVA with Bonferoni correction. (C) IL-15 (n=3 donors) and IL-21 (n=6 donors) levels by ELISA from supernatants from non-transduced (NT), IL-15- or IL-21-transduced NK cells. Mean ± standard deviation (SD); One-way ANOVA with Bonferoni correction. (D) Percentage (%) of GSC20 killing (E:T=1:1) by NT, IL-15 or IL-21 NK cells as measured by real-time killing assay (n=9 donors); asterisks depict statistical significance for the comparisons. Blue asterisks: IL-15 vs NT NK; red asterisks: IL-21 vs NT NK. Mean ± SEM; Two-way ANOVA with Dunnet correction. (E, F) K562 killing by NT, IL-15 or IL-21 NK cells that were cultured either alone (E) or with GSC20 (F) at E:T=1:1. NK cells were then purified and their cytotoxicity against K562 was assessed (n=6 donors). Blue asterisks: IL-15 vs NT NK; red asterisks: IL-21 vs NT NK. Mean ± SEM; Two-way ANOVA with Dunnet correction. (G-I) Killing assay of GSC272 (G) and GSC20 (H) spheroids by NT, IL-15 or IL-21 NK cells (n=3 donors); asterisks depict statistical significance for the comparisons. Blue asterisks: IL-15 vs NT NK; red asterisks: IL-21 vs NT NK. Mean ± SEM; Two-way ANOVA with Dunnet correction. Images depict the red signal (spheroid growth) from live imaging of GSC272 killing assay (I).
ns=not significant, ***p ≤ 0.001.
We have previously shown that GSCs suppress NK cell function through multiple mechanisms5. To determine if arming NK cells with cytokines could prevent GSC-induced suppression, we first cultured NT and cytokine-transduced NK cells with or without GSC20 for 48 hours. NK cells were then purified and their cytotoxicity was tested against the NK-sensitive K562 line. Co-culture with GSC20 significantly impaired the cytotoxicity of NT NK cells against K562 cells, while IL-15 and IL-21 NK cells both retained their cytotoxic function (Figure 1E–F). Using a three-dimensional (3D) spheroid system and two GSC models, GSC20 and GSC272, we confirmed that cytokine-armed NK cells were more effective at killing GSCs than NT NK cells (Figure 1G–I; Video S1). These experiments demonstrated that NK cells expressing IL-15 or IL-21 kill GSC targets with greater potency and are more resistant to tumor-induced dysfunction than control NT NK cells.
IL-21 NK cells retain their cytotoxicity against multiple GSC rechallenges and display greater metabolic fitness
We next used mass cytometry to interrogate the single-cell proteomic profile of IL-15, IL-21 and NT NK cells cultured for 48 hours in the presence or absence of GSC20 (n=3 CB donors). We observed a number of clusters to be exclusive to IL-21 NK cells, that further expanded upon co-culture with GSCs (Figure 2A–C). These included clusters 4 and 10, characterized by higher expression of functional/cytotoxicity markers such as Perforin and CD95, and upregulation of markers related to activation and proliferation such as CD25, DNAM, Ki67, EOMES and T-bet. Cluster 14 was exclusive to IL-21 NK cells after co-culture with GSCs and had high levels of cytotoxicity markers as well as activation markers/receptors.
Figure 2. IL-21-armed NK cells exhibit long-term cytotoxicity against GSCs and have greater metabolic fitness.

(A-C) NK marker expression by mass cytometry for NT, IL-15 or IL-21 NK cells (n=3 donors) cultured either alone or in the presence of GSC20 for 48 hours. (A) tSNE plots showing the cluster distribution and fraction, where color scale and circle size represent expression and size of cluster for each group (B). (C) Comparative heatmap showing expression of NK cell markers at the cluster level. Color scale shows the expression level for each marker (red: higher expression; blue: lower expression). (D-G) NK cells and mCherry transduced GSCs (red) were co-cultured at E:T=1:1. Every 2–3 days, fresh GSCs were added to the co-cultures (each arrow represent each GSC rechallenge). Graphs showing red object count during live cell imaging after GSC20 (D-E), GSC272 (F) and GSC267 (G) rechallenge (n=3 donors). (E) Summary red object count after each GSC20 rechallenge from 2 separate experiments (n=6 donors). Asterisks represent statistical differences between groups. Black asterisks: IL-21 vs NT NK; red asterisks: IL-21 vs IL-15 NK. Mean ± SEM; Two-way ANOVA with Bonferroni correction. (H) Heatmap showing levels of cytokines in supernatants from co-cultures of NK cells with GSCs in the experiment presented in panel D (n=3 donors). Color scale shows cytokine levels (red: higher; blue: lower). (I, J) Polyfunctionality scores (I) and polyfunctionality strength index (J) of NT, IL-15 or IL-21 NK cells in response to GSC20 (n=4 donors). Mean ± SD; Two-way ANOVA with Bonferroni correction. (K) Representative measures of oxygen consumption rate (OCR) upon addition of oligomycin (Oligo), FCCP, and rotenone and antimycin A (R/A). Quantified basal respiration (L) and maximal respiration (M) of purified NK cells after co-culture with GSC20 (n=3 donors). Mean ± SEM; One-way ANOVA with Bonferroni correction. (N) Representative measures of extracellular acidification rate (ECAR) upon addition of glucose, Oligo, and 2-deoxy-D-glucose (2-DG) and quantified basal glycolysis (O) and glycolytic capacity (P) of purified NK cells after co-culture with GSC20 (n=3 donors). Mean ± SEM; One-way ANOVA with Bonferroni correction.
ns=not significant, *p ≤ 0.05, **p ≤ 0.01, ***p ≤ 0.001.
See also Figure S1.
We next evaluated the long-term cytotoxicity of IL-15 and IL-21 NK cells against multiple GSCs (GSC20, GSC272, GSC267, GSC8–11) by rechallenging them with mCherry transduced GSCs (red) every 2–3 days for at least five tumor rechallenges. Both IL-15 and IL-21 NK cells were equally effective during the initial 3 days of co-culture at eliminating GSCs at an effector:target ratio of 1:1 (Figure 2D–G; Figure S1C). However, unlike IL-21 NK cells, IL-15 NK cells rapidly lost their ability to respond to GSC rechallenges despite excellent viability (Figure S1D–E). Moreover, short-term priming of NT NK cells with exogenous human IL-21 (3 ng/ml) for 48 hours prior to co-culture with GSCs did not effectively control tumor growth (Figure S1F), supporting our strategy to genetically modify NK cells to continuously secrete IL-21 at stable levels as shown in Figure S1G. Deletion of the IL-21 receptor (IL21R) significantly impaired the cytotoxicity of IL-21 NK cells against GSCs (Figure S1H–M), providing further evidence for NK cell activation via autocrine IL-21 secretion and IL-21R signaling. The stable endogenous IL-21 expression allowed IL-21-transduced NK cells to maintain their ability to produce inflammatory cytokines (e.g., IFN-γ and TNF-α) and cytotoxicity molecules such as Granzyme B and Perforin throughout the various rechallenges (Figure 2H; Figure S1N–Q). In contrast, both NT and IL-15 NK cells lost their ability to secrete these critical effector cytokines over time. Moreover, NK cells expressing IL-21 produced substantially lower levels of cytokines and chemokines associated with neurotoxicity (e.g., IL-6, IL-1β, MCP-1), when compared to their IL-15 transduced counterparts (Figure 2H).
Polyfunctionality and metabolic fitness are important determinants of effective anti-tumor NK cell responses 24. Thus, we used the single-cell Isoplexis platform to measure cytokine secretion by IL-15, IL-21 and NT NK cells in response to GSC20 and observed that IL-21 NK cells were significantly more polyfunctional compared to IL-15 NK or NT NK cells (n=4 donors; Figure 2I–J; Figure S1R).
Arming NK cells with cytokines may also modulate their intrinsic metabolic fitness; thus, we next studied the mitochondrial metabolism and glycolytic potential of the different NK cell groups cultured for 48 hours with GSC20. IL-21 NK cells showed significantly higher basal and maximal oxygen consumption rate (OCR) compared to IL-15 NK cells (Figure 2K–M) with a reciprocal reduction in extracellular acidification rate (ECAR), a measure of glycolysis (Figure 2N–P), indicating that IL-21 NK cells produced ATP primarily by oxidative phosphorylation, a feature associated with long-term persistence and anti-tumor activity 25.
Finally, tumor rechallenge assays with other tumor cell lines such as OVCAR5 (ovarian cancer), WiDR (colorectal cancer), and PATC148 (pancreatic cancer) confirmed the superior cytotoxicity of IL-21 NK cells compared to IL-15 and NT NK cells (Figure S1S–U), indicating their broader efficacy beyond GBM to other solid tumors.
Differential toxicity and efficacy of IL-21 versus IL-15 NK cells in multiple PDX models of GBM
To compare the in vivo anti-tumor function of IL-21, IL-15 and NT NK cells, we used three orthotopic PDX mouse models of patient-derived GSCs as previously reported 5. Mice with established tumor received a single intratumoral (i.t.) injection of 0.1×10⁶ IL-15, IL-21 or NT NK cells. The best tumor control and survival were observed with mice treated with IL-21 NK cells, with a single i.t. administration of IL-21 NK cells resulting in long-term eradication of tumor in the GSC20 model and significant prolongation of survival in the GSC8–11 and GSC267 models, without any evidence of toxicity or weight loss (Figure 3A–D; Figure S2A–H).
Figure 3. In vivo anti-tumor activity of IL-21 NK cells.

(A) Schema showing the in vivo experiment. Bioluminescence imaging (BLI) was used to monitor the growth of intracranially (i.c.) injected FFluc-labeled GSC20 tumor cells in NSG mice treated intratumorally (i.t.) with 0.1×10⁶ NK cells (n=3–5 mice per group). (B) Individual (fine lines) and average (thick lines) BLI data. Unpaired t-test.(C) Kaplan-Meier analysis (n=3–5 mice per group). Animals treated with IL-21 NK cells had significantly better survival compared with GSC20 alone (p=0.0042), IL-15 NK cells (p=0.0027) or NT NK cells (p=0.0042); log-rank test. (D) Body weight change of mice over time in different groups described in panel C. Unpaired t-test. (E) Schema showing GSC20 in vivo rechallenge. (F) Flow cytometry showing NK cells in brain tissue (CD56+CD3−CD16+ cells) from IL-21 NK treated (n=4 mice) or tumor only control (n=5 mice) mice after GSC20 rechallenge. Horizontal line represents the Mean and error bar SD; Unpaired t-test. (G) Representative Immunohistochemistry (IHC) CD16 staining images of brain sections from two mice (#1 and #2) treated with IL-21 NK cells and rechallenged with GSC20 (left panels) or tumor only control (top right panel). Scale bar, 100 μm; tonsil was positive control. Arrows in G show CD16+ NK cells that had infiltrated the brain.
ns=not significant, *p ≤ 0.05, **p ≤ 0.01, ***p ≤ 0.001.
We next assessed the persistence of IL-21 NK cells using an in vivo GSC tumor rechallenge model. Mice that had previously been treated with IL-21 NK cells and had survived the initial GSC20 tumor challenge (n=4) underwent a second tumor inoculation of 0.25×10⁶ GSC20 tumor cells 400 days after the initial treatment (Figure 3E). This group was compared to a control group of naïve non-tumor bearing mice (n=5) also injected intracranially with 0.25×10⁶ GSC20 cells. All animals were sacrificed two weeks after the tumor challenge and necropsy was performed. Examination of brain tissue from the control group confirmed tumor presence (Figure S3A–B). In stark contrast, brains from the IL-21 NK cell rechallenge group showed a distinct infiltration of human CD45+ cells, all of which were CD56+CD3–CD16+ NK cells, with only minimal tumor detection (Figure 3F–G; Figure S3A–D). Furthermore, analysis by flow cytometry and IHC revealed no NK cell infiltration in secondary organs such as lungs, spleen, liver and bone marrow (Figure S3E–F), suggesting a potential brain-residency of these long-lived IL-21 NK cells.
Conversely, i.t. administration of 0.5×10⁶ IL-15 NK cells resulted in significant toxicity and suboptimal GSC20 tumor control, leading to early deaths in mice (Figure S4A–E). This was characterized by significant weight loss, heavy infiltration of activated NK cells as evidenced by Granzyme B staining, marked activation of microglia indicated by increased Iba1 staining and changes in cell morphology as previously defined 26, and considerable astrocytosis highlighted by glial fibrillary acidic protein (GFAP) staining (Figure S4A–E). A similar level of toxicity was observed both with a lower dose of IL-15 NK cells (0.1×10⁶) (Figure 3A–D; Figure S4F–I) and lower transduction efficiency of IL-15 (21.4% IL-15 transduction vs ~80% normal transduction) (Figure S5A–J). When compared to IL-21 NK cell treated mice, the IL-15 NK cell group had inferior tumor control efficacy, as evidenced by the presence of GSC20 luciferase+ cells in the brain sections by IF (Figure S5H). Notably, close proximity of NK cells to Ki67+microglia was observed in normal brain tissue adjacent to the tumor, but not within the tumor itself, suggesting a possible role for NK-microglia crosstalk in the proliferation of microglia and subsequent neuroinflammation (Figure S5I–J). The mechanism likely involves the interaction between human IL-15, secreted by our engineered NK cells, and the IL-15 receptor (IL-15R) on microglia, supported by the known cross-species interaction of human IL-15 with murine IL-15R 27 28. Immunofluorescence analysis revealed significant IL-15RA expression on microglia (Figure S6A–B), contrasting with minimal IL-21R expression in brain cells, including microglia. Transcriptomic analyses from publicly available single-cell RNA sequencing (scRNA-seq) datasets confirmed widespread IL15RA expression across various mouse brain cells, including astrocytes, oligodendrocytes, endothelial cells and neurons. In contrast, IL21R showed negligible or absent expression 29 (Figure S6C). The observed neurotoxicity and early mortality following i.t. administration of IL-15 NK cells were replicated in a different PDX model using GSC262 (Figure S6D–G). Furthermore, the comparison of i.t. vs. intravenous (i.v.) administration of IL-15 NK cells indicated that the i.v. route did not induce similar toxicity or significant tumor control (Figure S6D–E), likely due to minimal NK cell infiltration into the brain (Figure S6F–G). Serum analysis from mice that died of toxicity following treatment with i.t. IL-15 NK cells did not show markers of cytokine release syndrome (e.g., IL-6, IL-1β, MIP1-α, IFN-γ, TNF-α, and IL-10; Table S1, supporting localized toxicity effects of IL-15 in the brain rather than systemic inflammation. Similarly, i.v. administration of IL-21 NK cells was not toxic but also failed to control tumor growth, again likely attributed to limited NK cell trafficking to the brain (Figure S6H–I). Collectively, these data suggest that the anti-tumor efficacy of IL-21 NK cells and the toxicity of IL-15 NK cells are restricted to their localized effect within the brain when administered intratumorally.
Transcriptomic and epigenetic signatures of IL-21 and IL-15 NK cells
To elucidate the mechanisms underlying the persistence of IL-21 NK cells and their ability to mount a recall to tumor challenges in vitro and in vivo, we studied the epigenetic and transcriptomic changes in our cytokine-transduced NK cells in the short-term (after one GSC challenge; day 3) vs. longer term (after three GSC rechallenges; day 9). Control groups included IL-15 and IL-21 NK cells cultured without GSC exposure. Using single-cell ATAC sequencing (scATAC-seq), we mapped the epigenetic clustering of IL-15 and IL-21 NK cells. At baseline (prior to addition of GSCs), IL-21 and IL-15 NK cells had similar cluster distributions (Figure 4A–B). After a single GSC challenge (day 3), we observed contraction of some clusters (clusters 2, 4 and 7) and expansion of others (clusters 1 and 8) for both IL-15 and IL-21 NK cells. Notably, however, after 3 rechallenges (day 9 of GSC co-culture), distinct epigenetic patterns emerged with cluster 3 dominating the IL-15 NK cells, while cluster 6 was dominant in IL-21 NK cells (Figure 4A–B). Further analysis identified 7,117 differentially accessible peaks (DAPs) in cluster 6 vs. all other clusters, with enrichment of TFs important for NK cell maturation and immune effector function such as IRF1, TBX21 and EOMES, IRF9, STAT1 and STAT3 30–33, and members of the AP-1 complex TFs such as JUN, JUNB, JUND, FOS and FOSL134. Additionally, we observed enrichment in C/EBP family motifs, previously reported to play critical roles in cellular proliferation and differentiation; data on their role in NK cells are limited 35 (Figure 4C; Table S2). This enrichment was also observed when we analyzed the DAPs for the whole population of IL-21 relative to IL-15 NK cells after short-term co-culture with GSCs (day 3). Specifically, motifs including CEBPD, CEBPA, CEBPG and CEBPE, the AP-1 family complex and the RUNX1 TF, shown to promote the adaptive behavior of NK cells against viruses 36 (Figure 4D, left panel), were more prevalent. Notably, after multiple tumor rechallenges (day 9), several C/EBP family TFs were significantly more enriched in IL-21 NK cells compared to IL-15 NK cells, with CEBPD being the most significantly enriched (Figure 4D, right panel and Figure 4E).
Figure 4. Epigenetic and transcriptomic characterization of IL-21 vs. IL-15 NK cells after GSC co-culture.
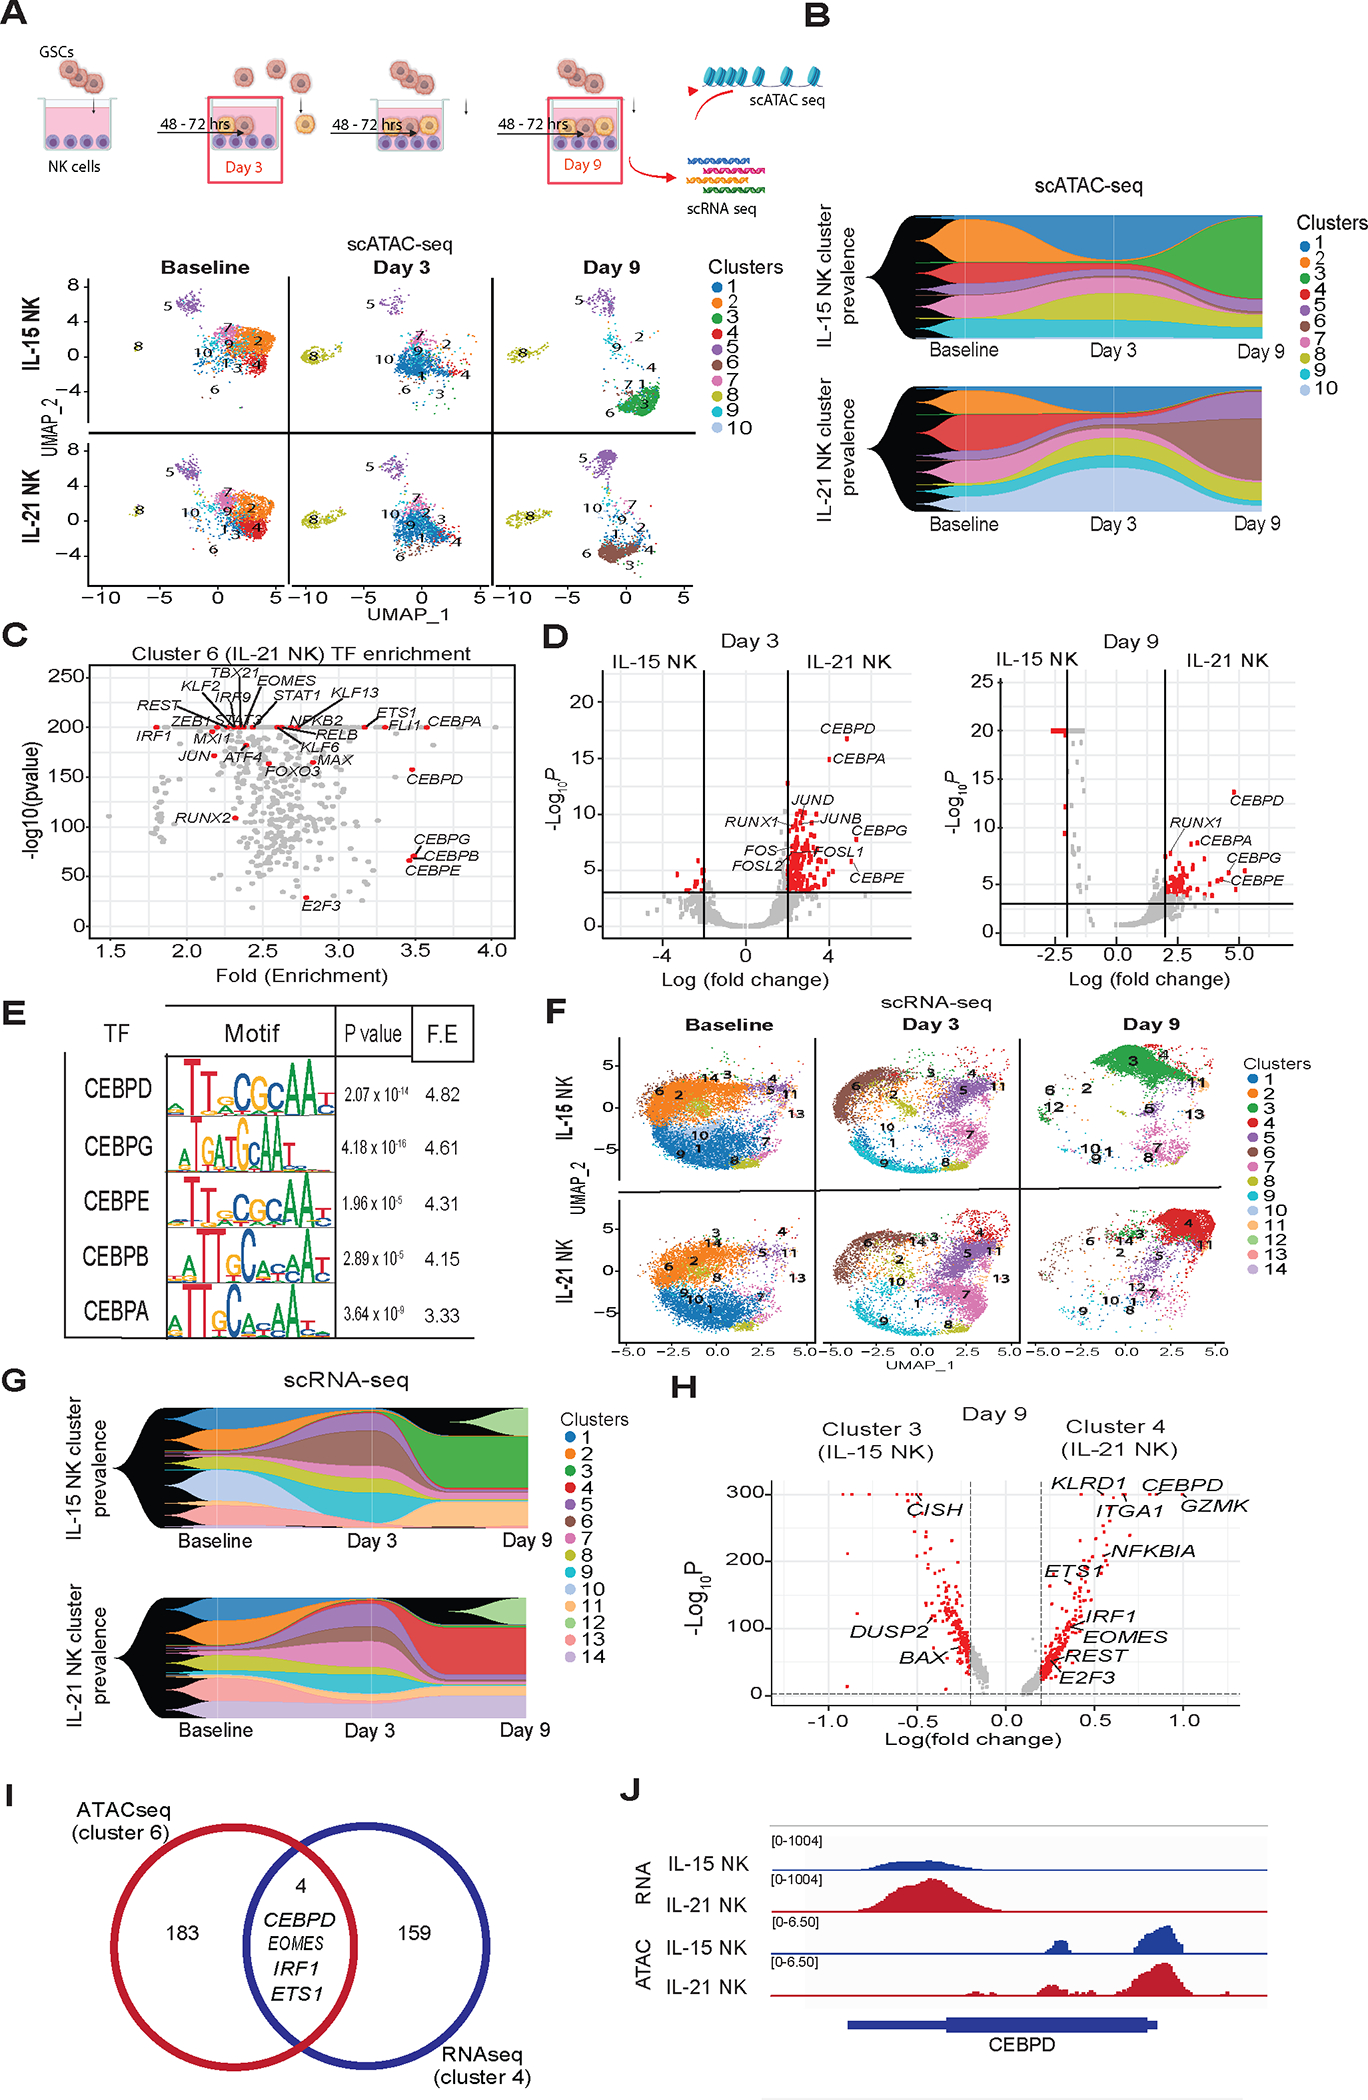
(A) UMAP plot of scATAC-seq data showing the cluster level epigenetic evolution of IL-15 NK (top) and IL-21 NK (bottom) cells over time from baseline (day 0) to days 3 and 9 following GSC rechallenge. (B) Fish plots showing the prevalence of scATAC-seq clusters in the NK cells over time. (C) Transcription factor (TF) enrichment of cluster 6 (mostly from day 9 IL-21 NK cells) specific peaks. (D) Volcano plots showing TF enrichment of IL-15 and IL-21 NK cell-specific peaks at day 3 (left) and day 9 (right) following co-culture with GSC20. Red dots represent TFs with motifs that were highly enriched in product-specific peaks. (E) IL-21 motif enrichment at day 9. C/EBP family motifs are among the top 20 most enriched. (F) UMAP plot of scRNA-seq data showing the transcriptomic clusters and their evolution over time in IL-15 NK (top) and IL-21 NK (bottom) cells at baseline (day 0) and at days 3 and 9 following co-culture with GSC20. (G) Fish plots showing the prevalence of clusters from scRNA-seq data of the NK cells over time. (H) Volcano plot showing genes with significant upregulation in IL-15 NK cell cluster 3 (left) and IL-21 NK cell cluster 4 (right) at day 9 after co-culture with GSC20. Red dots represent TFs with higher gene expression levels. (I) Venn diagram showing the DEGs in cluster 4 by scRNA-seq overlapping with the associated genes with a chromatin open region in cluster 6 by scATAC-seq; the two clusters are unique to IL-21 NK cells co-cultured with GSCs. (J) scATAC-seq and scRNA-seq profiling-derived genomic coverage plots showing chromatin accessibility peaks in the CEBPD coding region of NK cells after 9-day GSC co-culture.
scRNA-seq of IL-21 NK cells similarly revealed increasing divergence between IL-21 and IL-15 NK cells with repeated GSC rechallenges (Figure 4F). Differential gene expression analysis comparing the dominant cluster in IL-15 (cluster 3) vs IL-21 NK cells (cluster 4) (Figure 4F–G; Figure S7A) identified 176 genes upregulated in cluster 3 and 163 genes upregulated in cluster 4. A major feature of cluster 4 in the IL-21 NK cell product was upregulation of TFs previously identified in the scATAC-seq dataset such as CEBPD, ETS1, IRF1 and EOMES (Figure 4H–J). We also found genes important for T-cell memory and NK cell survival such as KLRD1, ITGA1 and GZMK 37–39. In contrast, cluster 3 (IL-15 NK cells) showed upregulation of genes related to suppression of anti-tumor immunity and cell exhaustion such as DUSP2 40, CISH 41 and BAX 42 (Figure 4H). In a sample level analysis, we found a significant upregulation of IKZF1 and IKZF3 transcription factors on IL-21 NK cells at baseline, day 3 and day 9 after tumor rechallenge compared to IL-15 NK cells. Importantly, IKZF1 and IKZF3 have been shown to modulate the AP-1 pathway43 (Figure S7B–E).
C/EBP regulates IL-21 NK cells at the transcriptional and epigenetic levels
To validate our TF findings by scATAC-seq, we utilized the pySCENIC pipeline to infer gene regulatory networks from our scRNA-seq data. We identified 146 differentially active regulons between IL-21 and IL-15 NK samples across all time points (Figure 5A). Notably, most of the TF motifs enriched in the DAPs in IL-21 NK vs IL-15 NK cells from our scATAC-seq data were also observed here (Figure 5B). CEBPD and CEBPB were identified among the top 50 differentially active regulons, supporting the potential importance of these TFs in the modulation of IL-21 NK cell activity at the transcriptomic and epigenetic levels.
Figure 5. Regulon activity in IL-21 and IL-15 NK cells after GSC co-culture.

(A) Venn diagram showing the overlapping regulons between IL-21 vs. IL15 NK cells at each time point. (B) Heatmap showing regulon activity in IL-21 and IL-15 NK cells at baseline (day 0) and days 3 and 9 following co-culture with GSCs. Color bar denotes scaled regulon activity score (AUC). (C, D) Violin plots showing the scaled gene-level chromatin accessibility of target genes of CEBPB (C; 85 genes) and CEBPD (D; 106 genes) inferred from gene expression profiles using pySCENIC. (E, F) Top enriched Hallmark pathways of target genes of CEBPB (E) and CEBPD (F) inferred from pySCENIC. (G) UMAP showing the distribution of clusters for each NK cell product based on scRNA-seq data from samples at different time points. Dashed line indicates cluster separation at day 9. (H) UMAP plot of the expression level of CEBPD across all cell populations. Color scale ranging from white to dark blue represents low to high expression levels. (I) UMAP plot showing the gene set score of CEBPD regulons at the transcriptomic level. Color scale ranging from blue to red represents low to high gene set score.
The gene level chromatin accessibility profiles of CEBPD (106 target genes including CEBPB) and CEBPB (85 targeted genes) were higher in IL-21 NK cells after rechallenge with GSCs when compared to IL-15 NK cells (Figure 5C–D). Among the pathways enriched for CEBPD and CEBPB regulons were TNF-α signaling via NF-ĸB, mTORC1 signaling and hypoxia, pathways previously known to be implicated in long-term persistence in T cells 44,45 (Figure 5E–F). Notably, cluster 4, which defined IL-21 NK cells at day 9 of GSC co-culture (Figure 5G), was enriched in CEBPD at the transcriptomic level (Figure 5H; Figure S7F) as well as in the target genes of the CEBPD regulon (Figure 5I; Figure S7G). These data validate the importance of CEBPD as a TF that regulates multiple downstream genes such as CEBPB, JUN, FOSL2, KLF2, ETS1, NFIL3 and BNIP3L34,35,46–49 and that could be implicated in the cell persistence and mitochondrial fitness phenotypes of IL-21 NK cells.
In addition, integrated analysis of bulk RNA-seq and ATAC-seq 50 from another set of 4 CB donors of NK cells engineered to express IL-15 or IL-21 revealed 1,146 DEGs and identified NK cell signaling as the top canonical pathway activated in IL-21 NK cells (Figure S8A). Further, analysis of TF motif activity revealed distinct regulatory network activity in IL-21 vs. IL-15 NK cells (Figure S8B). Specifically, the STAT1 gene network was upregulated in IL-21 NK cells and downregulated in IL-15 NK cells, while the MYC gene network was upregulated in IL-15 compared to IL-21 NK cells. The data also independently validated JUN as a top upstream regulator and CEBPD as a top target regulator activated in IL-21 but not in IL-15 NK cells.
Finally, we confirmed upregulation of CEBPD at the transcriptomic and proteomic levels in IL-21 NK cells after multiple GSC rechallenges, but not in NT NK cells or IL-15 NK cells (Figure S8C–E). This upregulation was also noted at the proteomic level in NK cells extracted from the brains of GSC-implanted mice treated with IL-21 NK cells but not with NT NK or IL-15 NK cells, reinforcing CEBPD’s potentially important role in mediating the strong anti-tumor activity of IL-21 NK cells in vivo (Figure S8F–G).
Taken together, these data support the role of CEBPD as a key TF mediating in the effector function of IL-21 NK cells against GBM.
CEBPD KO reverses the advantage conferred by IL-21
The C/EBPs consist of a family of six structurally homologous transcription factors known to regulate expression of genes involved in a variety of cellular processes, including cell division, differentiation, and death 51. In cancer, C/EBPs have been shown to serve both pro-oncogenic and co-suppressor roles 52. However, the specific role of C/EBPs on NK cell function at the molecular level is unclear 53. Our results identified CEBPD to be the most differentially enriched TF motif in IL-21 NK cells and a regulator of CEBPB. Thus, to assess the necessity of CEBPD in IL-21-mediated NK cell activity, we investigated the effects of its deletion in IL-21 NK cells and its overexpression in NT and IL-15 NK cells.
Genetic deletion of CEBPD reduced the in vitro proliferative capacity of IL-21 NK cells, without compromising their cell viability when compared with IL-21 Cas9 NK cell controls (Figure S9A–D). Notably, CEBPD KO IL-21 NK cells rapidly lost their cytotoxic and effector response to multiple in vitro GSC rechallenges and displayed significant impairment in their metabolic fitness compared to control IL-21 Cas9 NK cells (Figure 6A–D; Figure S9E–F). Transcriptomic analysis following CEBPD KO revealed downregulation of IFN signaling, JAK/STAT pathways and hypoxia response, with a reciprocal upregulation of MYC target genes (Figure S9G). In contrast, CEBPD overexpression (CEBPD OE) in NT NK cells with a vector encoding full-length CEBPD (Figure S9H–I) substantially increased their cytotoxic response to GSC rechallenge, associated with enhanced mitochondrial fitness and lower mitochondrial reactive oxygen species (ROS) compared to NT NK cells (Figure 6E–H; Figure S9J–K). RNA-seq analysis confirmed upregulation of the same previously shown pathways (Figure S9G) that were downregulated following CEBPD KO.
Figure 6. CEBPD is required for robust and long-lived anti-tumor activity and metabolic fitness of IL-21 NK cells.

NT, IL-21 Cas9 (control) and IL-21 CEBPD KO NK cells were co-cultured with mCherry transduced GSC20 (red) at E:T=1:1. Every 2–3 days, fresh GSC20 were added to the co-cultures (arrows) without adding new NK cells. Red signal was followed with real time imaging. (A) Graph showing real time killing analysis (n=4 donors) of NT, IL-21 Cas9 control and IL-21 CEBPD knockout (KO) NK cells. Mean ± SEM; Two-way ANOVA with Bonferroni correction. (B) Representative measures of oxygen consumption rate (OCR) upon addition of Oligo, FCCP, and rotenone and antimycin A (R/A). Quantified basal respiration (C) and maximal respiration (D) of purified NT, IL-21 and IL-21 CEBPD KO NK cells after 48 hours of co-culture with GSC20 (n=3 donors). Mean ± SEM; One-way ANOVA with Bonferroni correction. (E) NT, NT CEBPD OE (overexpression) and IL-21 NK cells were co-cultured with mCherry transduced GSC20 (red) at E:T=1:1. Every 2–3 days, fresh GSC20 were added to the co-cultures (arrows) without adding new NK cells. Graph showing real time killing analysis (n=4 donors) of NT, NT CEBPD OE and IL-21 NK cells. Mean ± SEM; Two-way ANOVA. (F) Representative measures of oxygen consumption rate (OCR) upon addition of Oligo, FCCP, and R/A. Quantified basal respiration (G) and maximal respiration (H) of purified NT, NT CEBPD OE and IL-21 NK cells after 48 hours of co-culture with GSC20 (n=4 donors). Mean ± SEM; One-way ANOVA with Bonferroni correction. (I) Schema of the in vivo experiment. Bioluminescence imaging (BLI) was used to monitor the growth of FFluc-labeled GSC272 tumor cells in NSG mice injected with GSC272 alone, or GSC272 plus NT, NT CEBPD OE, IL-21 Cas9 control or IL-21 CEBPD KO NK cells. (J) Average radiance (BLI) data for the denoted treatment conditions. Mean ± SEM; Two-way ANOVA for multiple comparisons between NK treated groups with Bonferroni correction. (K) Kaplan-Meier analysis (n=5 mice/group). Log-rank test. ns=not significant, *p ≤ 0.05, **p ≤ 0.01, ***p ≤ 0.001.
See also Figure S9.
Next, we validated our in vitro results in an orthotopic GBM model using GSC272. Mice were either left untreated, or treated intratumorally with NT NK cells, NT NK cells overexpressing CEBPD (NT CEBPD OE NK), IL-21 Cas9 NK cells, or IL-21 NK cells with CEBPD KO (IL-21 CEBPD KO NK) (Figure 6I–K). Due to the observed toxicity in previous studies, IL-15 NK cells were excluded from these in vivo experiments. As expected, strong anti-tumor activity was observed in mice treated with IL-21 NK cells. In contrast, mice treated with IL-21 CEBPD KO NK cells did not show significant improvement in survival compared to the tumor only control group. Furthermore, CEBPD OE in NT NK cells improved their anti-tumor activity and mouse survival compared to NT NK cells (Figure 6I–K). Together, these data indicate that arming NK cells with IL-21 induces stable epigenetic changes in NK cells, with CEBPD playing a critical role in establishing an enhanced and sustained anti-tumor response, especially in the context of GBM.
Induction of CEBPD target gene expression by STAT3 signaling in IL-21 NK cells
Previous studies, including our own findings, demonstrated that IL-21 induces a more pronounced activation of STAT3 compared to IL-15, which primarily activates STAT554 (Figure S10A). Activation of the JAK3/STAT3 pathway by IL-21 is important for transmitting signals related to cell growth and survival 55. Thus, we asked if IL-21 regulates CEBPD levels through STAT3. Deletion of STAT3 in IL-21 NK cells resulted in a significant reduction in CEBPD expression (Figure S10B, Figure 7A). IL-21 also induces STAT1 activation 56. Chromatin immunoprecipitation (ChIP)-qPCR confirmed the binding of both pSTAT3 and pSTAT1 to the CEBPD promoter in IL-21 NK cells (Figure 7B), corroborated by publicly available ChIP-seq data (Figure S10C,D). Collectively, these findings support the role of IL-21 as a potent inducer of CEBPD through activation of both STAT3 and STAT1 signaling pathways.
Figure 7. STAT3 as a mediator of CEBPD expression in IL-21 NK cells and CEBPD target gene validation.
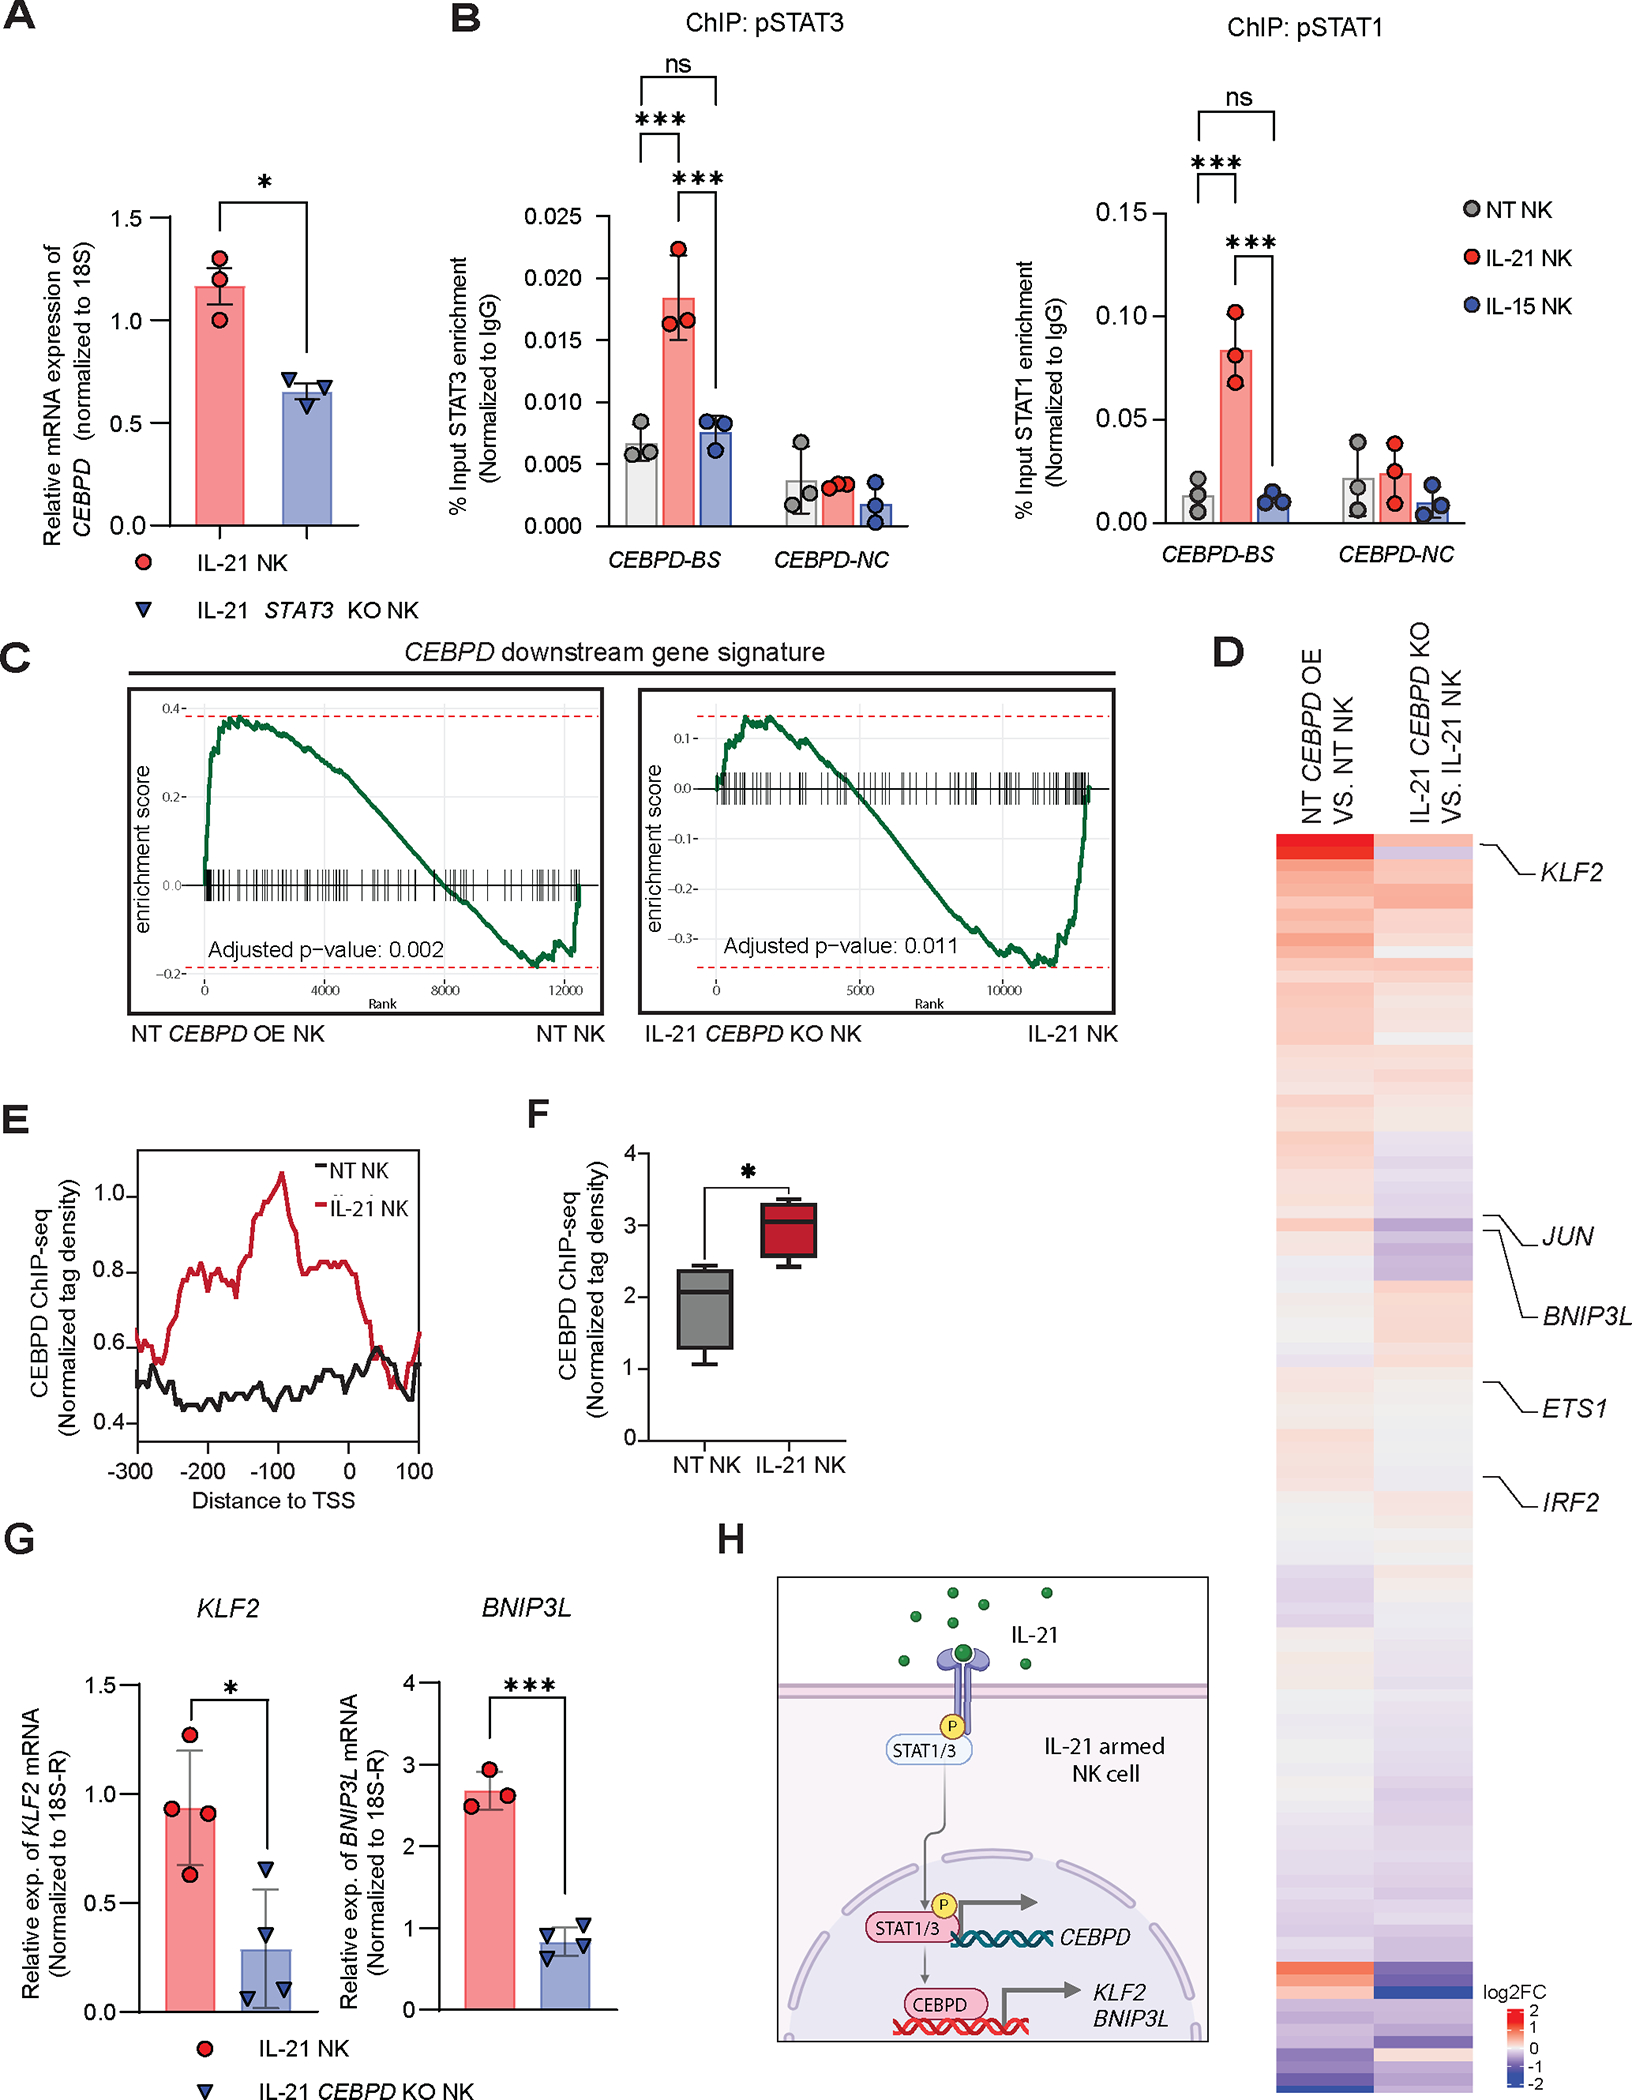
(A) Relative expression levels of CEBPD by qPCR in IL-21 Cas9 vs IL-21 STAT3 KO NK cells (n=3 donors). Mean ± SD; Unpaired t-test. (B) Chromatin immunoprecipitation (ChIP) of pSTAT3 and pSTAT1 followed by qPCR analysis of CEBPD (n=3 donors); CEBPD-BS (CEBPD-binding sites for STAT1/3 in the promoter region); CEBPD-NC (CEBPD-negative control containing no potential STAT1/3 binding sites. Mean ± SD; Two-way ANOVA with Bonferroni correction. (C) Barcode Enrichment Plot for CEBPD downstream genes; all genes from the dataset are ranked along x-axis according to enrichment score (y-axis), and the ranked position of each gene within a signature is shown in the x-axis. rank-based test employing a Kolmogorov–Smirnov-like statistic. (n=4 donors). (D) Heatmap showing the average log2 fold change in two comparisons (left: NT CEBPD OE vs NT; right: IL-21 CEBPD KO vs IL-21). Listed are genes in the CEBPD downstream signaling pathway which are hierarchically clustered (n=4 donors). (E) CEBPD occupancy of CEBPD-specific regulon gene targets (KLF2, BNIP3L, IRF1 and ETS1) in IL-21 vs NT NK cells (n=2 donors). Profile plots of CEBPD ChIP-seq normalized tags around promoter regions (−300, +100 bp) of transcription start sites (TSS). (F) Boxplot of CEBPD ChIP-seq normalized tag densities across gene target sites. Boxplot summarizes the minimum/maximum (whiskers), 25th/75th percentile (box), and the median (middle line) of values. Unpaired, two-tailed t-test between NT and IL-21 NK cells. (G) Relative expression levels of KLF2 (left) and BNIP3L (right) by qPCR in IL-21 Cas9 vs IL-21 CEBPD KO NK cells (n=4 donors). Mean ± SD; Unpaired t-test. (H) Schematic diagram depicting how IL-21 induces CEBPD which in turn regulates downstream target genes (e.g., KLF2 and BNIP3L) in NK cells.
ns=not significant, *p ≤ 0.05, **p ≤ 0.01, ***p ≤ 0.001.
See also Figure S10.
Next, to validate the target genes activated by CEBPD predicted by pySCENIC, we proceeded to analyze bulk RNA-seq data from IL-21 NK with deletion of CEBPD or NT-NK cells following overexpression of CEBPD. We confirmed that the predicted CEBPD downstream genes were indeed downregulated following CEBPD KO in IL-21 NK cells and upregulated following CEBPD OE in NT-NK cells, both at the signature level by gene set enrichment analysis (Figure 7C) and at the individual gene level (Figure 7D). ChIP-seq analysis of CEBPD revealed significant peak enrichment in the promoter regions of KLF2, BNIP3L, IRF1 and ETS1 in IL-21 NK compared with NT NK cells, supporting their downstream regulation by CEBPD (Figure 7E, F). Furthermore, qPCR analysis comparing IL-21 Cas9 NK cells with IL-21 CEBPD KO cells confirmed KLF2 and BNIP3L as CEBPD target genes (Figure 7G). Taken together, these data demonstrate that IL-21 increases expression of CEBPD most likely through pSTAT1 and pSTAT3, and that CEBPD in turn induces upregulation of its target genes including KLF2 and BNIP3L (Figure 7H). As KLF2 and BNIP3L are known to contribute to NK/T cell survival and metabolic fitness, the expression of these and other related CEBPD target genes likely contributes to the effective and sustained anti-tumor activity of IL-21 NK cells against GSCs 47,57,58.
DISCUSSION
In this study we showed that arming NK cells with IL-21 endows them with enhanced and long-lasting anti-tumor activity and metabolic fitness. Importantly, we identified the transcription factor CEBPD as an important mediator of this functional phenotype.
We also found that while IL-21-armored NK cells sustained their anti-tumor activity against GSCs over time, IL-15 NK cells were more prone to becoming exhausted after multiple tumor rechallenges. This is consistent with previous studies reporting that continuous exposure to higher doses of IL-15 (in the nanogram range) 59 but not lower doses (picogram range) 10,11 can drive NK cell exhaustion. Indeed, in this case, our IL-15-engineered NK cells released IL-15 in the nanogram range, which may explain their potent cytotoxicity in short-term cultures but their eventual exhaustion in long-term cultures. In addition, IL-15 NK cells demonstrated limited anti-tumor efficacy in vivo, and their direct injection into the orthotopically implanted tumor resulted in significant NK cell proliferation and neurotoxicity, associated with marked astrocytosis and microgliosis. These effects were observed in multiple murine models of GSCs, regardless of the dose of IL-15 NK cells administered or IL-15 expression levels used in our studies. In contrast, systemic delivery of IL-15 NK cells did not produce such neurotoxicity, in keeping with the established safety profile of IL-15-engineered CAR NK cells currently under clinical evaluation 10,12. These findings indicate that local effects of IL-15 in the brain microenvironment are principally responsible for the observed neurotoxicity. Notably, IL-15 is known to promote interactions between astrocytes and microglia, contributing to neuroinflammation by propagating cellular immunity in conditions such as intracranial hemorrhage 60,61. Our study highlights the critical need to consider the secondary effects of cytokines like IL-15 on non-target cells such as microglia, which may become activated due to IL-15’s pleiotropic effects. In contrast, IL-21 does not affect cells of the myeloid lineage 62 and may be less toxic for local administration into the brain. Indeed, using multiple orthotopic models of GSCs, we showed that IL-21 NK cells are safe and result in long-term tumor control.
Our study also explored the molecular evolution of cytokine-engineered NK cells in response to tumor rechallenge. While epigenetic and transcriptional changes associated with long-term NK cell responses against viruses have been described 63,64, little is known of the molecular mechanisms that regulate long-term NK cell responses to cancer. We observed significant and dramatic changes in the chromatin accessibility landscape of NK cells after tumor rechallenge. Notably, IL-21 NK cells showed significant upregulation of key TFs such as the AP-1 network, reported to play a key role in cellular persistence 34,64, and the C/EBP family of TFs, with CEBPD being the most prominent. CEBPD was pursued as a pivotal regulator of the IL-21 NK cell enhanced response through multiple lines of evidence: deletion of CEBPD significantly inhibited the long-term anti-tumor efficacy of IL-21 NK cells while its overexpression in wild-type NK cells improved their cytotoxicity and metabolic fitness. These effects were associated with moderate upregulation of IFN response genes and the STAT3/STAT5 pathways, suggesting that additional factors could also play a role in the enhanced IL-21 NK cell response. Fuch and colleagues showed that memory in an inflammatory state is driven by an obligatory cooperation between STAT3 and AP-1 complex members, FOS and JUN 34. STAT3, a known target of IL-21 65, has been implicated in regulating CEBPD expression 66. Our data supports a possible role for STAT3 in the regulation of CEBPD by IL-21 in NK cells.
Taken together, our findings suggest that IL-21 induces epigenetic reprogramming in NK cells, primarily through CEBPD, which is instrumental in driving their long-term cytotoxicity against tumor targets. These data support the development of IL-21-engineered NK cells as a potential immunotherapeutic approach for GBM.
STAR METHODS
Resource availability
Lead Contact
Further information and requests may be directed to and will be fulfilled by the Lead Contact Katayoun Rezvani (KRezvani@mdanderson.org).
Materials Availability
All requests for data and materials will be reviewed by MD Anderson Cancer Center to verify if the request is subject to any intellectual property of confidentiality obligations. Any data and materials can be shared by the corresponding author will be released freely or via a Material Transfer Agreement if deemed necessary.
Data and Code Availability
Single-cell RNA-seq, single-cell ATAC-seq, bulk RNA-seq, bulk ATAC-seq and ChIP-seq data used in the generation of Figures 4, 5 and 7, and Figures S8 and S9 are available through the Gene Expression Omnibus (https://www.ncbi.nlm.nih.gov/geo/) under accession GSE227098. Processed data and R scripts used for analyzing data and generating all manuscript figures are deposited on GitHub:https://github.com/KChen-lab/NK_CEBPD_manuscript.
Experimental Model and Study Participant Details
Study Approval
All tumor tissue that was used for the generation of glioblastoma stem cells was resected from patients who had signed written informed consents and samples were collected in accordance with the Institutional Review Board of The University of Texas MD Anderson Cancer Center in Houston, IRB Protocols LAB04–0001, LAB03–0687 and 2012–0441. All tissue samples were de-identified. Umbilical cord blood units for NK cells isolation were obtained from MD Anderson Cord Blood Bank. Umbilical cord blood was collected after informed consent from mothers at several hospitals. All studies were performed in accordance with the Declaration of Helsinki. All animal experiments were performed in accordance with recommendations in the Guide for the Care and Use of Laboratory Animals of the National Institute of Health and approved by the Institutional Animal Care and Use Committee (IACUC) protocol number 00001263-RN01 at MD Anderson Cancer Center in Houston.
Glioblastoma stem cells (GSC) and cancer cell lines
GSCs were obtained from primary human GBM samples. In summary, GBM tissue samples were minced and digested in RPMI media with 0.2 units/ml of Liberase™ (both from Millipore Sigma, Burlington, MA) at 37°C for 30 minutes. After multiple washes, pellets were cultured in Dulbecco’s Modified Eagle Medium: Nutrient Mixture F-12 (DMEM/F12) supplemented with 20 ng/ml of epidermal growth factor and basic fibroblast growth factor (all from Pepro Tech, Cranbury, NJ), B27 supplement (1:50; Invitrogen, Carlsbad, CA), 100 units of penicillin and 100 mg/ml streptomycin (Thermo Fisher Scientific) until neurospheres formed. The GSCs were passaged every 4–5 days. All GSC cell lines in this study were generated at MD Anderson Cancer Center.
The human cancer cell line WiDR was obtained from the American Type Culture Collection (ATCC, Manassas, VA); OVCAR-5 was obtained from Millipore Sigma; and PATC148 cells were kindly provided by Dr. Anirban Maitra (MDACC). Cells were cultured in DMEM media (Invitrogen) supplemented with 10% FBS, 1% penicillin-streptomycin, and 2 mM L-glutamine (Invitrogen).
NK cell expansion
NK cells were purified from umbilical cord blood (CB) using an NK cell isolation kit (Miltenyi Biotec, Inc., San Diego, CA). NK cells were stimulated on day 0 with irradiated (100 Gy) K562-based feeder cells engineered to express 4–1BB ligand and CD137 ligand (referred to as universal antigen-presenting cell [uAPC]) 67 at a 2:1 feeder cell:NK ratio and recombinant human IL-2 (Proleukin, 200 IU/ml; Chiron, Emeryville, CA), in complete CellGenix GMP SCGM Stem Cell Growth Medium (CellGenix GmbH, Freiburg, Germany). For IL-21 priming, NT NK cells were cultured for two days with 3 ng/ml of exogenous human IL-21 (PEPROTech, Cranbury, NJ).
Method Details
Retrovirus transfection and transduction
We used 293T cells68 which harbor SV40 large T-antigen for transient production of retroviral particles. Briefly, pEQ-PAM-3(-e) plasmid 69 carrying Moloney murine leukemia viral gag and pol structural and enzymatic genes, and pRD114 plasmid 70 for pseudo-typing with feline leukemia viral env protein, along with pSFG- human IL-15 or IL-21 which expresses the transgene of interest, were cotransfected with GeneJuice (EMD Millipore) into 293T cells. Retroviral supernatants were collected two days post-transfection without antibiotic selection and filtered to prevent cell or debris contamination. NK cells were transduced on day +5 in human fibronectin-coated plates (Clontech Laboratories, Inc., Mountain View, CA, USA). Non-transfected 293T or non-transduced (NT) NK cells were used as negative controls.
To generate NK cells overexpressing CEBPD (CEBPD OE), CEBPD cDNA was cloned into pSFG retroviral expression vector for retrovirus production.
Flow cytometry
CB-NK cells were stained using Live/Dead-aqua (Thermo Fisher Scientific, Waltham, MA), and anti-human CD56 (clone HCD56) from Biolegend (San Diego, CA). and anti-human CD3 (clone SK7) from BD Biosciences (Franklin Lakes, NJ). Anti-human IgG1 antibody (Jackson ImmunoResearch, West Grove, PA) was used to identify the transfection and transduction efficiency of 293T and NK cells, respectively. For cell viability, annexin V (ThermoFisher Scientific, Waltham, MA) and Live/Dead was used following manufacturer’s instructions. For CEBPD staining, cells were first stained with surface antibodies for 20 minutes, washed, fixed/permeabilized and stained with anti-human CEBPD antibody (clone C6, Santa Cruz Biotechnology, Dallas, TX) for 30 minutes at room temperature. For mouse tissue cell suspension, cells were blocked using human Fc receptor-blocking solution (BD Biosciences, San Jose, CA) for 10 minutes followed by surface staining with anti-human CD45 (clone HI30, Biolegend) anti-mouse CD45 (clone 30-F11, Biolegend), anti-human CD56, anti-human CD-16 (clone 3G-8, Biolegend) and anti-human CD3.
For pSTAT3 staining, NK cells were first stimulated with either 10 ng/ml of IL-15 or 20 ng/ml of IL-21 for 20 minutes in the dark. The cells were then washed with PBS and fixed for 10 minutes in the dark (Beckman Coulter PerFix EXPOSE Kit). Following fixation, cells were stained with Live/dead-aqua, CD56 (clone HCD56, Biolegend), BV605 and CD3-APC-H7 (clone SK7, BD Biosciences) for 20 minutes in the dark at RT. After another wash with PBS, cells were permeabilized using the Beckman Coulter kit, stained with p-STAT3 PE mAb (4/P-STAT3 Phosflow antibody (BD Biosciences) for 30 minutes at room temperature, washed and stored at 4°C until analyzed. Cell acquisition and analysis were performed using a BD LSR Fortessa instrument, and data analyzed using FlowJo sofware version 10.7.1.
Suppression assay
NK cells were co-cultured either alone or with GSCs at a 1:1 ratio for 48 hours at 37°C before performing the functional assays. After co-culture, NK cells were selected using human NK Cell Isolation Kit and human CD105 microbeads from Miltenyi Biotec, Inc. (San Diego, CA) following manufacturer’s instructions.
Real time NK cell cytotoxicity assay
NK cells were co-cultured at a 1:1 ratio with K562 or GSC targets labeled with CellTracker Deep Red Dye (ThermoFisher Scientific) or previously transduced with mCherry expressing retroviral vector. Apoptosis was detected using the CellEvent Caspase-3/7 Green Detection Reagent (ThermoFisher Scientific). For rechallenge assay, fresh GSCs previously transduced with mCherry were added to the plate every 2–3 days. Frames were captured over a period of 24 hours at one or two hour intervals from four separate 1.75 × 1.29 mm2 regions per well with a 10X objective using IncuCyte S3 live-cell analysis system (Sartorius, Goettingen, Germany). Values from all four regions of each well were pooled and averaged across all three replicates. Results were expressed graphically as percent cytotoxicity by calculating the ratio of red and green overlapping signals (counts per image) divided by the red signal (counts per image). The number of tumor cells (red signal) were plotted over time to follow tumor growth or elimination by NK cells (tumor cell index).
3D real time killing assay
Spheroids were generated by placing 10,000 GSC single cells in 100 μl CellGenix GMP SCGM Stem Cell Growth Medium (CellGenix) medium in a 96-well clear round bottom ultra-low attachment microplate (Corning, Glendale, AR). After 48 hours the spheroids were formed (confirmed by microscopy) and 20,000 NK cells were added to spheroid-containing well. Frames were captured with a 10X objective at two-hour intervals over a period of six days. Red signal (tumor) was quantified using IncuCyte S3 live-cell analysis system (Sartorius).
xCELLigence killing for tumor rechallenge assays
Tumor cells lines, including WiDR, OVCAR-5 and PATC148 were seeded onto 96-well RTCA E-plates (Agilent, Santa Clara, CA) and incubated for 24 hours to facilitate attachment and proliferation. NK cells were then added at 3:1 Effector-to-Target (E:T) ratios, while control wells contained only tumor cells in media. Fresh tumor cells were seeded onto new 96-well RTCA E-plates every 2–4 days to initiating subsequent killing assays, wich were monitored by xCELLigence instrument and RTCA immunotherapy module software. After 24 hours, NK cells from the preceding killing assay plates were transferred to the newly seeded tumors before each rechallenge for the different experimental conditions. Impedance measurements were monitored over the next 2–4 days before each rechallenge. Tumor growth was assessed and reported as a normalized cell index. Impedance measurements were conducted at 15-minute intervals over several days (with durations specified for each experiment) using the xCELLigence machine (Agilent). The results were presented as normalized cell index, adjusted to the cell index at the time of NK cell addition using the RTCA immunotherapy module software (Agilent).
Single cell secretome assay (Isoplexis)
IL-15-, IL-21- and NT-NK cells were labeled with a fluorescent dye (IsoPlexis stain cell membrane 405), co-cultured with GSC20 cells for 2 hours, and then purified using positive selection with CD56+ microbeads (Miltenyi Biotec, Waltham,MA). A total of 3×10⁴ NK cells were loaded onto individual Isocode chips according to the manufacturer’s protocol (Isoplexis, Branford, CT) and subjected to single cell 32-plex cytokine secretome profiling using a fully validated panel of cytokines on the IsoPlexis single-cell platform. The IsoSpeak software was used to quantify the number of polyfunctional NK cells by measuring the percentage of cells in each sample secreting multiple cytokines (2, 3, 4 or 5+), assigning the category of cytokines (effector, stimulatory, regulatory or chemoattractive) and measuring the polyfunctionality strength index (PSI) defined as the percentage of polyfunctional cells, multiplied by mean fluorescence intensity (MFI) of the proteins secreted by the NK cells.
ELISA and multiplex ELISA
IL-15 and IL-21 levels were measured in the supernatants of cytokine-transduced NK cells at five days after transduction using IL-15 or IL-21 ELISA kits from Invitrogen per the manufacturer’s instructions. For multiplex ELISA, supernatants from GSC and NK co-cultures were collected at different time points and cytokine and chemokine production was assessed using Milliplex Human Cytokine/Chemokine Magnetic Bead Premixed 41 Plex Kit (EMD Millipore Corporation, Burlington, MA). Samples were read using a Millipore MAGPIX instrument (EMD Millipore). Data acquisition was performed using the Luminex® xPONENT® software and analyzed with Belysa™ Analysis Software (EMD Millipore). Data was plotted using Morpheus, https://software.broadinstitute.org/morpheus.
Metabolic assays
The extracellular acidification rate (ECAR) was measured using the Glycolytic Stress Test, and oxygen consumption rate (OCR) was measured using the Mito Stress Test or the XF Substrate Oxidation Stress Test with an Agilent Seahorse XFe96 Analyzer (Agilent) per the manufacturer’s instructions. NK cells were assayed alone or purified after 48 hours co-culture with GSC20. Cells were plated in respective assay medias at 250,000 cells per well in a 96 well microplate. Data was analysed using Wave Software (Agilent).
Measurement of mitochondrial reactive oxygen species (ROS).
Cells were stained to identify reactive oxygen species (ROS) by NK cells using flow cytometry. For mitochondrial ROS staining, MitoSOX red (Cat #M36008, Life technologies, Grand Island, NY) was used following manufacturer’s protocol. Cells were analysed using a BD LSRFortessa instrument. Results were expressed as percentage of MitoSox positive NK cells.
Mass cytometry
Sample preparation, staining and acquisition
NK cells were cultured alone or co-cultured with GSC20 cells (1:1, E:T ratio) for 48 hours. Human Fc receptor blocking solution (Trustain FcX, Biolegend, San Diego, CA) was applied to NK cells after they had been washed with cell staining buffer (0.5% BSA/PBS) and incubated for 10 minutes at room temperature. Following that, cells were stained using an antibody mixture against cell markers. The strategy for antibody conjugation was previously described 9. Cells were recorded using the Helios 6.5.358 acquisition program on a Helios instrument (Fluidigm, San Francisco, CA) at a rate of 300 events per second (Fluidigm). Using the Fluidigm normalization software 2, mass cytometry data were adjusted based on EQTM four element signal shift over time 2. FlowJo version 10.7 was used to carry out the initial data quality inspection. Singlets were chosen based on iridium 193 staining and event duration, and calibration beads were gated out. The Pt195 channel eliminated dead cells, and further gating was done to choose CD45+ cells and subsequently the desired NK cell population (CD56+CD3−) For automatic clustering, a total of 320,000 cells were proportionately collected from each sample.
Data analysis
The mass cytometry data were merged using Principal Component Analysis (PCA), “RunPCA” function, from R package Seurat (v3). Dimensionality reduction was performed using the “RunUMAP” function from the R package Seurat (v3) with the top 20 principal components. The UMAP plots were generated using the R package ggplot2 (v3.2.1). Data were analyzed using automated dimension reduction including (viSNE) in combination with FlowSOM for clustering for the deep phenotyping of immune cells. We further delineated relevant cell clusters, using our in-house pipeline for cell clustering. For heatmap generation, CD45+CD56+CD3– gated FCS files were exported from FlowJo to R using function “read.FCS” from the R package flowCore (v3.10). The mean values of all markers were plotted as a heat map using the function “pheatmap” from R package pheatmap (v1.0.12). Markers with similar expression were hierarchically clustered.
Xenogeneic mouse model of GBM
We used a NOD/SCID IL-2R-null (NSG) and NU/J (nude) human xenograft model to examine the anti-tumor effect of cytokine-transduced NK cells against GSCs in vivo. (Jackson Laboratories, Bar Harbor, ME). A patient-derived GSC mouse model was used due to their superior invasiveness and migratory ability in contrast to conventional glioma cell lines when implanted intracranially 5. A total of 0.5×10⁶ patient-derived GSC20, GSC262, GSC267, GSC8–11 or GSC272 cells were implanted intracranially into the right frontal lobe of five week-old female NSG mice using a guide-screw system as previously described 5. For rechallenge experiments, 0.25×10⁶ GSC20 cells were implanted. Cells were injected into 10 animals simultaneously utilizing a multiport Microinfusion Syringe Pump to promote consistency of xenograft uptake and growth (Harvard Apparatus, Holliston, MA). During the surgery, xylazine/ketamine was used to anesthetize the animals. GSCs were modified to express luciferase by lentivirus transduction for in vivo bioluminescent imaging. Weekly bioluminescence imaging was used to track the kinetics of tumor progression (Xenogen-IVIS 200 Imaging system; Caliper, Waltham, MA). Using the Living Image software, the photon flux rate inside standardized areas of interest (ROI) was calculated to perform signal quantification in photons/second (p/s) (Caliper). At day 7 after tumor implantation, NK cells (0.5×10⁶ or 0.1×10⁶ NKs in 4 μl) were injected intratumorally via the guide-screw. Mice that presented neurological symptoms such as seizures, hydrocephalus, or ataxia or were moribund were euthanized. Brain and other tissues were then extracted and processed for analysis.
Histopathology
Brain tissue was collected from mice that had either received NT, IL-15, or IL-21 NK cells or animals that had not received any treatment. Brain tissue was fixed in 10% neutral buffered formalin before being embedded in paraffin. Tissues that had been formalin-fixed and embedded in paraffin were cut into 4 μm sections and routinely stained with hematoxylin and eosin. Brains were analyzed to see whether glioblastoma tumor cells, general gliosis, and NK infiltration were present. A board-certified veterinary pathologist examined sections free of tumor for signs of meningoencephalitis using a Leica DM 2500 light microscope. From each sample, one area of the brain was investigated. Using a Leica DFC495 camera and 10X magnification, representative images were obtained from comparable regions of the cerebral hemispheres.
Immunohistochemical staining
Formalin-fixed, paraffin embedded tissue was routinely sectioned at 4 μm and placed on glass slides. After deparaffinization, Granzyme B (human-specific, rabbit monoclonal antibody clone D6E9W, Cell Signaling Technologies) or CD16 (human-specific, rabbit polyclonal antibody, Thermo Fisher Scientific) was added to the tissue section to identify human NK cells. Anti-Ki-67 antibody (recombinant rabbit monoclonal antibody clone SP6, Abcam, Cambridge, UK) was used to identify proliferating GSC tumor cells in the brain sections. Anti-GFAP antibody (Dako, Santa Clara, CA) was used to identify astrocytes and anti-Iba1 for microglia. Twenty minutes of antigen retrieval in citrate buffer at 95°C was performed prior to staining. Primary antibody was diluted at 1:100 with an incubation time of 60 minutes. Hematoxylin was used to counterstain the nuclei and sections were routinely cover-slipped. Slides were examined using a Leica DM2500 microscope and images were captured at 4X, 10X, 20X and 40X with a Leica DMC6200 camera and Leica Application Suite (LAS) software. For multiplex immunofluorescence, different combinations of four to six antibodies were used: anti-Granzyme B, anti-Iba1 (clone EPR16589, Abcam), anti GFAP (Dako), anti- Cleaved Caspase-3 (BioCare Medical), anti-luciferase (Clone EPR17790, Abcam), anti-Ki-67, anti-IL-15RA and anti-IL-21R from Bioss Antibodies (Woburn, MA). DAPI was used to identify cell nuclei. Slides were scanned using Aperio AT2, image registration, and image fusion/merging using HALO v.3.6.
Mice brain tissue processing
Mononuclear cells were isolated from mice brain tissue using a percoll (GE Healthcare, Chicago, IL) gradient following the protocol previously described 5. Briefly, brain tissue was dissociated and passed through 70 μm cell strainer (Life Science, Durham, NC) to make homogenous cell suspension. A 70% isotonic percoll solution was put on top of a resuspended cell suspension in a 30% isotonic percoll solution, cells were centrifuged at 500 x g for 30 minutes at 18°C, with no brake. In a clean tube, 2–3 ml of the 70%–30% interface were collected and rinsed once with PBS. Cells were then immunostained as described above.
Single-cell ATAC sequencing
IL-15 and IL-21 transduced NK cells were co-cultured with GSC20 (1:1, E:T ratio). Every two to three days fresh GSCs were added to the co-culture. Cells were collected and cryopreserved at day 3 (1X GSC), and day 9 (3X GSC). NK cells cultured in the absence of GSCs were collected at day 0 and used as baseline control.
Cryopreserved cell suspensions were thawed in 37°C water bath, and viability was measured. The cells were treated with nuclei lysis buffer (10X Genomics, San Francisco, CA), nuclei were washed, resuspended in diluted nuclei buffer and counted for loading at a volume to recover 5000 to 10000 nuclei. Single-nucleus libraries were generated using the 10X Genomics Chromium Next GEM ATAC Capture and Library (V1.1), following the manufacturer’s protocol. Nine samples were pooled to give a final concentration of 10 nM. Pooled samples underwent further qPCR prior to sequencing with the NovaSeq 6000 sequencer using the S1, 100 cycles flow cell and sequenced with read 1 for 50 cycles, i7 8 cycles, i5 index 16 cycles, and read 2 for 49 cycles. Data available under accession number GSE227098.
Upstream analysis of scATAC-seq data
For each sample, the fragment and peak profiles were generated using the 10x Genomics CellRanger pipeline with default parameters. Chromosome, start, end, cell barcode, and PCR duplicate count are the five columns that make up fragment files, which are specified as coordinate-sorted, block gzip-compressed (bgzip), and indexed browser-extensible data files. The sites of the two Tn5 integration events that produced the sequenced DNA fragment are indicated by the start and end fields of the fragment file.
Downstream analysis of scATAC-seq data
The downstream analysis was done in R 4.0 applying Signac 71. Since peak calling was performed for each sample independently, we created a common set of peaks across all samples using the reduce function in Signac. The peaks with width <20 bp or >10,000 bp were removed. The fragment matrix for each sample was adjusted based on the common peak set using CreateFragmentObject function. The peak profile from multiple samples was combined into one unified matrix in which the peak coordinates are shared by each sample.
The QC step was performed by removing cells with fragments < 500 and features with cells < 500. To perform the dimension reduction, the RunTFIDF was performed on top peaks identified from FindTopFeatures function (min.cutoff=10). The RunSVD function was used to perform dimension reduction on peak assay (dimension was set to 30).
Joint clustering of single-cell ATAC peak profiles over 3 time points (baseline, day 3 and day 9) of 7,000–11,000 NK cells (Table S3) using the Signac pipeline led to the identification of 10 different NK cell clusters.
To identify differential peaks among samples/clusters, we performed the differential accessibility (DA) test using the FindMarkers function with minimum.pct being 5% and the number of fragments as the latent variable. To identify potentially important sample/cluster-specific regulatory sequences, we searched for DNA motifs (i.e.,TFs) that were overrepresented in a set of peaks that were differentially accessible between samples using the FindMotifs function. This generates the probability of observing the motif at the given frequency by chance, compared with a background set of peaks matched for GC content. A motif’s higher score indicates that its TF is much more abundant in the differential peaks. The EnhancedVolcano function was used to show the TF enrichment fold-change between two samples https://github.com/kevinblighe/enhancedvolcano.
To identify accessibility levels of CEBPD and CEBPB targets, the gene level accessibility for each cell was calculated by quantifying ATAC-seq counts in the 2 kb-upstream region and gene body, using the GeneActivity function in the Signac package.
Single-cell RNA sequencing
IL-15 or IL-21 NK cells were co-cultured with GSC20 (1:1, E:T ratio). Every two to three days fresh GSCs were added to the co-culture. Cells were collected and cryopreserved at day 3 (1X GSC), and day 9 (3X GSC). NK cells cultured in the absence of GSCs were collected at day 0 and used as baseline control.
Cryopreserved cell suspensions were thawed in 37°C water bath, and the viability of the samples was determined using Trypan Blue Stain (0.4%) with the Countess™ II FL. Cells were resuspended in phosphate buffered saline (PBS) with 0.4% bovine serum albumin (BSA) within the recommended range of 500–1000 cells/μl for loading at a volume to recover 7000 to 10,000 cells for single cell RNA-sequencing (scRNA-seq). Single cell capture, barcoding and library preparation were performed following the 10X Genomics Single Cell Chromium 3’ protocols (CG000183, V3.1). Ten libraries were pooled to give a final concentration of 10 nM. Pooled samples underwent further qPCR to determine the final concentration before submission for sequencing with the NovaSeq6000 sequencer using the S2 100 cycles flow cell and sequenced for 28 cycles for read1, 8 cycles for i7 index, and 91 cycles for read 2 through the ATGC (Advanced Technology Genomics Core) core at MD Anderson. Data available under accession number GSE227098.
The downstream analysis was done in R 4.0 applying Seurat software 71. The QC step was performed by removing cells with feature < 50 and features with cells < 100. The resulting single-cell dataset included 52,873 cells over the three time points for IL-21 vs IL-15 NK cells cultured with or without GSCs (Table S3). To perform the dimension reduction, the RunPCA was performed on the top 2,500 variable gene identified from FindTopFeatures function. The DEGs among samples/clusters were performed using the FindMarkers function with minimum.pct being 5% and the number of genes as the latent variable.
The CEBPD regulon score in gene expression level was calculated by averaging expression levels of 106 CEBPD target genes inferred from pySCENIC on single cell level using AddModuleScore function.
The gene enriched pathways of CEBPB and CEBPD target genes were identified using Enricher tool by searching MSigDB Hallmark database. Only enriched pathways with adjusted p value higher than 10−5 were kept.
For the scATAC and scRNA profiling-derived genomic coverage, bam alignment mapping files were retained from the cellranger count or cellranger-atac count pipeline that processes the scRNA or scATAC sequencing data, respectively. Cell barcodes of the filtered scRNA or scATAC samples were exported from the Seurat or Signac package in R, respectively. The bam files of these filtered cells were extracted and generated using sinto filterbarcodes of the sinto software (https://timoast.github.io/sinto/). The resulting bam files were converted into the bigwig format using the bamCoverage command of the deepTools software and visualized in IGV (Integrative Genomics Viewer).
Method describing the pySCENIC figures
In order to infer key TFs and gene regulatory networks from scRNA-seq data, we utilized the pySCENIC v0.11.2 (Single-Cell Regulatory Network Inference and Clustering) pipeline. Briefly, in the initial step, we used pySCENIC with the default parameters on the high-performance computing system to infer regulatory interactions between a previously defined list of TFs and candidate target genes using the gradient boosting machine regression GRNBoost2 algorithm, and Arboreto using co-expression patterns from scRNA-seq data. As a result, we obtained an adjacencies matrix that connects each TF with a target gene and an importance score which separates high confidence interactions from weak ones. Next, we generated candidate modules from these interactions, which are composed of a TF regulator and the list of its target genes. In order to separate the direct targets from indirect targets of a given regulator, these co-expression modules were refined by choosing target genes which have the DNA motif that is specific to a certain TF in their promoter region. This was achieved by cis-regulatory module scoring with RcisTarget to look for modules with cisTarget motif enrichment using pre-computed whole-genome rankings of all motifs that are linked to a known TF in the pySCENIC database. Through this analysis, normalized enrichment scores (NES) were calculated, which represent a quantitative measure for how much a particular motif is enriched. We only considered target genes with NES >4 for downstream analysis. Finally, we calculated the Area Under the Curve (AUC) scores that measure and quantify the relative biological activity of each regulon at a cellular level. With the pySCENIC analysis, we defined 456 regulons with their direct target genes exhibiting significant TF motif enrichment along with their AUC regulon activity scores. We overlayed these scores on the scRNA-seq data using Seurat 4.1.0 and identified differential regulons between IL-21 and IL-15 samples across different time points using the FindMarkers function in Seurat. We visualized differential regulons of interest using the DoHeatmap function on the scaled AUC matrix in order to make comparisons across samples.
Analysis of bulk RNA-seq
Gene expression was quantified from fastq files using RSEM (1.3.3), using the bowtie2 (2.4.2) aligner. The R package tximport was used to read in gene counts from RSEM output files. Data available under accession number GSE227098. Differential Gene Expression Analysis (DEG) was performed to compare NK cells independently NT, IL-15 or IL-21 NK cells, and in the presence (CEBPD OE) or absence (CEBPD KO) of CEBPD (n=4 donors) using two-way ANOVA fitted models, with either NT, IL-15 or IL-21 WT groups as the reference level 50. Differentially expressed genes (DEGs) were defined as genes with Log2 fold change < 0.3 or > 0.3 and p-value < 0.05. DEG was performed in R using OBIF package in R 50 version 1.0.
Enrichment Analysis was performed using the Ingenuity Pathway Analysis Software (QIAGEN Inc., https://www.qiagenbioinformatics.com/products/ingenuitypathway-analysis) by our QIAGEN IPA Certified Analyst (J.P.G.) with the core analysis function for expression values. Unsupervised Enrichment for Pathways, Diseases and Functions, Regulators, and Networks was performed to evaluate the IL-21 vs IL-15 wild-type (WT) response with significant enrichments defined as Z-score <−2 or >2 and false discovery rate (FDR) < 0.05. Expression values were overlayed from bulk RNA-seq differential analysis accordingly, and network analysis of regulators was trimmed using bulk and single-cell ATAC-seq accessible regions as a reference.
Differential Gene Expression Analysis (DEG) was performed separately in IL-21-transduced and Non-transduced NK cells adjusting for cord. CEBPD OE, CEBPD KO and NT NK cells were compared using NT NK cells as the reference level. Differential expressed genes (DEGs) were defined as genes with FDR-adjusted p-value < 0.05. DEG was performed in R using DESeq2 package in R version 4.1.1.
Pathway Enrichment Analysis (GSEA) was performed using pre-defined CEBPD downstream genes. GSEA was performed using the ranked wald test statistics for all genes in the DEG analysis with gsea function from the clusterProfiler package in R version 4.1.1.
Analysis of bulk ATAC-seq
ATAC-seq library preparation was performed at the MDACC Epigenomics Profiling Core following the protocol as previously described 12 with some modifications. Briefly, 50,000 nuclei isolated from IL-15, IL-21 and NT NK cells with and without CEBPD (CEBPD OE and KO, respectively) from 4 donors were tagmented and the resulting libraries were purified using SPRISelect beads (Beckman Coulter). Libraries were sequenced 2 × 100 bp on an Illumina NovaSeq6000 to obtain at least 50 million high quality mapping reads per sample. Data available under accession number GSE227098.
For each bulk ATAC-seq sample, the pair-end reads from fastq files were aligned to the human genome (GRCh38) using bwa mem mode with duplicated reads removed. The 5’ end of ATAC-seq reads were shifted to the actual cut-site of the Transposase using alignmentSieve module implemented in DeepTools The peaks were called using Macs2 with using the pair-end read information. The minimum FDR (q-value) cutoff for peak detection was set as 0.05. The Macs2 outputs from multiple samples were loaded using DiffBind. The peak sets from multiple samples were identified as the overlapping ones among samples using bUseSummarizeOverlaps function in DiffBind. We then calculated the TF activity level using the function RunChromVAR in Signac and identified differential TFs among different groups using function FindMarkers (with min.pct=0.5 and logfc.threshold=2).
Chromatin immunoprecipitation (ChIP) qPCR and ChIP sequencing (ChIP-seq)
Chromatin immunoprecipitation (ChIP) was performed at MD Anderson Cancer Center Epigenomic Profile Core. IL-15 NK, IL-21 NK and NT NK cells (n=2–3 donors) were cross-linked for 10 minutes with 1% formaldehyde at room temperature followed by addition of glycine (125 mM final concentration) to quench for 5 minutes 72. Chromatin was sonicated to an average size of 600 bp. Chromatin and associated proteins were immunoprecipitated using anti-CEBPD antibody (Santa Cruz Biotechnology) and IgG antibody. Input and CEBPD ChIP DNA libraries were prepared using NEBNext Ultra II DNA library prep kit (NEB). The ChIP-Seq libraries and the corresponding input libraries were sequenced using the 50 base single-read protocol on Illumina NextSeq 500 and HiSeq 3000 instrument.
For ChIP-quantitative Polymerase Chain Reaction (ChIP-qPCR), chromatin was immunoprecipitated using antibodies recognizing pSTAT1 (Tyr701) or pSTAT3 (Tyr705) (both from Cell Signaling Technology), or control rabbit immunoglobulin G (IgG) at 4°C for 12–16 hours. Quantitative real-time PCR assays were performed to detect the DNA region of interest. Primers used in the assay were as follows:
CEBPD Forward: 5′- CTCCAGGGCCTTCTCTTCTT −3′
CEBPD Reverse: 5′- GCCAAGTCCTGGTTTTGATT −3′
Negative control Forward: 5′- AGATCGTTCCATTGCACTCC −3’
Negative control Reverse: 5’- TTGAAACCAGCCTGGACAAT −3’
The DNA region of interest was detected by SYBR real-time quantitative PCR and enrichment relative to input were calculated.
Analysis of ChIP-seq
Sequencing adapters and low-quality bases were trimmed using Trimmomatic 0.38.
Cleaned reads were then aligned to the reference genome hg38 using bowtie2.
Peak signal was visualized using Integrative Genomics Viewer Version 2.16.1.
Peak and tag density profiles of CEBPD ChIP-seq
Combined tag directories per treatment conditions were created from aligned donor sample files (BAM) using HOMER 73 with makeTagDirectory function (-genome hg38 - checkGC). Using the annotatePeaks.pl function, annotated regions list for CEBPD-specific gene targets were made around their transcription start sites (TSS) (tss hg38 -list <gene list>) and normalized tag density profiles (per base per peak) was calculated around TSS all individual samples (<annotated region list> hg38 -size −300,100 −d <combined tag directories>). GraphPad’s Prism 10 software was used to create box plots that represent the sequenced normalized tag density of the CEBPD-specific gene targets, and peak profiles plots (5 bp bins) that represent their sequenced CEBPD occupancy from all donors. Genomic visualization of specific CEBPD-regulated gene targets in GRCh38 human genome was done using Integrative Genomics Viewer 74 (IGV 2.16.0) software from the sample BAM files.
qPCR
RNA was extracted from NK cells and thenm reverse transcription was performed using iscript cDNA Synthesis kit (Bio-Rad, Mylan, Italy). The relative expression of the genes of intereste was assessed using RT-qPCR using Applied Biosystems Fast SYBR green qPCR master mix (Thermo Scientific). Premade CEBPD, KLF2 and BNIP3L primers were purchased from IDT. The relative expression level was determined by compariasion with the housekeeping gene S18.
CRISPR gene editing
Pre-designed sgRNAs were used to target the CEBPD gene in NK cells. sgRNAs were ordered from SYNTHEGO (Gene Knockout Kit v2 - human - CEBPD - 1.5 nmol, Gene Knockout Kit v2-human-STAT3–1.5 nmol and Gene Knockout Kit -human-IL-21R-3 nmol) Cas9 was purchased from IDT in their proprietary Alt-R HiFi format [IDT cat # 1081061].
The following 3 sgRNAs were used for CEBPD:
sgRNA #1: GCCGUCCAGGCUGAAGAGCG
sgRNA #2: CCCGGUUCGUAGAAGGGCGC
sgRNA #3: CUCUCGUCGUCGUACAUGGC
STAT3:
sgRNA #1: AAUCUUGACUCUCAAUCCAA
sgRNA #2: AGCUGUCACUGUAGAGCUGA
sgRNA #3: AUUUUAGCAGGAUGGCCCAA
IL21R:
sgRNA #1: CAUGGAUGUAUUCCACUUCA
sgRNA #2: CCUGGGAGUAGUUGCCAGAC
sgRNA #3: CGUCCUUCAGCUCUUCAUAC
Combined sgRNAs from the kit were resuspended in nuclease-free TE buffer at a concentration of 100 μM. The sgRNAs were first diluted with nuclease-free water to a concentration of 30 μM. sgRNAs were combined with Cas 9 and T buffer (Neon Electroporation Kit, Invitrogen) at sgRNAs:Cas9 ratio of 3:1. The ribonucleoprotein (RNP) was incubated for 10 minutes at room temperature. T25 flasks were prepared during the incubation period. This required adding an appropriate volume of medium and Universal APCs (1:2, E:T ratio) supplemented with 200 IU/ml of IL-2 (for NK cells only) into each flask. The flasks were then placed in an incubator at 37° degrees Celsius until the time of electroporation. Effector cells were collected by centrifugation and washed twice with PBS in aliquots of 500,000 cells each. To prepare the cells for electroporation, the supernatant was as nearly removed as possible without disrupting the pellet and the cells were resuspended in Resuspension Buffer T. Each electroporation’s final concentration was 1.8 μM sgRNA, 0.62 μM Cas9 nuclease and 0.45 μM Cas9 electroporation enhancer. The cells were electroporated using Neon Transfection System at 1600 V, 10 ms pulse width and 3 pulses with 10 ul electroporation tips (Thermo Fisher Scientific, cat # MPK5000). After electroporation the cells were transferred into the prepared flasks and placed in the 37° C incubator. The knockout efficiency was evaluated by PCR followed by agarose gel electrophoresis using the following primers for CEBPD:
Forward: 5’- GACAGCCTCGCTTGGAC-3’
Reverse: 5’- CAAGCTCACCACGGTCTG-3’
STAT3:
Forward: 5’- GGGTGCCCCTTTATCTCCTG-3’
Reverse: 5’- GGGAGAAAGAAGCAGGGTCC-3’
IL21R:
Forward: 5’- GGATGCTGTAGGGGAGGTGA-3’
Reverse: 5’- AGCGCAACTCAAAACAGAACTC-3’
Quantification and Statistical Analysis
Statistical analyses were performed and plotted using Prism 9.2.0 software (GraphPad, San Diego, CA). The Student’s t-test was used to test for significance between 2 groups; one-way ANOVA was applied to determine the comparison among groups of a certain condition; two-way ANOVA was applied to determine the comparison among groups over a specific time. The Dunnett correction was used when comparing to a category of reference or control. Additionally, the Bonferroni correction was used to adjust for repeated measures. Mean values ± SEM. are shown. Overall survival (OS) analysis was calculated using Kaplan-Meier methods and compared to the treatment group using log-rank tests with 95% confidence intervals (CI). For barcode Enrichment Plot for CEBPD downstream genes, statistical significance was assessed using a rank-based testemploying a Kolmogorov–Smirnov-like statistic. Statistical significance of the enrichment score was determined through a permutation test based on phenotypic labels, generating a null distribution for comparison to ascertain the gene set’s dependency on these labels. Statistically significant p values <0.05 are reported as *p<0.05, **p<0.01 and ***p<0.001. The significance test used and sample sizes (n) are reported in each figure legend.
Supplementary Material
Video S1. Cytokine arming improves NK cell anti-tumor activity against GSCs, related to Figure 1. 3D killing assay of GSC272 spheroids by NT, IL-15 or IL-21 NK cells over 7 days. Images were acquired every 2 hours. Red signal reveals the growth of the GSC272 spheroids and green signal indicates apoptosis (Caspase 3/7). Scale bar= 600 μm.
Table S2. Transcription factor enrichment in cluster 6, related to Figure 4.
| REAGENT or RESOURCE | SOURCE | IDENTIFIER |
|---|---|---|
| Antibodies for flow | ||
| Alexa Fluor(R) 700 anti-mouse CD45 (30-F11) | BioLegend | Cat# 103128, RRID:AB_493715 |
| PerCP/Cyanine5.5 anti-human CD45 (HI30) | BioLegend | Cat# 982312, RRID:AB_2810821 |
| Brilliant Violet 605™ anti-human CD56 (NCAM) | BioLegend | Cat# 318333, RRID:AB_11142683 |
| Mouse Anti-Human CD3 Monoclonal Antibody, APC-H7 Conjugated | BD Biosciences | Cat# 560176, RRID:AB_1645475 |
| Brilliant Violet 650™ anti-human CD16 | BioLegend | Cat# 302042, RRID:AB_2563801 |
| AffiniPure F(ab’)2 Fragment Goat Anti-Mouse IgG, F(ab’)2 Fragment Specific (min X Hu,Bov,Hrs Sr Prot) | Jackson ImmunoResearch | Cat# 115–006–072, RRID:AB_2338473 |
| Mouse anti-human C/EBP delta (C-6) FITC | Santa Cruz Biotechnology | Cat# sc-365546FITC, RRID:AB_10842445 |
| BD Phosflow™ PE Mouse Anti-Stat3 (pY705) | BD Biosciences | Cat# 562072, RRID: AB_10893601 |
| Antibodies for IHC and multiplex IF | ||
| Granzyme B Monoclonal Antibody (D6E9W) | Cell Signaling | Cat# 46890, RRID: AB_2799313 |
| CD16 polyclonal Rabbit Antibody | Thermo Fisher Scientific | Cat# PA5–80622, RRID: AB_2787918 |
| GFAP polyclonal Rabbit Antibody | Dako | Cat# Z0334 |
| Recombinant Anti-Iba1 antibody (EPR16589) | Abcam | Cat# ab178847 RRID:AB_2832244 |
| Ki-67 Recombinant Rabbit Monoclonal Antibody (SP6) | Abcam | Cat# ab16667, RRID:AB_302459 |
| Recombinant Anti-Firefly Luciferase antibody (EPR17790) | Abcam | Cat# ab185924, RRID:AB_2938620 |
| Cleaved caspase-3 antibody | BioCare Medical | Cat # 40714 |
| Rabbit Anti-IL-15RA Polyclonal Antibody | Bioss | Cat# bs-2605R, RRID:AB_10855706 |
| Rabbit Anti-IL-21 R Polyclonal Antibody | Bioss | Cat# bs-2622R, RRID:AB_10855766 |
| Antibodies for Cytof | ||
| Anti-Human CD45 (HI30)-Y89 antibody | Fluidigm | 3089003B, RRID:AB_2661851 |
| Anti-Human CD57 (HCD57) - 115In antibody | Biolegend | Discontinued |
| EOMES Monoclonal Antibody (WD1928) | Thermo Fisher Scientific | 14–4877–82, RRID:AB_2572882 |
| ZAP70143Nd | Milteny Biotec | 130–095-212 |
| CD328 (Siglec-7) Antibody, anti-human, 144Nd | Milteny Biotec | Discontinued |
| CD62L Antibody, anti-human, pure, REAfinity™ 145Nd | Miltenyi Biotec | Cat# 130–122–326 RRID:AB_2819417 |
| CD8 Antibody, anti-human, pure, REAfinity™146Nd | Miltenyi Biotec | Cat#130–122–281 RRID:AB_2801862 |
| NKG2C 147Sm | Miltenyi Biotec | 130–122-278 |
| Mouse Anti-TRAIL Monoclonal Antibody, Unconjugated, Clone RIK-2 148Nd | BD Bioscience | Cat# 550515 RRID:AB_393718 |
| CD25 Antibody, anti-human, pure, REAfinity™, 149Sm | Miltenyi | Cat# 130–122–302, RRID:AB_2801883 |
| Purified anti-human CD69 (Maxpar(R) Ready) 150Nd | Biolegend | Cat# 310939 RRID:AB_2562827 |
| CD2 Antibody, anti-human, pure, REAfinity™ 151Eu | Milteny Biotec | Cat# 130–122–348 RRID:AB_2801924 |
| Purified anti-CD247 (TCRzeta, CD3zeta) 152Sm | Biolegend | Cat# 644102 RRID:AB_2072963 |
| TIGIT 154Sm | Thermo Fisher | 16–9500–82 |
| CD27 155Gd | Bd Bioscience | Custom Order |
| KLRG1 Monoclonal Antibody (13F12F2), Functional Grade 156Gd | Thermo Fisher | Cat#16–9488–85 RRID:AB_2637116 |
| CD94 Antibody, anti-human, pure, REAfinity™ 158Gd | Milteny Biotec | Cat#130–126–464 RRID:AB_2889638 |
| CD337 (NKp30) Antibody, anti-human, pure-functional grade 159Tb | Miltenyi Biotec | Cat#130–092–554 RRID:AB_10830867 |
| Purified anti-T-bet161Dy | Biolegend | Cat# 644802 RRID:AB_1595503 |
| NKP46162Dy | Fluidigm | 3162021B |
| CD336 (NKp44) Antibody, anti-human, pure, 163Dy | Milteny Biotec | Cat# 130–092–556 RRID:AB_615083 |
| CD95 (FAS) Antibody, anti-human, pure 164Dy | Milteny Biotec | Cat# 130–108–066 RRID:AB_2660559 |
| Rat Anti-Human Tim-3 Monoclonal antibody, Unconjugated, Clone 344823 165Ho | R&D Systems | Cat# MAB2365 RRID:AB_2232900 |
| Anti-NKG2D 166Er | Beckman Coulter | Custom Order |
| CD244 Monoclonal Antibody (eBioC1.7 (C1.7)) 167Er | Thermo Fisher | Cat#16–5838–85 RRID:AB_657715 |
| Purified anti-human Ki-67 168Er | Biolegend | Cat# 350502 RRID:AB_10662749 |
| NKG2A 169Tb | Fluidigm | 3169013B |
| Mouse Anti-CD226 Monoclonal Antibody, Unconjugated, Clone DX11-DNAM 170Er | BD Bioscience | Cat# 559787 RRID:AB_397328 |
| Purified anti-human Perforin 172Yb | Biolegend | Cat# 308102 RRID:AB_314700 |
| Granzyme B 173Yb | BD Bioscience | Custom Order |
| Granzyme A Antibody, anti-human, pure, REAfinity™ 174Yb | Milteny Biotec | Cat#130–108–054 RRID:AB_2651901 |
| CD223 Antibody, anti-human, pure, REAfinity™,LAG3 175Lu | Milteny Biotec | Cat# 130–124–529 RRID:AB_2819662 |
| Mouse Anti-CD56 Monoclonal Antibody, Unconjugated, Clone NCAM16.2 176Yb | BD Bioscience | Cat# 559043 RRID:AB_397180 |
| Anti-Human CD16 (3G8)-209Bi | Fluidigm | Cat# 3209002B RRID:AB_2756431 |
| Anti-Human CD3 194PT | Biolegend | Cat# 300402 RRID:AB_2661835 |
| Antibodies for ChIP seq and ChIP qPCR | ||
| Mouse anti-human C/EBP delta (C-6) | Santa Cruz Biotechnology | Cat# sc-365546, RRID:AB_10842445 |
| Rabbit Anti-Stat1, phospho (Tyr701) Monoclonal Antibody, Unconjugated, Clone 58D6 | Cell Signaling Technology | Cat# 9167, RRID:AB_561284 |
| Phospho-Stat3 (Tyr705) (D3A7) XP Rabbit mAb | Cell Signaling Technology | Cat# 9145 RRID:AB_2491009 |
| Bacterial and virus strains | ||
| Biological samples | ||
| Patient-derived glioblastoma stem cells (GSC) | ||
| GSC20 | Neurosurgery Department | MDA-GSC20 |
| GSC267 | Neurosurgery Department | MDA-GSC267 |
| GSC272 | Neurosurgery Department | MDA-GSC272 |
| GSC8–11 | Neurosurgery Department | MDA-GSC8–11 |
| GSC262 | Neurosurgery Department | MDA-GSC262 |
| Chemicals, peptides, and recombinant proteins | ||
| Human IL-21 | Peprotech | HZ-1319 |
| Human rhIL-2 | Proleuking | |
| Critical commercial assays | ||
| Milliplex Human Cytokine/Chemokine Magnetic Bead Premixed 41 Plex Kit | Millipore Sigma | HCYTMAG-60K-PX41 |
| Milliplex Human CD8+ T cell panel | Millipore Sigma | HCD8MAG15K17PMX, |
| Human IL-21 ELISA Kit | ThermoFisher Scientific | 88–8218–88 |
| Human IL-15 ELISA kit | ThermoFisher Scientific | 88–7620–88 |
| Human Granzyme B ELISA kit | ThermoFisher Ŝcientific | BMS2027–2 |
| Human Perforine ELISA kit | ThermoFisher Scientific | BMS2306 |
| Deposited data | ||
| Raw and analyzed data | This paper | GEO: GSE227098 |
| Experimental models: Cell lines | ||
| WiDR | ATCC | CCL-218 |
| PATC148 | MDA | MDA-PATC148 |
| OVCAR-5 | Millipore Sigma | SCC259 |
| Experimental models: Organisms/strains | ||
| Mouse: NOD.Cg-Prkdcscid Il2rgtm1Wjl/SzJ | The Jackson Laboratory | RRID:IMSR_JAX:005557 |
| Mouse: NU/J | The Jackson Laboratory | RRID:IMSR_JAX:002019 |
| Oligonucleotides | ||
| siRNA targeting CEBPD sequence: | SYNTHEGO | Gene Knockout Kit v2 - human - CEBPD |
| sgRNA #1: GCCGUCCAGGCUGAAGAGCG | ||
| sgRNA #2: CCCGGUUCGUAGAAGGGCGC | ||
| sgRNA #3: CUCUCGUCGUCGUACAUGGC | ||
| siRNA targeting STAT3 sequence: | SYNTHEGO | Gene Knockout Kit v2-human-STAT3 |
| sgRNA #1: AAUCUUGACUCUCAAUCCAA | ||
| sgRNA #2: AGCUGUCACUGUAGAGCUGA | ||
| sgRNA #3: AUUUUAGCAGGAUGGCCCAA | ||
| siRNA targeting IL-21R sequence: | SYNTHEGO | Gene Knockout Kit - human - IL21R |
| sgRNA #1: CAUGGAUGUAUUCCACUUCA | ||
| sgRNA #2: CCUGGGAGUAGUUGCCAGAC | ||
| sgRNA #3: CGUCCUUCAGCUCUUCAUAC | ||
| Primers for CEBPD KO efficiency: | IDT | |
| Forward: 5’- GACAGCCTCGCTTGGAC-3’ | ||
| Reverse: 5’- CAAGCTCACCACGGTCTG-3’ | ||
| Primers for STAT3 KO efficiency: | IDT | |
| Forward: 5’- GGGTGCCCCTTTATCTCCTG-3’ | ||
| Reverse: 5’- GGGAGAAAGAAGCAGGGTCC-3’ | ||
| Primers for IL-21R KO efficiency: | IDT | |
| Forward: 5’- GGATGCTGTAGGGGAGGTGA-3’ | ||
| Reverse: 5’- AGCGCAACTCAAAACAGAACTC-3’ | ||
| Primer for Chip qPCR (CEBPD promotor region: CEBPD Forward: 5’- CTCCAGGGCCTTCTCTTCTT -3’ | ||
| Reverse: 5’- GCCAAGTCCTGGTTTTGATT -3’ | ||
| Primer for Chip qPCR (Negative control Forward: 5’- AGATCGTTCCATTGCACTCC -3’ | ||
| Reverse: 5’- TTGAAACCAGCCTGGACAAT -3’ | ||
| Software and algorithms | ||
| IsoSpeak Sofware | https://isoplexis.com/solutions/isospeak-immune-polyfunctional-strength/ | |
| Belysa™ | Sigma Aldrich | https://www.sigmaaldrich.com/US/en/services/software-and-digital-platforms/belysa-immunoassay-curve-fitting-software |
| xPONENT ® Sofware | Thermofisher | https://www.thermofisher.com/us/en/home/life-science/antibodies/immunoassays/procartaplex-assays-luminex/luminex-instruments.html |
| pySCENIC v0.11.2 | https://scenic.aertslab.org | |
| Ingenuity Pathway Analysis Software | https://www.qiagenbioinformatics.com/products/ingenuitypathway-analysis) | |
| Sinto software | (https://timoast.github.io/sinto/). | |
| Cluster Profiler Packege in R 4.1.1 | ||
| FlowJo version 10.7.1 | Flowjo | https://www.flowjo.com/ |
| Morpheus | https://software.broadinstitute.org/morpheus | |
| Wave Software | Agilent | https://www.agilent.com/en/products/cell-analysis/software-download-for-wave-desktop |
| Living Image software | Perkinelmer | https://www.perkinelmer.com/product/spectrum-200-living-image-v4series-1–128113 |
| Leica Application Suite (LAS) software | Leica | https://www.leica-microsystems.com/products/microscope-software/p/leica-las-x-ls/ |
| Seurat software | Stuart et al | |
| R 4.0 | https://www.r-project.org/ | |
| Biorender | https://www.biorender.com/ | |
| Prism 9.24.0 Software | GraphPad | https://www.graphpad.com/features |
| Data and Code Availability | ||
| Codes used for figures | This paper | https://github.com/KChen-lab/NK_CEBPD_manuscript |
Highlights.
IL-21 NK cells show superior safety and anti-tumor activity vs. IL-15 NK cells
IL-21 NK cells have a distinct epigenetic profile driven by C/EBP, mainly CEBPD
CEBPD is a key mediator of IL-21 NK cell response against glioblastoma stem cells
IL-21 engineered NK cells present a promising therapeutic strategy for glioblastoma
ACKNOWLEDGEMENTS
This work was supported in part by the generous support of Ann and Clarence Cazalot, The Sally Cooper Murray endowment, the generous philanthropic contributions to The University of Texas MD Anderson Cancer Center Glioblastoma Moon Shots Program, by grants (U01CA247760) from the National Institutes of Health (NIH), by the Specialized Program of Research Excellence (SPORE) in Brain Cancer grant (P50CA127001); and CPRIT Single Core (RP180684). The MD Anderson Cancer Center Advanced Technology Genomics Core (ATGC) Facility that assisted with the CyTOF studies was supported in part by The University of Texas MD Anderson Cancer Centers and by grants CA016672, 1S10OD024977-01 from the NIH. We thank the MD Anderson Cancer Center Epigenomics Profiling Core for assistance with the ChIP assays. We gratefully acknowledge and posthumously thank Judy S. Moyes for her editorial assistance.
Footnotes
DECLARATION OF INTEREST
MS, MD, RB, HR, SA, YL, NU, EL, EJS, KR and The University of Texas MD Anderson Cancer Center have an institutional financial conflict of interest with Takeda Pharmaceutical. RB, EJS, KR, and The University of Texas MD Anderson Cancer Center have an institutional financial conflict of interest with Affimed GmbH. K.R. participates on the Scientific Advisory Board for Avenge Bio, Virogin Biotech, Navan Technologies, Caribou Biosciences, Bit Bio Limited, Replay Holdings, oNKo Innate, and The Alliance for Cancer Gene Therapy ACGT. KR is the Scientific founder of Syena. EJS has served on the Scientific Advisory Board for Adaptimmune, Axio, Celaid, FibroBiologics, Navan Technologies, New York Blood Center and Novartis. The remaining authors declare no competing financial interests. MD participates on the Scientific Advisory Board for Cellsbin. MS, HS, EJS and KR have filed for a patent (20230074303); “Cell immunotherapy for the treatment of cancer”.
Publisher's Disclaimer: This is a PDF file of an unedited manuscript that has been accepted for publication. As a service to our customers we are providing this early version of the manuscript. The manuscript will undergo copyediting, typesetting, and review of the resulting proof before it is published in its final form. Please note that during the production process errors may be discovered which could affect the content, and all legal disclaimers that apply to the journal pertain.
REFERENCES
- 1.Lim M, Xia Y, Bettegowda C, and Weller M (2018). Current state of immunotherapy for glioblastoma. Nat Rev Clin Oncol 15, 422–442. 10.1038/s41571-018-0003-5. [DOI] [PubMed] [Google Scholar]
- 2.McCutcheon IE, and Preul MC (2021). Historical Perspective on Surgery and Survival with Glioblastoma: How Far Have We Come? World Neurosurg 149, 148–168. 10.1016/j.wneu.2021.02.047. [DOI] [PubMed] [Google Scholar]
- 3.Lathia JD, Mack SC, Mulkearns-Hubert EE, Valentim CL, and Rich JN (2015). Cancer stem cells in glioblastoma. Genes Dev 29, 1203–1217. 10.1101/gad.261982.115. [DOI] [PMC free article] [PubMed] [Google Scholar]
- 4.Gras Navarro A, Bjorklund AT, and Chekenya M (2015). Therapeutic potential and challenges of natural killer cells in treatment of solid tumors. Front Immunol 6, 202. 10.3389/fimmu.2015.00202. [DOI] [PMC free article] [PubMed] [Google Scholar]
- 5.Shaim H, Shanley M, Basar R, Daher M, Gumin J, Zamler DB, Uprety N, Wang F, Huang Y, Gabrusiewicz K, et al. (2021). Targeting the alphav integrin/TGF-beta axis improves natural killer cell function against glioblastoma stem cells. J Clin Invest 131. 10.1172/JCI142116. [DOI] [PMC free article] [PubMed] [Google Scholar]
- 6.Huntington ND, Puthalakath H, Gunn P, Naik E, Michalak EM, Smyth MJ, Tabarias H, Degli-Esposti MA, Dewson G, Willis SN, et al. (2007). Interleukin 15–mediated survival of natural killer cells is determined by interactions among Bim, Noxa and Mcl-1. Nature Immunology 8, 856–863. 10.1038/ni1487. [DOI] [PMC free article] [PubMed] [Google Scholar]
- 7.Ma S, Caligiuri MA, and Yu J (2022). Harnessing IL-15 signaling to potentiate NK cell-mediated cancer immunotherapy. Trends Immunol 43, 833–847. 10.1016/j.it.2022.08.004. [DOI] [PMC free article] [PubMed] [Google Scholar]
- 8.Imamura M, Shook D, Kamiya T, Shimasaki N, Chai SM, Coustan-Smith E, Imai C, and Campana D (2014). Autonomous growth and increased cytotoxicity of natural killer cells expressing membrane-bound interleukin-15. Blood 124, 1081–1088. 10.1182/blood-2014-02-556837. [DOI] [PubMed] [Google Scholar]
- 9.Li Y, Basar R, Wang G, Liu E, Moyes JS, Li L, Kerbauy LN, Uprety N, Fathi M, Rezvan A, et al. (2022). KIR-based inhibitory CARs overcome CAR-NK cell trogocytosis-mediated fratricide and tumor escape. Nature Medicine 28, 2133–2144. 10.1038/s41591-022-02003-x. [DOI] [PMC free article] [PubMed] [Google Scholar]
- 10.Liu E, Marin D, Banerjee P, Macapinlac HA, Thompson P, Basar R, Nassif Kerbauy L, Overman B, Thall P, Kaplan M, et al. (2020). Use of CAR-Transduced Natural Killer Cells in CD19-Positive Lymphoid Tumors. N Engl J Med 382, 545–553. 10.1056/NEJMoa1910607. [DOI] [PMC free article] [PubMed] [Google Scholar]
- 11.Liu E, Tong Y, Dotti G, Shaim H, Savoldo B, Mukherjee M, Orange J, Wan X, Lu X, Reynolds A, et al. (2017). Cord blood NK cells engineered to express IL-15 and a CD19-targeted CAR show long-term persistence and potent antitumor activity. Leukemia. 10.1038/leu.2017.226. [DOI] [PMC free article] [PubMed] [Google Scholar]
- 12.Marin D, Li Y, Basar R, Rafei H, Daher M, Dou J, Mohanty V, Dede M, Nieto Y, Uprety N, et al. (2024). Safety, efficacy and determinants of response of allogeneic CD19-specific CAR-NK cells in CD19+ B cell tumors: a phase 1/2 trial. Nature Medicine. 10.1038/s41591-023-02785-8. [DOI] [PMC free article] [PubMed] [Google Scholar]
- 13.Brown CE, Alizadeh D, Starr R, Weng L, Wagner JR, Naranjo A, Ostberg JR, Blanchard MS, Kilpatrick J, Simpson J, et al. (2016). Regression of Glioblastoma after Chimeric Antigen Receptor T-Cell Therapy. N Engl J Med 375, 2561–2569. 10.1056/NEJMoa1610497. [DOI] [PMC free article] [PubMed] [Google Scholar]
- 14.Brown CE, Badie B, Barish ME, Weng L, Ostberg JR, Chang WC, Naranjo A, Starr R, Wagner J, Wright C, et al. (2015). Bioactivity and Safety of IL13Rα2-Redirected Chimeric Antigen Receptor CD8+ T Cells in Patients with Recurrent Glioblastoma. Clin Cancer Res 21, 4062–4072. 10.1158/1078-0432.Ccr-15-0428. [DOI] [PMC free article] [PubMed] [Google Scholar]
- 15.Burger MC, Forster M-T, Romanski A, Straßheimer F, Macas J, Zeiner PS, Steidl E, Herkt S, Weber KJ, Schupp J, et al. (2023). Intracranial injection of natural killer cells engineered with a HER2-targeted chimeric antigen receptor in patients with recurrent glioblastoma. Neuro-Oncology 25, 2058–2071. 10.1093/neuonc/noad087. [DOI] [PMC free article] [PubMed] [Google Scholar]
- 16.Loschinski R, Bottcher M, Stoll A, Bruns H, Mackensen A, and Mougiakakos D (2018). IL-21 modulates memory and exhaustion phenotype of T-cells in a fatty acid oxidation-dependent manner. Oncotarget 9, 13125–13138. 10.18632/oncotarget.24442. [DOI] [PMC free article] [PubMed] [Google Scholar]
- 17.Heinze A, Grebe B, Bremm M, Huenecke S, Munir TA, Graafen L, Frueh JT, Merker M, Rettinger E, Soerensen J, et al. (2019). The Synergistic Use of IL-15 and IL-21 for the Generation of NK Cells From CD3/CD19-Depleted Grafts Improves Their ex vivo Expansion and Cytotoxic Potential Against Neuroblastoma: Perspective for Optimized Immunotherapy Post Haploidentical Stem Cell Transplantation. Front Immunol 10, 2816. 10.3389/fimmu.2019.02816. [DOI] [PMC free article] [PubMed] [Google Scholar]
- 18.Ojo EO, Sharma AA, Liu R, Moreton S, Checkley-Luttge MA, Gupta K, Lee G, Lee DA, Otegbeye F, Sekaly RP, et al. (2019). Membrane bound IL-21 based NK cell feeder cells drive robust expansion and metabolic activation of NK cells. Sci Rep 9, 14916. 10.1038/s41598-019-51287-6. [DOI] [PMC free article] [PubMed] [Google Scholar]
- 19.Parrish-Novak J, Dillon SR, Nelson A, Hammond A, Sprecher C, Gross JA, Johnston J, Madden K, Xu W, West J, et al. (2000). Interleukin 21 and its receptor are involved in NK cell expansion and regulation of lymphocyte function. Nature 408, 57–63. 10.1038/35040504. [DOI] [PubMed] [Google Scholar]
- 20.Bhatia S, Curti B, Ernstoff MS, Gordon M, Heath EI, Miller WH, Puzanov I, Quinn DI, Flaig TW, VanVeldhuizen P, et al. (2014). Recombinant interleukin-21 plus sorafenib for metastatic renal cell carcinoma: a phase 1/2 study. Journal for ImmunoTherapy of Cancer 2, 2. 10.1186/2051-1426-2-2. [DOI] [PMC free article] [PubMed] [Google Scholar]
- 21.Petrella TM, Tozer R, Belanger K, Savage KJ, Wong R, Smylie M, Kamel-Reid S, Tron V, Chen BE, Hunder NN, et al. (2012). Interleukin-21 has activity in patients with metastatic melanoma: a phase II study. J Clin Oncol 30, 3396–3401. 10.1200/JCO.2011.40.0655. [DOI] [PubMed] [Google Scholar]
- 22.Bell M, and Gottschalk S (2021). Engineered Cytokine Signaling to Improve CAR T Cell Effector Function. Front Immunol 12, 684642. 10.3389/fimmu.2021.684642. [DOI] [PMC free article] [PubMed] [Google Scholar]
- 23.Lottaz C, Beier D, Meyer K, Kumar P, Hermann A, Schwarz J, Junker M, Oefner PJ, Bogdahn U, Wischhusen J, et al. (2010). Transcriptional profiles of CD133+ and CD133- glioblastoma-derived cancer stem cell lines suggest different cells of origin. Cancer Res 70, 2030–2040. 10.1158/0008-5472.Can-09-1707. [DOI] [PubMed] [Google Scholar]
- 24.Zhu H, Blum RH, Bernareggi D, Ask EH, Wu Z, Hoel HJ, Meng Z, Wu C, Guan KL, Malmberg KJ, and Kaufman DS (2020). Metabolic Reprograming via Deletion of CISH in Human iPSC-Derived NK Cells Promotes In Vivo Persistence and Enhances Anti-tumor Activity. Cell Stem Cell 27, 224–237 e226. 10.1016/j.stem.2020.05.008. [DOI] [PMC free article] [PubMed] [Google Scholar]
- 25.Menk AV, Scharping NE, Rivadeneira DB, Calderon MJ, Watson MJ, Dunstane D, Watkins SC, and Delgoffe GM (2018). 4–1BB costimulation induces T cell mitochondrial function and biogenesis enabling cancer immunotherapeutic responses. Journal of Experimental Medicine 215, 1091–1100. 10.1084/jem.20171068. [DOI] [PMC free article] [PubMed] [Google Scholar]
- 26.Reddaway J, Richardson PE, Bevan RJ, Stoneman J, and Palombo M (2023). Microglial morphometric analysis: so many options, so little consistency. Front Neuroinform 17, 1211188. 10.3389/fninf.2023.1211188. [DOI] [PMC free article] [PubMed] [Google Scholar]
- 27.Hanisch UK, Lyons SA, Prinz M, Nolte C, Weber JR, Kettenmann H, and Kirchhoff F (1997). Mouse brain microglia express interleukin-15 and its multimeric receptor complex functionally coupled to Janus kinase activity. J Biol Chem 272, 28853–28860. 10.1074/jbc.272.46.28853. [DOI] [PubMed] [Google Scholar]
- 28.Eisenman J, Ahdieh M, Beers C, Brasel K, Kennedy MK, Le T, Bonnert TP, Paxton RJ, and Park LS (2002). Interleukin-15 interactions with interleukin-15 receptor complexes: characterization and species specificity. Cytokine 20, 121–129. 10.1006/cyto.2002.1989. [DOI] [PubMed] [Google Scholar]
- 29.Tasic B, Menon V, Nguyen TN, Kim TK, Jarsky T, Yao Z, Levi B, Gray LT, Sorensen SA, Dolbeare T, et al. (2016). Adult mouse cortical cell taxonomy revealed by single cell transcriptomics. Nat Neurosci 19, 335–346. 10.1038/nn.4216. [DOI] [PMC free article] [PubMed] [Google Scholar]
- 30.Cacalano NA (2016). Regulation of Natural Killer Cell Function by STAT3. Front Immunol 7, 128. 10.3389/fimmu.2016.00128. [DOI] [PMC free article] [PubMed] [Google Scholar]
- 31.Duncan GS, Mittrücker HW, Kägi D, Matsuyama T, and Mak TW (1996). The transcription factor interferon regulatory factor-1 is essential for natural killer cell function in vivo. J Exp Med 184, 2043–2048. 10.1084/jem.184.5.2043. [DOI] [PMC free article] [PubMed] [Google Scholar]
- 32.Geary CD, Krishna C, Lau CM, Adams NM, Gearty SV, Pritykin Y, Thomsen AR, Leslie CS, and Sun JC (2018). Non-redundant ISGF3 Components Promote NK Cell Survival in an Auto-regulatory Manner during Viral Infection. Cell Rep 24, 1949–1957 e1946. 10.1016/j.celrep.2018.07.060. [DOI] [PMC free article] [PubMed] [Google Scholar]
- 33.Gordon SM, Chaix J, Rupp LJ, Wu J, Madera S, Sun JC, Lindsten T, and Reiner SL (2012). The transcription factors T-bet and Eomes control key checkpoints of natural killer cell maturation. Immunity 36, 55–67. 10.1016/j.immuni.2011.11.016. [DOI] [PMC free article] [PubMed] [Google Scholar]
- 34.Larsen SB, Cowley CJ, Sajjath SM, Barrows D, Yang Y, Carroll TS, and Fuchs E (2021). Establishment, maintenance, and recall of inflammatory memory. Cell Stem Cell 28, 1758–1774 e1758. 10.1016/j.stem.2021.07.001. [DOI] [PMC free article] [PubMed] [Google Scholar]
- 35.de Laval B, Maurizio J, Kandalla PK, Brisou G, Simonnet L, Huber C, Gimenez G, Matcovitch-Natan O, Reinhardt S, David E, et al. (2020). C/EBPbeta-Dependent Epigenetic Memory Induces Trained Immunity in Hematopoietic Stem Cells. Cell Stem Cell 26, 657–674 e658. 10.1016/j.stem.2020.01.017. [DOI] [PubMed] [Google Scholar]
- 36.Rapp M, Lau CM, Adams NM, Weizman OE, O’Sullivan TE, Geary CD, and Sun JC (2017). Core-binding factor beta and Runx transcription factors promote adaptive natural killer cell responses. Sci Immunol 2. 10.1126/sciimmunol.aan3796. [DOI] [PMC free article] [PubMed] [Google Scholar]
- 37.Bromley SK, Akbaba H, Mani V, Mora-Buch R, Chasse AY, Sama A, and Luster AD (2020). CD49a Regulates Cutaneous Resident Memory CD8(+) T Cell Persistence and Response. Cell Rep 32, 108085. 10.1016/j.celrep.2020.108085. [DOI] [PMC free article] [PubMed] [Google Scholar]
- 38.Gunturi A, Berg RE, and Forman J (2004). The role of CD94/NKG2 in innate and adaptive immunity. Immunol Res 30, 29–34. 10.1385/IR:30:1:029. [DOI] [PubMed] [Google Scholar]
- 39.Weng NP, Araki Y, and Subedi K (2012). The molecular basis of the memory T cell response: differential gene expression and its epigenetic regulation. Nat Rev Immunol 12, 306–315. 10.1038/nri3173. [DOI] [PMC free article] [PubMed] [Google Scholar]
- 40.Dan L, Liu L, Sun Y, Song J, Yin Q, Zhang G, Qi F, Hu Z, Yang Z, Zhou Z, et al. (2020). The phosphatase PAC1 acts as a T cell suppressor and attenuates host antitumor immunity. Nat Immunol 21, 287–297. 10.1038/s41590-019-0577-9. [DOI] [PubMed] [Google Scholar]
- 41.Delconte RB, Kolesnik TB, Dagley LF, Rautela J, Shi W, Putz EM, Stannard K, Zhang JG, Teh C, Firth M, et al. (2016). CIS is a potent checkpoint in NK cell-mediated tumor immunity. Nat Immunol 17, 816–824. 10.1038/ni.3470. [DOI] [PubMed] [Google Scholar]
- 42.Tripathi P, Koss B, Opferman JT, and Hildeman DA (2013). Mcl-1 antagonizes Bax/Bak to promote effector CD4(+) and CD8(+) T-cell responses. Cell Death Differ 20, 998–1007. 10.1038/cdd.2013.25. [DOI] [PMC free article] [PubMed] [Google Scholar]
- 43.Goh W, Sudholz H, Foroutan M, Scheer S, Pfefferle A, Delconte RB, Meng X, Shen Z, Hennessey R, Kong IY, et al. (2024). IKAROS and AIOLOS directly regulate AP-1 transcriptional complexes and are essential for NK cell development. Nat Immunol 25, 240–255. 10.1038/s41590-023-01718-4. [DOI] [PubMed] [Google Scholar]
- 44.Araki K, Turner AP, Shaffer VO, Gangappa S, Keller SA, Bachmann MF, Larsen CP, and Ahmed R (2009). mTOR regulates memory CD8 T-cell differentiation. Nature 460, 108–112. 10.1038/nature08155. [DOI] [PMC free article] [PubMed] [Google Scholar]
- 45.Hasan F, Chiu Y, Shaw RM, Wang J, and Yee C (2021). Hypoxia acts as an environmental cue for the human tissue-resident memory T cell differentiation program. JCI Insight 6. 10.1172/jci.insight.138970. [DOI] [PMC free article] [PubMed] [Google Scholar]
- 46.Kuo CT, Veselits ML, and Leiden JM (1997). LKLF: A transcriptional regulator of single-positive T cell quiescence and survival. Science 277, 1986–1990. 10.1126/science.277.5334.1986. [DOI] [PubMed] [Google Scholar]
- 47.O’Sullivan TE, Johnson LR, Kang HH, and Sun JC (2015). BNIP3- and BNIP3L-Mediated Mitophagy Promotes the Generation of Natural Killer Cell Memory. Immunity 43, 331–342. 10.1016/j.immuni.2015.07.012. [DOI] [PMC free article] [PubMed] [Google Scholar]
- 48.Schober SL, Kuo CT, Schluns KS, Lefrancois L, Leiden JM, and Jameson SC (1999). Expression of the transcription factor lung Kruppel-like factor is regulated by cytokines and correlates with survival of memory T cells in vitro and in vivo. J Immunol 163, 3662–3667. [PubMed] [Google Scholar]
- 49.Tu WJ, Hardy K, Sutton CR, McCuaig R, Li J, Dunn J, Tan A, Brezar V, Morris M, Denyer G, et al. (2017). Priming of transcriptional memory responses via the chromatin accessibility landscape in T cells. Sci Rep 7, 44825. 10.1038/srep44825. [DOI] [PMC free article] [PubMed] [Google Scholar]
- 50.Pantaleon Garcia J, Kulkarni VV, Reese TC, Wali S, Wase SJ, Zhang J, Singh R, Caetano MS, Kadara H, Moghaddam SJ, et al. (2022). OBIF: an omics-based interaction framework to reveal molecular drivers of synergy. NAR Genom Bioinform 4, lqac028. 10.1093/nargab/lqac028. [DOI] [PMC free article] [PubMed] [Google Scholar]
- 51.Ramji DP, and Foka P (2002). CCAAT/enhancer-binding proteins: structure, function and regulation. Biochem J 365, 561–575. 10.1042/bj20020508. [DOI] [PMC free article] [PubMed] [Google Scholar]
- 52.Tolomeo M, and Grimaudo S (2020). The “Janus” Role of C/EBPs Family Members in Cancer Progression. Int J Mol Sci 21. 10.3390/ijms21124308. [DOI] [PMC free article] [PubMed] [Google Scholar]
- 53.Kaisho T, Tsutsui H, Tanaka T, Tsujimura T, Takeda K, Kawai T, Yoshida N, Nakanishi K, and Akira S (1999). Impairment of natural killer cytotoxic activity and interferon gamma production in CCAAT/enhancer binding protein gamma-deficient mice. J Exp Med 190, 1573–1582. 10.1084/jem.190.11.1573. [DOI] [PMC free article] [PubMed] [Google Scholar]
- 54.Zhou Y, Quan G, Liu Y, Shi N, Wu Y, Zhang R, Gao X, and Luo L (2023). The application of Interleukin-2 family cytokines in tumor immunotherapy research. Front Immunol 14, 1090311. 10.3389/fimmu.2023.1090311. [DOI] [PMC free article] [PubMed] [Google Scholar]
- 55.Leonard WJ, and Wan CK (2016). IL-21 Signaling in Immunity. F1000Res 5. 10.12688/f1000research.7634.1. [DOI] [PMC free article] [PubMed] [Google Scholar]
- 56.de Totero D, Meazza R, Capaia M, Fabbi M, Azzarone B, Balleari E, Gobbi M, Cutrona G, Ferrarini M, and Ferrini S (2008). The opposite effects of IL-15 and IL-21 on CLL B cells correlate with differential activation of the JAK/STAT and ERK1/2 pathways. Blood 111, 517–524. 10.1182/blood-2007-04-087882. [DOI] [PubMed] [Google Scholar]
- 57.Hart GT, Hogquist KA, and Jameson SC (2012). Kruppel-like factors in lymphocyte biology. J Immunol 188, 521–526. 10.4049/jimmunol.1101530. [DOI] [PMC free article] [PubMed] [Google Scholar]
- 58.Rabacal W, Pabbisetty SK, Hoek KL, Cendron D, Guo Y, Maseda D, and Sebzda E (2016). Transcription factor KLF2 regulates homeostatic NK cell proliferation and survival. Proc Natl Acad Sci U S A 113, 5370–5375. 10.1073/pnas.1521491113. [DOI] [PMC free article] [PubMed] [Google Scholar]
- 59.Myers JA, Schirm D, Bendzick L, Hopps R, Selleck C, Hinderlie P, Felices M, and Miller JS (2022). Balanced engagement of activating and inhibitory receptors mitigates human NK cell exhaustion. JCI Insight 7. 10.1172/jci.insight.150079. [DOI] [PMC free article] [PubMed] [Google Scholar]
- 60.Li M, Li Z, Yao Y, Jin WN, Wood K, Liu Q, Shi FD, and Hao J (2017). Astrocyte-derived interleukin-15 exacerbates ischemic brain injury via propagation of cellular immunity. Proc Natl Acad Sci U S A 114, E396–E405. 10.1073/pnas.1612930114. [DOI] [PMC free article] [PubMed] [Google Scholar]
- 61.Shi SX, Li YJ, Shi K, Wood K, Ducruet AF, and Liu Q (2020). IL (Interleukin)-15 Bridges Astrocyte-Microglia Crosstalk and Exacerbates Brain Injury Following Intracerebral Hemorrhage. Stroke 51, 967–974. 10.1161/STROKEAHA.119.028638. [DOI] [PubMed] [Google Scholar]
- 62.Cui A, Huang T, Li S, Ma A, Pérez JL, Sander C, Keskin DB, Wu CJ, Fraenkel E, and Hacohen N (2024). Dictionary of immune responses to cytokines at single-cell resolution. Nature 625, 377–384. 10.1038/s41586-023-06816-9. [DOI] [PMC free article] [PubMed] [Google Scholar]
- 63.Lau CM, Adams NM, Geary CD, Weizman OE, Rapp M, Pritykin Y, Leslie CS, and Sun JC (2018). Epigenetic control of innate and adaptive immune memory. Nat Immunol 19, 963–972. 10.1038/s41590-018-0176-1. [DOI] [PMC free article] [PubMed] [Google Scholar]
- 64.Rückert T, Lareau CA, Mashreghi MF, Ludwig LS, and Romagnani C (2022). Clonal expansion and epigenetic inheritance of long-lasting NK cell memory. Nat Immunol 23, 1551–1563. 10.1038/s41590-022-01327-7. [DOI] [PMC free article] [PubMed] [Google Scholar]
- 65.Wendt K, Wilk E, Buyny S, Schmidt RE, and Jacobs R (2007). Interleukin-21 differentially affects human natural killer cell subsets. Immunology 122, 486–495. 10.1111/j.1365-2567.2007.02675.x. [DOI] [PMC free article] [PubMed] [Google Scholar]
- 66.Zhang Y, Sif S, and DeWille J (2007). The mouse C/EBPdelta gene promoter is regulated by STAT3 and Sp1 transcriptional activators, chromatin remodeling and c-Myc repression. J Cell Biochem 102, 1256–1270. 10.1002/jcb.21356. [DOI] [PubMed] [Google Scholar]
- 67.Liu E, Ang SOT, Kerbauy L, Basar R, Kaur I, Kaplan M, Li L, Tong Y, Daher M, Ensley EL, et al. (2021). GMP-Compliant Universal Antigen Presenting Cells (uAPC) Promote the Metabolic Fitness and Antitumor Activity of Armored Cord Blood CAR-NK Cells. Front Immunol 12, 626098. 10.3389/fimmu.2021.626098. [DOI] [PMC free article] [PubMed] [Google Scholar]
- 68.Pear WS, Nolan GP, Scott ML, and Baltimore D (1993). Production of high-titer helper-free retroviruses by transient transfection. Proc Natl Acad Sci U S A 90, 8392–8396. 10.1073/pnas.90.18.8392. [DOI] [PMC free article] [PubMed] [Google Scholar]
- 69.Persons DA, Mehaffey MG, Kaleko M, Nienhuis AW, and Vanin EF (1998). An improved method for generating retroviral producer clones for vectors lacking a selectable marker gene. Blood Cells Mol Dis 24, 167–182. 10.1006/bcmd.1998.0184. [DOI] [PubMed] [Google Scholar]
- 70.Cosset FL, and Russell SJ (1996). Targeting retrovirus entry. Gene Ther 3, 946–956. [PubMed] [Google Scholar]
- 71.Stuart T, Srivastava A, Madad S, Lareau CA, and Satija R (2021). Single-cell chromatin state analysis with Signac. Nat Methods 18, 1333–1341. 10.1038/s41592-021-01282-5. [DOI] [PMC free article] [PubMed] [Google Scholar]
- 72.Jain AK, Xi Y, McCarthy R, Allton K, Akdemir KC, Patel LR, Aronow B, Lin C, Li W, Yang L, and Barton MC (2016). LncPRESS1 Is a p53-Regulated LncRNA that Safeguards Pluripotency by Disrupting SIRT6-Mediated De-acetylation of Histone H3K56. Mol Cell 64, 967–981. 10.1016/j.molcel.2016.10.039. [DOI] [PMC free article] [PubMed] [Google Scholar]
- 73.Heinz S, Benner C, Spann N, Bertolino E, Lin YC, Laslo P, Cheng JX, Murre C, Singh H, and Glass CK (2010). Simple combinations of lineage-determining transcription factors prime cis-regulatory elements required for macrophage and B cell identities. Mol Cell 38, 576–589. 10.1016/j.molcel.2010.05.004. [DOI] [PMC free article] [PubMed] [Google Scholar]
- 74.Robinson JT, Thorvaldsdottir H, Winckler W, Guttman M, Lander ES, Getz G, and Mesirov JP (2011). Integrative genomics viewer. Nat Biotechnol 29, 24–26. 10.1038/nbt.1754. [DOI] [PMC free article] [PubMed] [Google Scholar]
Associated Data
This section collects any data citations, data availability statements, or supplementary materials included in this article.
Supplementary Materials
Video S1. Cytokine arming improves NK cell anti-tumor activity against GSCs, related to Figure 1. 3D killing assay of GSC272 spheroids by NT, IL-15 or IL-21 NK cells over 7 days. Images were acquired every 2 hours. Red signal reveals the growth of the GSC272 spheroids and green signal indicates apoptosis (Caspase 3/7). Scale bar= 600 μm.
Table S2. Transcription factor enrichment in cluster 6, related to Figure 4.
Data Availability Statement
Single-cell RNA-seq, single-cell ATAC-seq, bulk RNA-seq, bulk ATAC-seq and ChIP-seq data used in the generation of Figures 4, 5 and 7, and Figures S8 and S9 are available through the Gene Expression Omnibus (https://www.ncbi.nlm.nih.gov/geo/) under accession GSE227098. Processed data and R scripts used for analyzing data and generating all manuscript figures are deposited on GitHub:https://github.com/KChen-lab/NK_CEBPD_manuscript.