

Abstract
Aim: To explore the role of miR-181a-5p in the progression of acute kidney injury (AKI) to renal interstitial fibrosis (RIF) from the perspective of DNA methylation.
Materials & methods: The role of miR-181a-5p was confirmed by collecting clinical samples, injecting miR-181a-5p agomir into tail vein, and transfecting miR-181a-5p mimic in vitro. The mechanism of miR-181a-5p’s influence on AKI induced RIF was investigated by methylation-specific PCR, bioinformatic analysis, transcriptome sequencing and so on.
Results: MiR-181a-5p plays an important role in AKI induced RIF. DNMT3b-mediated miR-181a-5p promoter hypermethylation is the main reason for the downregulation of miR-181a-5p. HDAC9 and SNAI2 are direct targets of miR-181a-5p.
Conclusion: Hypermethylation of miR-181a-5p promoter mediated by DNMT3b promotes AKI induced RIF by targeting HDAC9 and SNAI2.
Keywords: : acute kidney injury, DNMT3b, HDAC9, miR-181a-5p, renal interstitial fibrosis, SNAI2
Plain language summary
Article highlights.
Background
Renal interstitial fibrosis (RIF) is a common pathway in the progression of almost all types of chronic kidney disease (CKD) to end-stage renal disease, which severely threatens human health. Acute kidney injury (AKI) is a common clinical syndrome, which is closely correlated with the progression of RIF. However, the underlying mechanism of AKI-inducing RIF remains unclear.
MiR-181a-5p is significantly downregulated in the urine of AKI-CKD patients & kidney tissue of ischemia–reperfusion (I/R) mice
miR-181a-5p expression levels in the urine of AKI-CKD patients were significantly decreased compared with that of healthy volunteers.
Compared with the control group, I/R mice showed decreased renal function, pathological damage of kidney tissue, and abnormal expression levels of fibrosis related proteins in kidney tissue.
miR-181a-5p expression levels in I/R mice were significantly decreased compared with the Sham group.
Overexpression of miR-181a-5p improves renal function, ameliorates renal tissue injury & fibrosis in mice
Serum creatinine and blood urea nitrogen levels were higher after I/R injury in mice, and these two indicators showed a significant decrease trend after miR-181a-5p agomir treatment.
I/R led to dilation of renal tubules, sloughing of renal tubular epithelial cells (RTEC) and infiltration of inflammatory cells in the renal stroma interstitium, while overexpression of miR-181a-5p alleviated these phenomena.
Over-expression of miR-181a-5p significantly restored the levels of fibrosis markers in kidney tissue.
Overexpression of miR-181a-5p inhibits RTEC migration & epithelial–mesenchymal transition
miR-181a-5p mimic treatment markedly blunted the motility of RTEC.
Over-expression of miR-181a-5p significantly restored the levels of fibrosis markers in RTEC.
DNMT3b affects miR-181a-5p promoter DNA methylation
TGF-β1 induced hypermethylation of the miR-181a-5p promoter.
DNMT3b was significantly upregulated in the kidney tissue of CKD patients and RTEC that developed epithelial–mesenchymal transition.
Aza, which inhibits DNMT3b activity, significantly restored the loss of miR-181a-5p.
HDAC9 & SNAI2 are direct targets of miR-181a-5p
HDAC9 and SNAI2 were identified as the direct targets of miR-181a-5p.
Conclusion
Hypermethylation of miR-181a-5p promoter mediated by DNMT3b promotes RIF developed from AKI by targeting HDAC9 and SNAI2.
We anticipate that argeting the DNMT3B/miR-181a-5p/HDAC9 and SNAI2 pathway may represent a new effective therapeutic option for treating RIF developed from AKI.
1. Background
Renal interstitial fibrosis (RIF) is a common pathway for almost all types of chronic kidney disease (CKD) to progress to end-stage renal disease, which is manifested by activation of myofibroblasts and excessive deposition of extracellular matrix [1]. Epithelial–mesenchymal transition (EMT) in renal tubular epithelial cells (RTEC) is considered to be one of the most important sources of myofibroblasts and a vital mechanism of RIF [2]. TGF-β1 is the key fibrotic factor and EMT inducer [3]. Acute kidney injury (AKI) is a clinical syndrome defined as a rapid decline in renal function that can be caused by a variety of etiologies, which associates with morbidity of 21.6% [4]. Renal ischemia–reperfusion (I/R) is one of the important causes of AKI [5]. A growing body of evidence has proved that AKI is closely correlated with the progression of RIF that seriously threatens human health [6]. However, few studies have addressed the mechanism of AKI-inducing RIF, which leads to the lack of specific treatment for RIF. Therefore, it is especially vital to reveal the potential mechanism of RIF induced by AKI and explore the key target of its development.
MicroRNA (miRNA) are a class of endogenous noncoding small RNA comprising 21–25 nucleotides [7]. miRNA usually represses gene expression via partially binding to the 3′UTR of target genes. They are the potential diagnostic markers and therapeutic targets for many diseases [8]. Recent studies have shown that miRNA not only plays an important role in maintaining normal renal function, but also participates in the pathophysiological processes of fibrosis as promoter or inhibitor [9]. As a member of the miR-181 family, miR-181a-5p is found to be reduced in the urinary exosomes in CKD patients and renal tissues in rats with diabetic kidney disease. Furthermore, overexpression of miR-181a-5p inhibits the expression of fibrosis-related proteins in RTEC [10,11]. Based on this, we speculate that the downregulation of miR-181a-5p might be an important factor underlying the occurrence of RIF. However, it is unknown whether the same phenomenon exists in the process of AKI-induced RIF and further exploration is needed.
DNA methylation is a vital epigenetic modification that regulates gene expression, which refers to a methyl transfers from S-adenosylmethionine to the fifth carbon atom of cytosine under the action of DNA methyltransferases (DNMTs), including DNMT1, DNMT3a and DNMT3b [12,13]. Generally, there is a negative correlation between DNA methylation and gene expression [14]. Previous in vivo and in vitro studies have consistently demonstrated that abnormal DNA methylation causes changes in gene expression of key proteins involved in extracellular matrix regulation and sustained fibroblast activation, and further causes renal fibrosis [15]. Another study indicated that DNMTs inhibitors can prevent early renal injury caused by I/R [16]. These data suggested that DNA methylation affects the progression of renal disease. Moreover, DNA methylation also regulates miRNA expression through methylating specific promoter region [17].
Overall, we intended to explore the role and mechanism of miR-181a-5p in RIF developed from AKI from the perspective of DNA methylation in this study, so as to find efficient new therapeutic targets for improving RIF developed from AKI.
2. Materials & methods
2.1. Study participants
22 patients with AKI which progressed to CKD during follow-up (AKI-CKD) and 22 healthy volunteers from Zhujiang Hospital of Southern Medical University were enrolled in this study. Morning urine samples were collected and centrifuged at 4000 rpm for 20 min at 4°C, and filtered for standby. This study has been approved by the Medical Ethics Committee of Zhujiang Hospital of Southern Medical University (2017-ZYK-003). Informed consent was obtained prior to the collection of samples.
2.2. Mice experiments
C57BL/6J mice were purchased from Beijing Vital River Laboratory Animal Technology Co., Ltd. All mice were adaptively fed at least 1 week before the experiment. Pentobarbital (50 mg/kg) was injected intraperitoneally for anesthesia. Bilateral renal ischemia was induced by clamping renal pedicles for 40 min with microvascular clamps and then subjected to reperfusion. Control mice received the same treatment without renal pedicle clamping. Mice were injected with miR-181a-5p agomir or negative control agomir (5 nmol, purchased from Guangzhou RiboBio Co., Ltd) via tail vein 12 h before modeling and 48 h after modeling. During the experiments, mice were free to eat feed and drink water. Mice were sacrificed 7 days after modeling under anesthesia. This study was approved by the Animal Ethics Committee of Guangdong Medical Laboratory Animal Center (C202305-8).
2.3. Biochemical measurements
Blood samples from the abdominal aorta were collected and centrifuged at 3500 rpm for 10 min. Mice serum creatinine (Scr) and blood urea nitrogen (BUN) were detected using the Creatinine Assay kit (C011-2-1, Nanjing Jiancheng Bioengineering Institute, Nanjing, China) and Urea Assay kit (C013-1-1, Nanjing Jiancheng Bioengineering Institute, Nanjing, China), respectively.
2.4. Histology
The left kidneys of mice were removed, fixed in 4% paraformaldehyde (Servicebio, Wuhan, China), embedded in wax, and then cut into 3–5 μm thick sections. Sections were then stained with hematoxylin and eosin (H&E), Masson, and Sirius red. Images were captured using a KF-PRO-005 digital pathological section scanner (KFBIO, Ningbo, China) and analyzed with K-Viewer software.
2.5. Western blotting (WB)
RIPA buffer (CWBIO, Beijing, China) was used for lysing the tissues or cells. Proteins were quantified using the BCA Protein Assay Kit (Thermo Fisher Scientific, USA). After electrophoresis and membrane transfer, the membranes were blocked for 3 h in 5% non-fat milk and then incubated with anti-ZO-1 (1:1000, Proteintech, Wuhan, China), anti-E-cadherin, anti-N-cadherin (1:1000, Cell Signaling Technology, USA), anti-TGF-β1, anti-Vimentin, anti-α-SMA, anti-DNMT1, anti-DNMT3a, anti-DNMT3b, anti-HDAC9, anti-SNAI2 (1:500, Affinity Biosciences, USA) and anti-β-actin (1:4000-1:20000, Affinity Biosciences, USA) at 4°C overnight. Secondary antibody (1:1000, Cell Signaling Technology, USA) was then applied for 2 h incubation at 4°C. Protein bands were visualized via Immobilon Western Chemilum HRP Substrate (Millipore, USA) and analyzed using ImageJ.
2.6. Semi-quantitative real-time PCR (q-PCR)
Total RNA from urine, tissues or cells was extracted using Trizol (AG21102, Changsha, China). The mRNA was reverse transcribed into cDNA using Evo M-MLV RT Kit with gDNA Clean for qPCR II (AG11711, Changsha, China). For miRNA reverse transcription, cDNA was synthesized using miRNA first strand cDNA synthesis kit (AG11717, Changsha, China). The qPCR was performed using SYBR® Green Premix Pro Taq HS qPCR Kit (AG11701, Changsha, China) with appropriate primers (Supplementary Tables S1 & S2). All the primers were synthesized by Guangzhou RiboBio Co., Ltd or Shenzhen Huada Gene Technology Co., Ltd.
2.7. Cells culture & treatment
HK-2 cells were kindly supplied by Professor Ming Wang from Southern Medical University. NRK-52E cells were kindly provided by Professor Xiaoli Nie from Southern Medical University. HK-2 cells were cultured in MEM EAGLE medium (BI, Israel) with 10% fetal bovine serum (FBS, BI, Israel) and 1% Pen-Strep Solution (BI, Israel). NRK-52E cells were maintained in DMEM medium (VivaCell, Germany) supplemented with 10% FBS and 1% Pen-Strep Solution. They were maintained at 37°C and 5% CO2 in a humidified chamber. TGF-β1 (5, 10 ng/ml for 24 or 48 h, Peprotech, USA) or azacitidine (Aza, 5, 10, 20, 40 μM for 48 h, InvivoChem, Guangzhou, China) were added where needed.
2.8. Transfection of miRNA mimic & inhibitor
HK-2 cells and NRK-52E cells were seeded into 12-well plates, and transfection was started when the cell density reached 40–60%. Cells were transfected with miR-181a-5p mimic (50 nM), miR-181a-5p inhibitor (100 nM) and appropriate negative controls using lipofectamine 6000 (Beyotime, Shanghai, China). The mimic, inhibitor and negative controls were purchased from Guangzhou RiboBio Co., Ltd. Cells were harvested 48 h after transfection.
2.9. Scratch wound assay
HK-2 cells (4 × 10⁵ cells/well) and NRK-52E cells (2 × 10⁵ cells/well) were seeded into 12-well plates. When the cells grew to 100% and fused, they were scratched with a 200 μl gun tip and washed with PBS twice to remove detached cells. During the experiment, HK-2 cells were cultured with culture medium containing 5% FBS, and NRK-52E cells were cultured with culture medium containing 1% FBS. At the same time, cells were treated differently according to the experiment grouping design. Selecting the same point of view to take a picture at 0 and 24 h (or 12 h) to observe the cell migration. The migration area was analyzed by ImageJ software.
2.10. Transwell assay
HK-2 cells (2.5 × 10⁵ cells/ml) and NRK-52E cells (1 × 10⁵ cells/ml) were suspended in serum-free culture medium. To the upper chamber of the transwell system (Corning, USA), 100 μl cell suspension was added. To the lower chamber of the transwell system, 500 μl culture medium containing 10% FBS was added. After 24 h, cells were treated differently according to the experiment grouping design. Cells were fixed with 75% ethanol at 4°C overnight after ending the intervention and stained with crystal violet (Beyotime, Shanghai, China) for at least 30 min. Unmigrated cells were removed from the upper surface of the membrane by gently scrubbing with a cotton tipped swab. After drying, cells were observed and photographed under an inverted microscope (Olympus, Japan).
2.11. Immunofluorescence
HK-2 cells and NRK-52E cells were seeded in confocal culture dishes at a seeding density of 3 × 10⁴ cells/dish. After 24 h, cells were treated differently according to the experiment grouping design. After treatment, the cells were washed with PBS, fixed with 4% paraformaldehyde at room temperature for 15 min or overnight at 4°C, followed by a rinse with PBS three-times. The cells were permeabilized with 0.2% Triton X-100 (Solarbio, Beijing, China) for 10 min, washed once with PBS, and blocked with 5% bovine serum albumin for 1 h. Then, cells were treated with Vimentin primary antibody (1:200) overnight at 4°C. The next day, the cells were washed three-times with PBS and incubated with Alexa Fluor 488-labeled Goat Anti-Rabbit IgG (H+L) (Beyotime, Shanghai, China) for 1.5 h at room temperature. Cells were then washed three-times with PBS and nuclei were stained with DAPI (Beyotime) for 15 min. After washing with PBS for three-times, fresh PBS was added, and cells were imaged by confocal laser scanning microscopy (ZEISS, Germany).
2.12. Methylation-specific PCR (MSP)
DNA was extracted using SteadyPure Universal Genomic DNA Extraction Kit (AG21009, Changsha, China). Following DNA extraction, samples were bisulfite converted using DNA Bisulfite Conversion Kit (DP215, TIANGEN, Beijing, China). Bisulfite converted genomic DNA was PCR amplified using MethyTect Taq HS PCR kit for bisulfite-treated DNA (AG11209, Changsha, China) and methylation specific primers (Supplementary Table S3) from Invitrogen. MSP products were analyzed by electrophoresis on 3% agarose (Biosharp, Hefei, China).
2.13. Bioinformatic analysis
GSE66494 dataset was obtained from Gene Expression Omnibus (GEO) database (https://www.ncbi.nlm.nih.gov/geo/), including gene expression information of healthy people and CKD patients in kidney tissue. Weighted gene co-expression network analysis (WGCNA) was constructed through the R package “WGCNA” to identify the modules with the highest relevance for patients with CKD. The hierarchical clustering tree was established based on the correlation coefficients. The branches of the cluster tree highlighted different genetic modules, which were indicated by different colors. The module eigengene (ME) of each module was calculated. The correlation between modules and traits was described with a heatmap.
2.14. Transcriptome sequencing
After total RNA extraction and library construction, sequencing was performed on the Illumina Novaseq™ 6000 by LC Bio Technology CO., Ltd. After the sequencing, the data from the LC-Bio cloud platform was downloaded and analyzed. Genes with fold change ≥ 2 (|log2FC|≥1) and q < 0.05 (adjusted p-values < 0.05) were used for the next step of the analysis.
2.15. Prediction & screening of miR-181a-5p target genes
The target genes of miR-181a-5p were predicted through TargetScan database (https://www.targetscan.org/vert_80/) and miRDB database (https://mirdb.org/). The predicted results of the two databases intersected with the downregulated differential genes obtained by sequencing, and the obtained genes were the candidate target genes of the initial screening of miR-181a-5p. Further, the genes that were supported by the literature to be mutually regulated with TGF-β1 were selected as the final miR-181a-5p candidate target genes.
2.16. Dual luciferase reporter assay
Luciferase reporter gene vectors were constructed by Guangzhou RiboBio Co., Ltd. Then, the luciferase reporter gene vectors were cotransfected into HK-2 cells with miR-181a-5p NC or miR-181a-5p mimic using lipofectamine 6000 transfection reagent, respectively. The luciferase activity of the luciferase reporter gene vectors was determined with Duo-Lite™ Luciferase Assay System (DD1205, Vazyme, Nanjing, China).
2.17. Immunohistochemical analysis
The presence of HDAC9 and SNAI2 was confirmed in kidney tissues by immunohistochemistry. Sections were dewaxed, hydrated, and subjected to antigen repair in citric acid buffer (PythonBio, Guangzhou, China) at high temperature for 10 min. Then, 3% hydrogen peroxide (Macklin, Shanghai, China) was used to inhibit endogenous peroxidase activity for 10 min, and sections were blocked with 5% bovine serum albumin for 15 min. Sections were incubated overnight with primary antibody at 4°C, and with horseradish peroxidase-conjugated goat antirabbit IgG antibody (Gene Tech, Shanghai, China) at room temperature for 30 min. Color was developed using diaminobenzidine (Gene Tech) and nuclei were stained with hematoxylin. Images were captured using a KF-PRO-005 digital pathological section scanner and analyzed with K-Viewer software.
2.18. Statistical analysis
SPSS 26.0 software was used for statistical data analysis, and GraphPad Prism 8.0 software was used for graphing. The experimental data were shown by mean ± SD. Independent sample’s t-test was used for comparison between the two groups. One-way Analysis of variance was used for comparison between multiple groups. Least-Significant Difference test was used when variance was uniform, and Dunnett’s T3 test was used when variance was uneven. Results were considered statistically significant at a level of p < 0.05.
3. Results
3.1. MiR-181a-5p is significantly downregulated in the urine of AKI-CKD patients & kidney tissue of I/R mice
To determine the expression changes of miR-181a-5p in RIF developed from AKI, we detected the expression levels of miR-181a-5p in the urine of AKI-CKD patients. As shown in Figure 1A, miR-181a-5p expression levels in the urine of AKI-CKD patients were significantly decreased compared with that of healthy volunteers. I/R-induced mouse AKI model were also established to determine whether miR-181a-5p was involved in RIF developed from AKI (Figure 1B). We found that compared with the control group, I/R mice showed decreased renal function, pathological damage of kidney tissue and abnormal expression levels of fibrosis related proteins in kidney tissue, suggesting that I/R mice had developed RIF (Figure 1C–K). Next, we detected the miR-181a-5p expression levels in kidney tissue from both control mice underwent sham operation (Sham) and model mice received I/R, and to analyze the differences between the two groups. The results showed that miR-181a-5p expression levels in I/R mice were significantly decreased compared with the Sham group as shown in Figure 1L. These data indicated that miR-181a-5p may play a key role in RIF developed from AKI.
Figure 1.
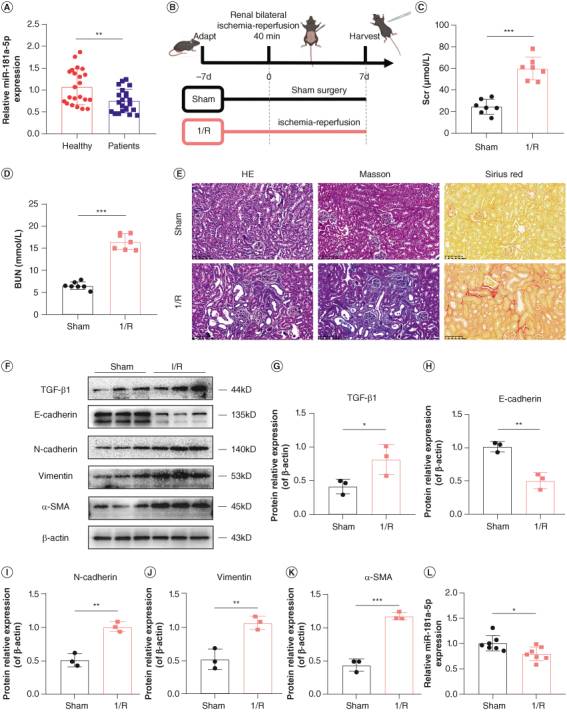
Expression of miR-181a-5p in the urine of acute kidney injury-chronic kidney disease patients and kidney tissue of ischemia–reperfusion mice. (A) Expression of miR-181a-5p in the urine of AKI-CKD patients were detected by q-PCR (n = 22, **p < 0.01). (B) Flow diagram of mice experimental design (This image was created with BioRender.com). (C & D) Scr and BUN levels in mice (n = 7, ***p < 0.001). (E) Representative images of H&E staining, Masson staining and Sirius red staining to detect renal tissue injury and fibrosis. Scale bars: 100 μm. (F) Representative images of TGF-β1, E-cadherin, N-cadherin, vimentin and α-SMA by WB. Each lane corresponds to a sample from an individual mouse. (G–K) Grayscale analysis of TGF-β1, E-cadherin, N-cadherin, vimentin and α-SMA, β-actin as internal reference (n = 3, *p < 0.05; **p < 0.01; ***p < 0.001). (L) Expression of miR-181a-5p in kidney tissue of I/R mice were detected by q-PCR (n = 7, *p < 0.05).
AKI: Acute kidney injury; BUN: Blood urea nitrogen; CKD: Chronic kidney disease; H&E: Hematoxylin and eosin; I/R: Ischemia–reperfusion; Scr: Serum creatinine.
3.2. Overexpression of miR-181a-5p improves renal function, ameliorates renal tissue injury & fibrosis in mice
To investigate whether miR-181a-5p plays a role in RIF developed from AKI, miR-181a-5p agomir or negative control agomir were injected into mice via the tail vein (Figure 2A). Overexpression of miR-181a-5p was proved in kidney tissue of mice treated with miR-181a-5p agomir (Figure 2B). Scr and BUN levels were measured to evaluate the renal function, and the results are shown in Figure 2C & D. Scr and BUN levels were higher after I/R injury in mice, and these two indicators showed a significant decrease trend after miR-181a-5p agomir treatment. H&E staining results reported that I/R led to dilation of renal tubules, sloughing of RTEC and infiltration of inflammatory cells in the renal stroma interstitium, while overexpression of miR-181a-5p alleviated these phenomena (Figure 2E).
Figure 2.
Effects of miR-181a-5p on renal function, renal tissue injury and renal interstitial fibrosis in mice. (A) Flow diagram of mice experimental design (This image was created with BioRender.com). (B) Expression of miR-181a-5p in kidney tissue of mice were detected by q-PCR (n = 5, *p < 0.05, **p < 0.01). (C & D) Scr and BUN levels in mice (n = 5, *p < 0.05, **p < 0.01, ***p < 0.001). (E) Representative images of H&E staining, Masson staining and Sirius red staining to detect renal tissue injury and fibrosis. Scale bars: 100 μm. (F) Representative images of TGF-β1, E-cadherin, N-cadherin, vimentin and α-SMA by WB. Each lane corresponds to a sample from an individual mouse. (G–K) Grayscale analysis of TGF-β1, E-cadherin, N-cadherin, vimentin and α-SMA, β-actin as internal reference (n = 3, *p < 0.05, **p < 0.01, ***p < 0.001).
BUN: Blood urea nitrogen; H&E: Hematoxylin and eosin; Scr: Serum creatinine.
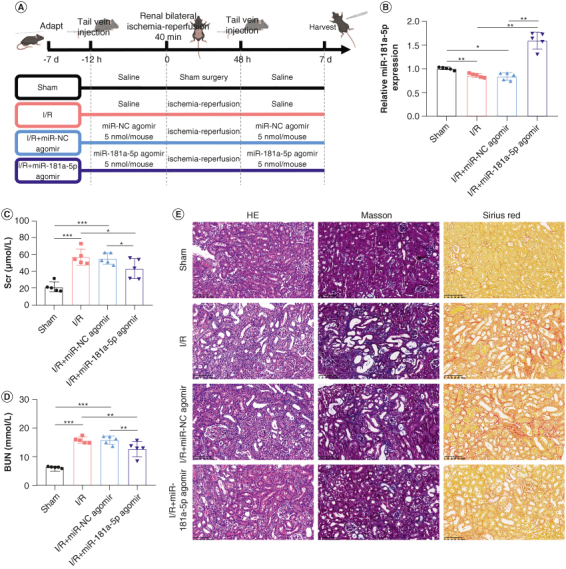
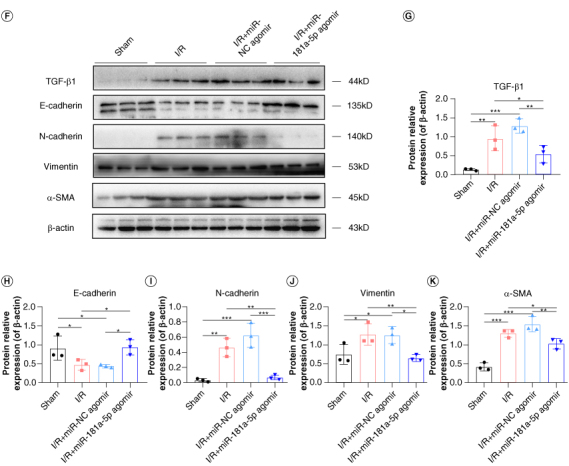
Kidney sections stained with Masson and Sirius red, and tissue fibrosis markers were detected to evaluate the effects of miR-181a-5p on RIF. Histological comparison revealed that the deposition of renal interstitial collagen fibers was obvious in I/R mice, which suggested successful establishment of the RIF model. On the other hand, miR-181a-5p agomir treatment reduced the areas of collagen deposition (Figure 2E). The levels of fibrosis markers, TGF-β1, E-cadherin, N-cadherin, vimentin and α-SMA, in kidney tissue were detected by WB to further verify the effects of miR-181a-5p. Likewise, results showed that over-expression of miR-181a-5p significantly restored the levels of fibrosis markers in kidney tissue (Figure 2F–K). These results demonstrate that overexpression of miR-181a-5p improves renal function, ameliorates renal tissue injury and fibrosis.
3.3. Overexpression of miR-181a-5p inhibits RTEC migration & EMT
We used the q-PCR to detect the levels of miR-181a-5p in TGF-β1-treated RTEC. We showed that TGF-β1 strongly reduces miR-181a-5p levels in a dose-dependent and time-dependent manner (Figure 3A & B). Notably, the maximum effect of downregulation of miR-181a-5p were observed after intervention with TGF-β1 (10 ng/ml) for 48 h, therefore, this condition was used for subsequent in vitro experiments.
Figure 3.
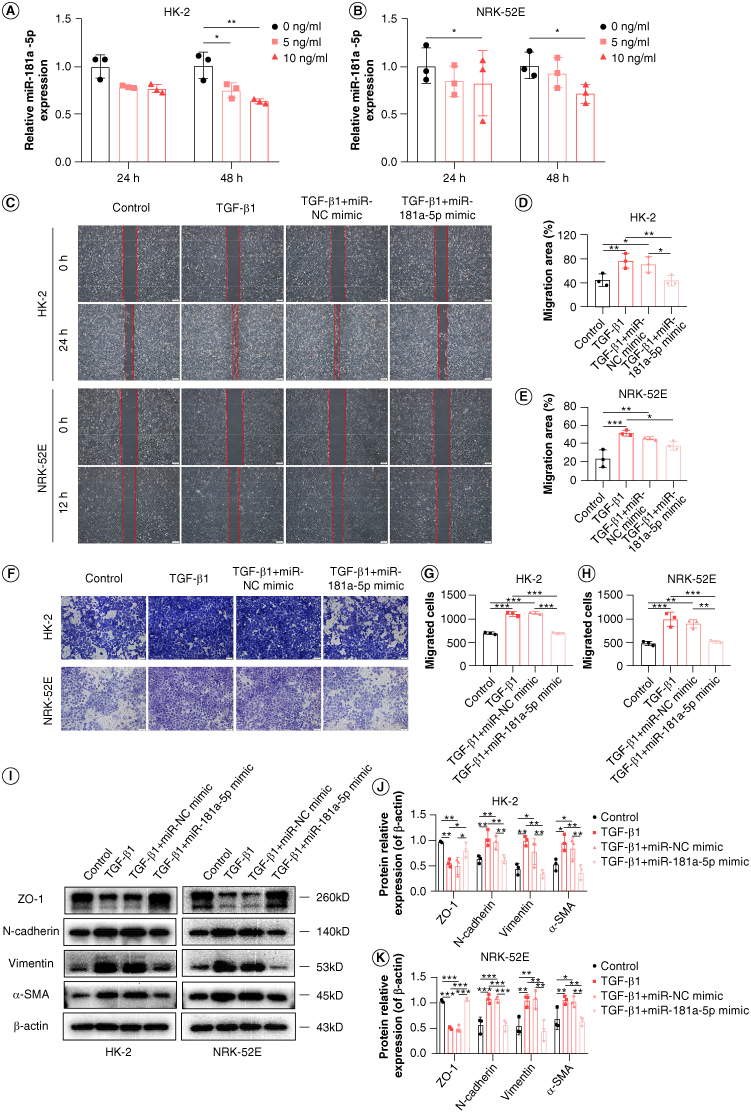
Effects of miR-181a-5p on migration and epithelial–mesenchymal transition in renal tubular epithelial cells. (A & B) Expression of miR-181a-5p in TGF-β1-treated HK-2 cells and NRK-52E cells were detected by q-PCR (n = 3, *p < 0.05, **p < 0.01). (C) Representative images of scratch wound assay to observe migration ability. Scale bars: 200 μm. (D & E) Quantitative analysis of migration area of HK-2 and NRK-52E cells (n = 3, *p < 0.05, **p < 0.01, ***p < 0.001). (F) Representative images of transwell assay to observe migration ability. Scale bars: 100 μm. (G & H) HK-2 and NRK-52E cells migration number analysis (n = 3, **p < 0.01, ***p < 0.001). (I) Representative images of ZO-1, N-cadherin, vimentin and α-SMA by WB. (J & K) Grayscale analysis of ZO-1, N-cadherin, vimentin and α-SMA, β-actin as internal reference (n = 3, *p < 0.05, **p < 0.01, ***p < 0.001).
To assess the effects of miR-181a-5p on RIF in vitro, miR-181a-5p mimic or negative control were transfected into HK-2 cells and NRK-52E cells, and transfection efficiency were confirmed through q-PCR (Supplementary Figure S1). A scratch wound assay was applied to measure the effects of miR-181a-5p on the migration of HK-2 cells or NRK-52E cells. The results showed that treatment with miR-181a-5p mimic significantly blunted the motility of cells, which is determined by the migration region (Figure 3C–E). Transwell assay further confirmed the ability of miR-181a-5p to attenuate migration (Figure 3F–H), and this assay is another widely used method for assessing cell migration.
To validate the effects of miR-181a-5p on EMT in RTEC, we detected the expression of EMT-related proteins in HK-2 cells and NRK-52E cells by using WB. As illustrated in Figure 3I–K, ZO-1 was decreased upon exposure to TGF-β1, and N-cadherin, vimentin and α-SMA were elevated following TGF-β1 treatment. As expected, overexpression of miR-181a-5p reversed these changes. The trends of vimentin observed by immunofluorescence were consistent with the WB results (Supplementary Figure S2). These data strongly suggests that overexpression of miR-181a-5p inhibits RTEC migration and EMT.
3.4. DNMT3b affects miR-181a-5p promoter DNA methylation
DNA methylation in promoter regions often repress miRNAs expression [17]. To explore the relationship between miR-181a-5p promoter methylation and RIF, we performed MSP assay on miR-181a-5p promoter region of HK-2 cells and semiquantitatively analyzed the PCR products. It should be noted that since hsa-miR-181a-5p is encoded by MIR181A2HG, we selected 2000 bp upstream and 200 bp downstream of the transcription start site of MIR181A2HG as the promoter sequence. The coordinates of amplification region ranged from +16 to +128 (see schematic, Supplementary Figure S3). As shown in Figure 4A & B, miR-181a-5p promoter displayed low basal methylation (about 2%); however fibrotic model cells induced by TGF-β1 exhibited increased methylation up to 13%, suggesting that miR-181a-5p suppression in TGF-β1-treated RTEC is likely due to miR-181a-5p promoter hypermethylation.
Figure 4.
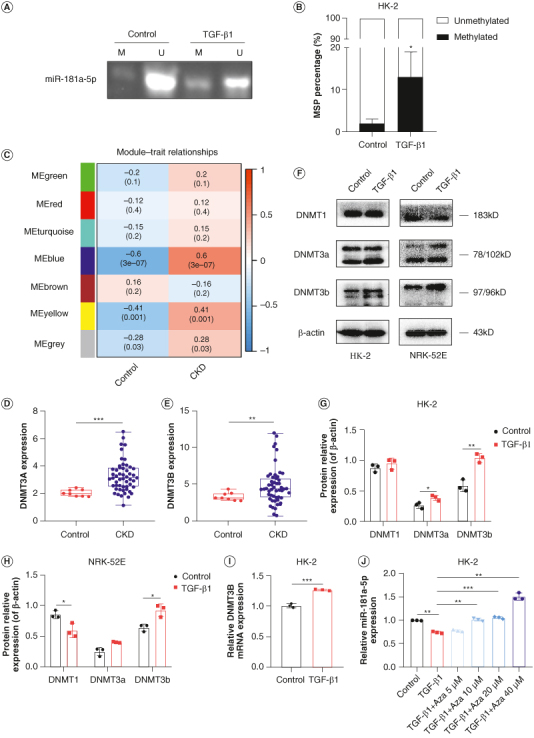
Effects of DNMT3b on miR-181a-5p promoter DNA methylation. (A) Representative image of MSP to observe the effects of TGF-β1 on miR-181a-5p promoter DNA methylation. (B) Quantification of MSP results (n = 3, *p < 0.05). (C) Seven modules revealed by the WGCNA. (D) DNMT3A level in CKD patients was shown in GEO database (***p < 0.001). (E) DNMT3B level in CKD patients was shown in GEO database (**p < 0.01). (F) Representative images of DNMT1, DNMT3a and DNMT3b in HK-2 and NRK-52E cells by WB. (G & H) Grayscale analysis of DNMT1, DNMT3a and DNMT3b, β-actin as internal reference (n = 3, *p < 0.05, **p < 0.01). (I) Expression of DNMT3B in HK-2 cells were detected by q-PCR (n = 3, ***p < 0.001). (J) Expression of miR-181a-5p in HK-2 cells were detected by q-PCR (n = 3, **p < 0.01, ***p < 0.001).
MSP: Methylation-specific PCR; WGCNA: Weighted gene co-expression network analysis.
To further identify the upstream causal events leading to the hypermethylation of the miR-181a-5p promoter, we downloaded the GSE66494 dataset from the GEO database and used WGCNA to identify the gene groups with the highest relevance to CKD disease. As shown in Supplementary Figure S4 & Figure 4C, a sum of seven modules were revealed by the WGCNA analysis. In particular, the blue module had a strong positive association with CKD patients, and DNMT3A and DNMT3B were also included in the WGCNA blue module (Supplementary Table S4). We further analyzed the expression of DNMT3A and DNMT3B, and the results showed that the expression of DNMT3A and DNMT3B in kidney tissues of CKD patients were significantly higher than that of healthy people (Figure 4D & E). Moreover, DNMTs levels were examined in RTEC via WB. HK-2 cells displayed marked increase of DNMT3a and DNMT3b proteins, meanwhile DNMT1 level decreased, whereas DNMT3b level increased in NRK-52E cells (Figure 4F–H). No significant changes in expression were noted for DNMT1 in HK-2 cells and DNMT3a in NRK-52E cells. Since DNA hypermethylation is caused by gain of DNMTs activities [18], the data described above suggest that DNMT3b is probably responsible for miR-181a-5p promoter hypermethylation. Our q-PCR data also validated this finding (Figure 4I). It is worth mentioning that downregulation of miR-181a-5p induced by TGF-β1 was inhibited by Aza, a DNMTs inhibitor (Figure 4J). Taken together, these findings indicate that aberrant DNMT3b-associated miR-181a-5p promoter hypermethylation suppresses miR-181a-5p in RTEC.
3.5. HDAC9 & SNAI2 are direct targets of miR-181a-5p
We performed Absolute Quantitative Transcriptome Sequencing to analyze the differential genes expression by assessing variation between the transcriptomes of miR-NC mimic group and miR-181a-5p mimic group. Compared with control, there were 191 genes up-regulated and 356 genes downregulated in miR-181a-5p mimic group, as shown in the volcano plot (Figure 5A). It is known that miRNAs bind to the 3′UTR of the target genes to repress the levels of the target genes [8]. Therefore, the downregulated differential genes were selected for intersection with miR-181a-5p target genes predicted by TargetScan database and miRDB database. A total of eight candidate target genes were identified in the Venn diagram overlapping regions (Figure 5B). Based on other literature, we found that HDAC9 [19], SERPINE1 [20], SNAI2 [21] and TNS1 [22] have been shown to interact with TGF-β1; thus, these genes were highlighted as the final candidate target genes.
Figure 5.
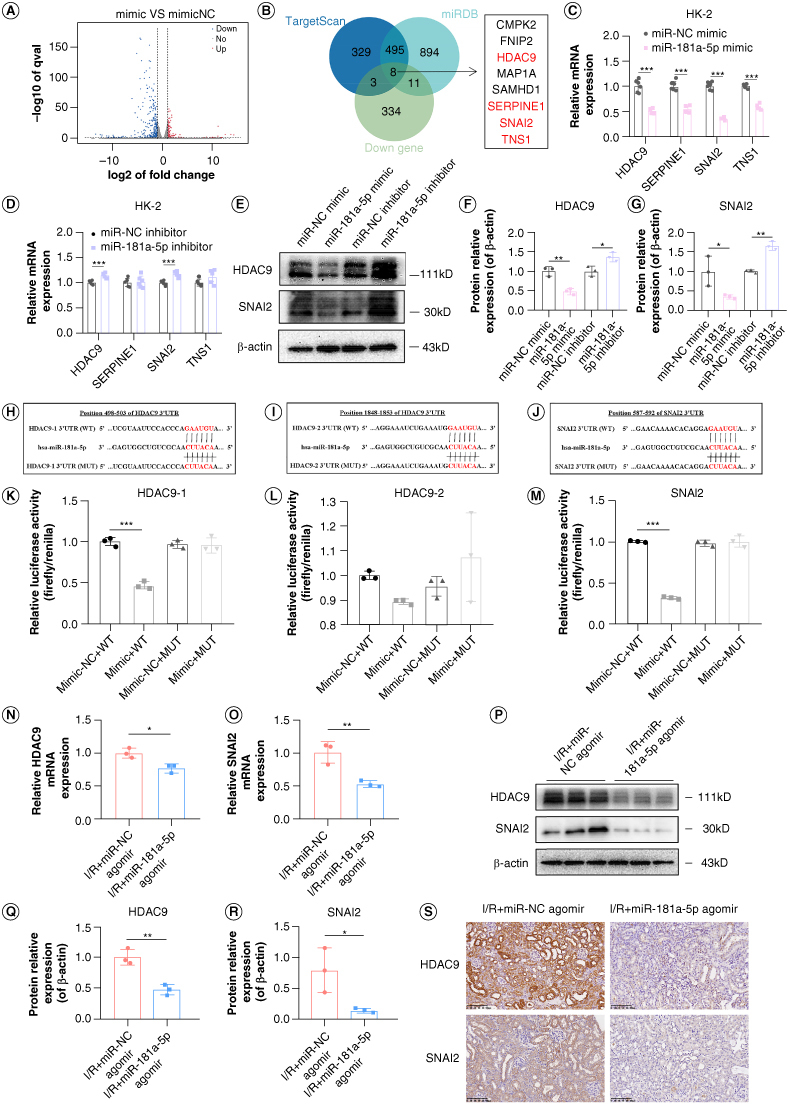
Screening and experimental verification of miR-181a-5p target genes. (A) Differential genes were identified by reference absolute quantitative transcriptome sequencing. (B) MiR-181a-5p target genes were screened through databases prediction, transcriptome sequencing, and literature review. (C & D) Expression of HDAC9, SERPINE1, SNAI2 and TNS1 in HK-2 cells were detected by q-PCR (n = 6, ***p < 0.001). (E) Representative images of HDAC9 and SNAI2 in HK-2 cells by WB. (F & G) Grayscale analysis of HDAC9 and SNAI2, β-actin as internal reference (n = 3, *p < 0.05, **p < 0.01). (H–J) Complementary sequence analysis of miR-181a-5p and HDAC9 (position 498–503), HDAC9 (position 1848–1853) and SNAI2 (position 587–592) genes 3′UTR and base sequence change of mutant vector. (K–M) Changes of luciferase activity after reaction of miR-181a-5p with HDAC9 or SNAI2 (n = 3, ***p < 0.001). (N & O) Expression of HDAC9 and SNAI2 in kidney tissue of mice were detected by q-PCR (n = 3, *p < 0.05, **p < 0.01). (P) Representative images of HDAC9 and SNAI2 in kidney tissue of mice by WB. Each lane corresponds to a sample from an individual mouse. (Q & R) Grayscale analysis of HDAC9 and SNAI2, β-actin as internal reference (n = 3, *p < 0.05, **p < 0.01). (S) Representative images of HDAC9 and SNAI2 in kidney tissue of mice by immunohistochemistry. Scale bars: 100 μm.
The transfection efficiency of miR-181a-5p mimic and inhibitor were examined by q-PCR (Supplementary Figures S1 & S5). q-PCR was performed to verify the expressions of the candidate target genes. The results in Figure 5C & D depicted that the levels of HDAC9, SERPINE1, SNAI2 and TNS1 mRNA were significantly downregulated by the overexpression of miR-181a-5p, while only HDAC9 and SNAI2 expression were upregulated by the inhibitors for miR-181a-5p. This implies that HDAC9 and SNAI2 are more likely target genes of miR-181a-5p. Further WB analyses revealed that overexpression of miR-181a-5p effectively downregulated HDAC9 and SNAI2 protein expression; a contrary result was observed when miR-181a-5p was inhibited (Figure 5E–G), which agrees with the expected result.
Using bioinformatics analysis, we found that miR-181a-5p contains specific binding sequences of the 3′UTR regions of HDAC9 and SNAI2. The binding sites between the 3′UTR sequences of HDAC9 and SNAI2 and the 5′ end sequence of miR-181a-5p were shown in Figure 5H–J. We further sought to determine whether HDAC9 and SNAI2 are the direct targets of miR-181a-5p by performing a dual luciferase reporter assay. The results displayed that the relative luciferase activity was obviously suppressed in HK-2 cells co-transfected with miR-181a-5p mimic and luciferase reporter vectors containing wild-type HDAC9 (position 498–503 rather than 1848–1853) or SNAI2 3′UTR; whereas the inhibitory effects were abolished when HDAC9 or SNAI2 binding sites were mutated (Figure 5K–M). This data demonstrates that HDAC9 and SNAI2 are direct targets of miR-181a-5p.
Next, I/R mice injected with miR-181a-5p agomir via the tail vein were used to examine the mRNA expressions of HDAC9 and SNAI2 in kidney tissue by q-PCR (Figure 5N & O), and the protein levels of HDAC9 and SNAI2 by WB (Figure 5P–R) and immunohistochemistry (Figure 5S). The results showed that the expressions of HDAC9 and SNAI2 were reduced at both the gene level and the protein level after overexpression of miR-181a-5p in vivo, which once again proved that HDAC9 and SNAI2 are targets of miR-181a-5p in vivo.
4. Discussion
Kidney, as a highly perfused organ and is prone to sustain I/R injury [23], which can lead to AKI and subsequent RIF [24]. However, the mechanism of RIF developed from AKI has not been fully elucidated. In this study, we first demonstrated the significant role of miR-181a-5p in RIF developed from AKI. DNMT3b-mediated miR-181a-5p promoter hypermethylation is the main reason for the downregulation of miR-181a-5p. Furthermore, HDAC9 and SNAI2 are direct targets of miR-181a-5p.
As one of the spliceosomes produced by human pre-miR-181a, miR-181a-5p is involved in various pathophysiological processes such as tumor metastasis, adipogenesis, cartilage degeneration and myogenic differentiation [11]. Although previous studies have described the effects of miR-181a-5p on the progression of RIF [10,11], and our study has also shown that miR-181a-5p is reduced in the urine of patients with AKI-CKD, few studies have explored its role in AKI-induced RIF. Therefore, we chose a bilateral renal I/R model to simulate the transition from AKI to RIF, which is considered to be more consistent with human pathophysiological situations, as both kidneys are affected in human patients [25]. Pathological staining and detection of fibrosis markers showed that I/R successfully induced RIF, which was consistent with other studies [26,27]. Meanwhile, we observed a decrease in miR-181a-5p expression in kidney tissue of I/R mice, which was consistent with our expectations. To investigate whether miR-181a-5p has a protective effect on I/R mice, we injected miR-181a-5p agomir into the tail vein to overexpress miR-181a-5p in I/R mice. Overexpression of miR-181a-5p significantly reduced Scr and BUN levels, improved abnormal pathological changes and normalized the expression of fibrosis-related proteins. These results confirmed the beneficial effects of miR-181a-5p on renal function, renal tissue injury and fibrosis in I/R mice.
Similarly to the in vivo results, we observed a decrease in miR-181a-5p expression in TGF-β1-induced EMT models in RTEC, which was dose-dependent and time-dependent. To further investigate the effect of miR-181a-5p on EMT in RTEC, we conducted in vitro studies. Enhanced cell migratory capacity is one of the important cytological behaviors during EMT in RTEC. When the cell phenotype is transformed, fibroblasts are activated to become myofibroblasts which possess the enlarged spindle-shaped morphology and acquire a relatively greater migration ability [28]. Fortunately, scratch wound assay and transwell assay indicted that miR-181a-5p attenuated the migratory capacity of RTEC. A recent study by Wang et al. [29] showed that the migratory capacity of human hepatic stellate cells treated with TGF-β1 was weakened after transfection with miR-181a-5p mimic and vice versa, which is consistent with our experimental observations. The available evidence directly or indirectly indicates that miR-181a-5p corrects abnormal expression of Vimentin and α-SMA [29,30]. These findings are consistent with the expression of EMT-related proteins we measured, further confirming that miR-181a-5p plays a vital inhibitory role in EMT in RTEC.
In recent years, DNA methylation and miRNA have become hot topics in the study of the mechanism of RIF, as they can not only affect RIF as independent factors but also interact with each other to affect the disease process. Specifically, higher methylation levels of promoter regions of miR-125a-5p [31], miR-138 [32] and miR-129-2 [33] have been reported in tumor tissues or blood of patients with breast cancer, cervical cancer and chronic lymphocytic leukemia compared with the control group. However, abnormal methylation of miRNA has not been reported in RIF. To investigate this, we evaluated the methylation of miR-181a-5p promoter region during RIF using MSP and found that it was highly methylated after TGF-β1 stimulation. This suggests that the downregulation of miR-181a-5p induced by TGF-β1 is likely due to hypermethylation of the miR-181a-5p promoter region. It is worth mentioning that since we designed different MSP primers for several regions with CpG sites, and selected the pair with the best effect through screening, MSP also provided us with the possibility of preliminary screening of methylation sites. Of course, bisulfite sequencing is still needed to further explore the exact location of methylation, which will be the focus of our follow-up research.
The mechanism by which hypermethylation of the miR-181a-5p promoter remains a mystery. DNMT1, DNMT3a and DNMT3b are the major active DNMTs found in mammals [34]. DNMT1 is the most abundant and contributes to the maintenance of DNA methylation, while DNMT3a and DNMT3b promote methylation at previously unmethylated sites [35,36]. In this study, we used bioinformatic analysis to show that DNMT3A and DNMT3B were highly expressed in kidney tissues of CKD patients. Furthermore, we detected the levels of DNMTs in RETC and found that the level of DNMT3b increased at both gene and protein levels, indicating that DNMT3b is the key upstream target of miR-181a-5p promoter hypermethylation. An impressive study from Joo-Hoo Park's group suggess that TGF-β1 causes high expression of DNMT1, DNMT3a and DNMT3b genes and proteins in human airway epithelial cells, resulting in abnormal expression of EMT-related proteins, which can be reversed by DNMTs inhibitor [37]. Interestingly, in our study, Aza, which acts as a DNMTs inhibitor, abrogates the miR-181a-5p inhibition effect of TGF-β1. These results further support the hypothesis that DNMT3b promotes the hypermethylation of the miR-181a-5p promoter.
We were interested in exploring the downstream targets of miR-181a-5p using transcriptome sequencing, bioinformatics analysis and experiments in vitro and in vivo. We confirmed HDAC9 and SNAI2 as direct functional targets of miR-181a-5p by dual luciferase reporter assay. Previous studies have shown that HDAC9 is significantly upregulated in kidney tissue of diabetic kidney disease patients, and that silencing of HDAC9 mitigated renal damage in db/db mice [38]. knocking down HDAC9 in hepatic stellate cells reduced TGF-β1 levels and returned aberrant expression of fibrosis-related genes to the normal level [19]. Our study, combined with previous studies, suggests that HDAC9 binding to miR-181a-5p was gradually replaced by free HDAC9 after miR-181a-5p was downregulated by TGF-β1, further causing the increase of TGF-β1 and forming a cycle of “TGF-β1-miR-181a-5p-HDAC9-TGF-β1” to facilitate the progress of RIF. SNAI2, also known as Slug, is characterized as a strong E-cadherin suppressor and a major inducer of EMT, as well as an important mediator of twist-induced EMT and metastasis [39]. Multiple studies have displayed that TGF-β1 can induce SNAI2 to initiate RIF [40–42]. Taken together, we believe that the increase of HDAC9 and SNAI2, direct targets of miR-181a-5p, plays a vital role in the process of abnormal miR-181a-5p mediating RIF.
5. Conclusion
In summary, our study revealed a novel miR-181a-5p-related mechanism underlying the pathology of RIF developed from AKI. Pathological conditions could trigger the expression of DNMT3B mRNA and DNMT3b protein in RTEC, consequently enhancing HDAC9 and SNAI2 expressions via decreased miR-181a-5p expression following its promoter hypermethylation. These events are collectively responsible for AKI-induced RIF (Figure 6). We anticipate that argeting the DNMT3B/miR-181a-5p/HDAC9 and SNAI2 pathway may represent a new effective therapeutic option for treating RIF developed from AKI.
Figure 6.
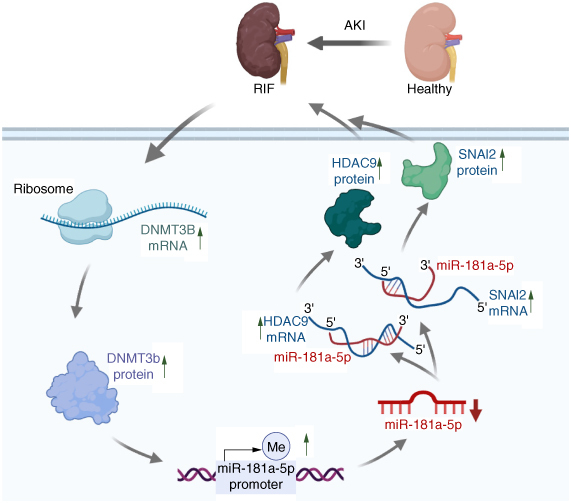
Schematic diagram of DNMT3b/miR-181a-5p targets HDAC9 and SNAI2 to induce renal interstitial fibrosis developed from acute kidney injury.
This image was created with BioRender.com.
Supplementary Material
Funding Statement
This work was supported by the National Natural Science Foundation of China (81973666, 82274510), the Natural Science Foundation of Guangdong Province, China (2019A1515010816), the open project of state key laboratory of dampness syndrome of chinese medicine and the second affiliated hospital of guangzhou university of chinese medicine (sz2021kf12).
Supplemental material
Supplementary data for this article can be accessed at https://doi.org/10.1080/17501911.2024.2370229
Author contributions
XM Sun and XS Zhao conceived, designed and supervised the study. HX Liu, GF Luo, B Xie and HL Diao performed clinical trials. HX Liu, YJ Deng and GF Luo performed in vivo experiments. HX Liu and ML Chen performed in vitro experiments. HX Liu and Y Yang performed bioinformatics analysis. HX Liu, LQ Chen and PH Xie did data analysis and interpretation. HX Liu wrote the manuscript. HY Kwan and XS Zhao modified the manuscript. All authors have read and approved the final manuscript.
Financial disclosure
This work was supported by the National Natural Science Foundation of China (81973666, 82274510), the Natural Science Foundation of Guangdong Province, China (2019A1515010816), the open project of state key laboratory of dampness syndrome of chinese medicine and the second affiliated hospital of guangzhou university of chinese medicine (sz2021kf12). The authors have no other relevant affiliations or financial involvement with any organization or entity with a financial interest in or financial conflict with the subject matter or materials discussed in the manuscript apart from those disclosed.
Competing interests disclosure
The authors have no competing interests or relevant affiliations with any organization or entity with the subject matter or materials discussed in the manuscript. This includes employment, consultancies, honoraria, stock ownership or options, expert testimony, grants or patents received or pending, or royalties.
Writing disclosure
No writing assistance was utilized in the production of this manuscript.
Ethical conduct of research
This study was approved by the Medical Ethics Committee of Zhujiang Hospital of Southern Medical University (2017-ZYK-003) and the Animal Ethics Committee of Guangdong Medical Laboratory Animal Center (C202305-8). Informed consent has been obtained from subjects.
Data availability statement
Data will be handled practicing the FAIR principles (Findable, Accessible, Interoperable and Reusable). The data supporting the findings of this study are included within the manuscript. Raw data will be accessible by contacting the first author.
References
Papers of special note have been highlighted as: • of interest; •• of considerable interest
- 1.Li X, Li W, Zhang Z, et al. SIRT6 overexpression retards renal interstitial fibrosis through targeting HIPK2 in chronic kidney disease. Front Pharmacol. 2022;13:1007168. doi: 10.3389/fphar.2022.1007168 [DOI] [PMC free article] [PubMed] [Google Scholar]
- 2.Li L, Zou Q, Li B, et al. Type XXVIII collagen regulates renal interstitial fibrosis and epithelial–mesenchymal transition by SREBP1-mediated HKDC1 expression. J Renin Angiotensin Aldosterone Syst. 2022;2022:9582559. doi: 10.1155/2022/9582559 [DOI] [PMC free article] [PubMed] [Google Scholar]
- 3.Zou J, Zhou X, Ma Y, et al. Losartan ameliorates renal interstitial fibrosis through metabolic pathway and Smurfs-TGF-β/Smad. Biomed Pharmacother. 2022;149:112931. doi: 10.1016/j.biopha.2022.112931 [DOI] [PubMed] [Google Scholar]
- 4.Kurzhagen JT, Dellepiane S, Cantaluppi V, et al. AKI: an increasingly recognized risk factor for CKD development and progression. J Nephrol. 2020;33(6):1171–1187. doi: 10.1007/s40620-020-00793-2 [DOI] [PubMed] [Google Scholar]
- 5.Wu R, Li J, Tu G, et al. Comprehensive molecular and cellular characterization of acute kidney injury progression to renal fibrosis. Front Immunol. 2021;12:699192. doi: 10.3389/fimmu.2021.699192 [DOI] [PMC free article] [PubMed] [Google Scholar]
- 6.Hu J, Qiao J, Yu Q, et al. Role of SIK1 in the transition of acute kidney injury into chronic kidney disease. J Transl Med. 2021;19(1):69. doi: 10.1186/s12967-021-02717-5 [DOI] [PMC free article] [PubMed] [Google Scholar]
- 7.Klimczak-Tomaniak D, Haponiuk-Skwarlińska J, Kuch M, et al. Crosstalk between microRNA and oxidative stress in heart failure: a systematic review. Int J Mol Sci. 2022;23(23):15013. doi: 10.3390/ijms232315013 [DOI] [PMC free article] [PubMed] [Google Scholar]
- 8.Stavast CJ, Erkeland SJ. The non-canonical aspects of microRNAs: many roads to gene regulation. Cells. 2019;8(11):1465. doi: 10.3390/cells8111465 [DOI] [PMC free article] [PubMed] [Google Scholar]
- 9.Panizo S, Martínez-Arias L, Alonso-Montes C, et al. Fibrosis in chronic kidney disease: pathogenesis and consequences. IntJ Mol Sci. 2021;22(1):408. doi: 10.3390/ijms22010408 [DOI] [PMC free article] [PubMed] [Google Scholar]
- 10.Khurana R, Ranches G, Schafferer S, et al. Identification of urinary exosomal noncoding RNAs as novel biomarkers in chronic kidney disease. RNA (New York, NY). 2017;23(2):142–152. doi: 10.1261/rna.058834.116 [DOI] [PMC free article] [PubMed] [Google Scholar]
- 11.Xu P, Guan MP, Bi JG, et al. High glucose down-regulates microRNA-181a-5p to increase pro-fibrotic gene expression by targeting early growth response factor 1 in HK-2 cells. Cell Signal. 2017;31:96–104. doi: 10.1016/j.cellsig.2017.01.012 [DOI] [PubMed] [Google Scholar]; •• Describes that miR-181a-5p can delay the development of renal fibrosis by targeting Egr1 in renal tubular epithelial cells.
- 12.Younesian S, Yousefi AM, Momeny M, et al. The DNA methylation in neurological diseases. Cells. 2022;11(21):3439. doi: 10.3390/cells11213439 [DOI] [PMC free article] [PubMed] [Google Scholar]
- 13.Constâncio V, Nunes SP, Henrique R, et al. DNA methylation-based testing in liquid biopsies as detection and prognostic biomarkers for the four major cancer types. Cells. 2020;9(3):624. doi: 10.3390/cells9030624 [DOI] [PMC free article] [PubMed] [Google Scholar]
- 14.Tang H, Kan L, Ou T, et al. Development of a novel prognostic signature for predicting the overall survival of bladder cancer patients. BiosciRep. 2020;40(6):BSR20194432. doi: 10.1042/bsr20194432 [DOI] [PMC free article] [PubMed] [Google Scholar]
- 15.Morgado-Pascual JL, Marchant V, Rodrigues-Diez R, et al. Epigenetic modification mechanisms involved in inflammation and fibrosis in renal pathology. Med Infla. 2018;2018:2931049. doi: 10.1155/2018/2931049 [DOI] [PMC free article] [PubMed] [Google Scholar]
- 16.Zhao Y, Zeng X, Xu X, et al. Low-dose 5-aza-2′-deoxycytidine protects against early renal injury by increasing klotho expression. Epigenomics. 2022;14(22):1411–1425. doi: 10.2217/epi-2022-0430 [DOI] [PubMed] [Google Scholar]
- 17.Wei J, Wang Z, Wang Z, et al. MicroRNA-31 function as a suppressor was regulated by epigenetic mechanisms in gastric cancer. BioMed Res Int. 2017;2017:5348490. doi: 10.1155/2017/5348490 [DOI] [PMC free article] [PubMed] [Google Scholar]
- 18.Shin E, Lee Y, Koo JS. Differential expression of the epigenetic methylation-related protein DNMT1 by breast cancer molecular subtype and stromal histology. J Transl Med. 2016;14:87. doi: 10.1186/s12967-016-0840-x [DOI] [PMC free article] [PubMed] [Google Scholar]
- 19.Yang Y, Bae M, Park YK, et al. Histone deacetylase 9 plays a role in the antifibrogenic effect of astaxanthin in hepatic stellate cells. J Nutr Biochem. 2017;40:172–177. doi: 10.1016/j.jnutbio.2016.11.003 [DOI] [PubMed] [Google Scholar]
- 20.Rawson R, Yang T, Newbury RO, et al. TGF-β1-induced PAI-1 contributes to a profibrotic network in patients with eosinophilic esophagitis. J Allergy Clin Immunol. 2016;138(3):791–800.e4. doi: 10.1016/j.jaci.2016.02.028 [DOI] [PMC free article] [PubMed] [Google Scholar]
- 21.Imai K, Ishimoto T, Doke T, et al. Long non-coding RNA lnc-CHAF1B-3 promotes renal interstitial fibrosis by regulating EMT-related genes in renal proximal tubular cells. Mol Ther Nucleic Acids. 2023;31:139–150. doi: 10.1016/j.omtn.2022.12.011 [DOI] [PMC free article] [PubMed] [Google Scholar]
- 22.Bernau K, Torr EE, Evans MD, et al. Tensin 1 is essential for myofibroblast differentiation and extracellular matrix formation. Am J Respir Cell Mol Biol. 2017;56(4):465–476. doi: 10.1165/rcmb.2016-0104OC [DOI] [PMC free article] [PubMed] [Google Scholar]
- 23.Tanada Y, Okuda J, Kato T, et al. The metabolic profile of a rat model of chronic kidney disease. PeerJ. 2017;5:e3352. doi: 10.7717/peerj.3352 [DOI] [PMC free article] [PubMed] [Google Scholar]
- 24.Xiao CC, Zhang J, Luo PC, et al. Identification of Tisp40 as an essential regulator of renal tubulointerstitial fibrosis via TGF-β/Smads pathway. Cell Physiol Biochem. 2017;42(2):697–712. doi: 10.1159/000477887 [DOI] [PubMed] [Google Scholar]; •• Provides an idea and method to study acute kidney injury (AKI) induced renal interstitial fibrosis (RIF).
- 25.Fu Y, Tang C, Cai J, et al. Rodent models of AKI-CKD transition. Am J Physiol Renal. 2018;315(4):F1098–F1106. doi: 10.1152/ajprenal.00199.2018 [DOI] [PMC free article] [PubMed] [Google Scholar]; • Explains why a bilateral renal ischemia–reperfusion model was chosen to simulate the transition from AKI to RIF.
- 26.Cho JH, Choi SY, Ryu HM, et al. Fimasartan attenuates renal ischemia–reperfusion injury by modulating inflammation-related apoptosis. Korean J Physiol Pharmacol. 2018;22(6):661–670. doi: 10.4196/kjpp.2018.22.6.661 [DOI] [PMC free article] [PubMed] [Google Scholar]
- 27.Xu D, Chen PP, Zheng PQ, et al. KLF4 initiates sustained YAP activation to promote renal fibrosis in mice after ischemia–reperfusion kidney injury. Acta Pharmacol Sin. 2021;42(3):436–450. doi: 10.1038/s41401-020-0463-x [DOI] [PMC free article] [PubMed] [Google Scholar]
- 28.Braga PC, Alves MG, Rodrigues AS, et al. Mitochondrial pathophysiology on chronic kidney disease. IntJ MolSci. 2022;23(3):1776. doi: 10.3390/ijms23031776 [DOI] [PMC free article] [PubMed] [Google Scholar]
- 29.Wang Y, Mou Q, Zhu Z, et al. MALAT1 promotes liver fibrosis by sponging miR-181a and activating TLR4-NF-κB signaling. IntJMolMed. 2021;48(6):215. doi: 10.3892/ijmm.2021.5048 [DOI] [PMC free article] [PubMed] [Google Scholar]
- 30.Cao L, Qin P, Zhang J, et al. LncRNA PVT1 suppresses the progression of renal fibrosis via inactivation of TGF-β signaling pathway. Drug Des Devel Ther. 2020;14:3547–3557. doi: 10.2147/dddt.S245244 [DOI] [PMC free article] [PubMed] [Google Scholar]
- 31.Ahmadpour F, Igder S, Babaahmadi-Rezaei H, et al. Methylation-mediated silencing of miR-125a-5p facilitates breast cancer progression by inducing autophagy. Mol Biol Rep. 2022;49(7):6325–6339. doi: 10.1007/s11033-022-07440-y [DOI] [PubMed] [Google Scholar]
- 32.Chen R, Gan Q, Zhao S, et al. DNA methylation of miR-138 regulates cell proliferation and EMT in cervical cancer by targeting EZH2. BMC Cancer. 2022;22(1):488. doi: 10.1186/s12885-022-09477-5 [DOI] [PMC free article] [PubMed] [Google Scholar]
- 33.Hashemi M, Mohammadipour M, Rostami S, et al. Promoter DNA methylation frequency and clinicopathological role of miR-129-2 gene in patients with chronic lymphocytic leukemia. Oman Med J. 2020;35(4):e151. doi: 10.5001/omj.2020.71 [DOI] [PMC free article] [PubMed] [Google Scholar]
- 34.Loaeza-Loaeza J, Beltran AS, Hernández-Sotelo D. DNMTs and impact of CpG content, transcription factors, consensus motifs, lncRNAs, and histone marks on DNA methylation. Genes. 2020;11(11):1336. doi: 10.3390/genes11111336 [DOI] [PMC free article] [PubMed] [Google Scholar]
- 35.Huang W, Li H, Yu Q, et al. LncRNA-mediated DNA methylation: an emerging mechanism in cancer and beyond. J Exp Clin Cancer Res. 2022;41(1):100. doi: 10.1186/s13046-022-02319-z [DOI] [PMC free article] [PubMed] [Google Scholar]
- 36.Jarczak J, Miszczak M, Radwanska K. Is DNA methylation in the brain a mechanism of alcohol use disorder? Front Behav Neurosci. 2023;17:957203. doi: 10.3389/fnbeh.2023.957203 [DOI] [PMC free article] [PubMed] [Google Scholar]
- 37.Park JH, Shin JM, Yang HW, et al. DNMTs are involved in TGF-β1-induced epithelial–mesenchymal transitions in airway epithelial cells. IntJMolSci. 2022;23(6):3003. doi: 10.3390/ijms23063003 [DOI] [PMC free article] [PubMed] [Google Scholar]
- 38.Liu F, Zong M, Wen X, et al. Silencing of histone deacetylase 9 expression in podocytes attenuates kidney injury in diabetic nephropathy. Sci Rep. 2016;6:33676. doi: 10.1038/srep33676 [DOI] [PMC free article] [PubMed] [Google Scholar] [Retracted]
- 39.Yu SL, Koo H, Lee SI, et al. A synthetic CPP33-conjugated HOXA9 active domain peptide inhibits invasion ability of non-small-lung cancer cells. Biomolecules. 2020;10(11):1589. doi: 10.3390/biom10111589 [DOI] [PMC free article] [PubMed] [Google Scholar]
- 40.Xu CG, Zhu XL, Wang W, et al. Ursolic acid inhibits epithelial–mesenchymal transition in vitro and in vivo. Pharm Biol. 2019;57(1):169–175. doi: 10.1080/13880209.2019.1577464 [DOI] [PMC free article] [PubMed] [Google Scholar]
- 41.Xie Y, Lan F, Zhao J, et al. Hirudin improves renal interstitial fibrosis by reducing renal tubule injury and inflammation in unilateral ureteral obstruction (UUO) mice. Int Immunopharmacol. 2020;81:106249. doi: 10.1016/j.intimp.2020.106249 [DOI] [PubMed] [Google Scholar]
- 42.Huang C, Jing X, Wu Q, et al. Novel pectin-like polysaccharide from Panax notoginseng attenuates renal tubular cells fibrogenesis induced by TGF-β. Carbohydr Polym. 2022;276:118772. doi: 10.1016/j.carbpol.2021.118772 [DOI] [PubMed] [Google Scholar]
Associated Data
This section collects any data citations, data availability statements, or supplementary materials included in this article.
Supplementary Materials
Data Availability Statement
Data will be handled practicing the FAIR principles (Findable, Accessible, Interoperable and Reusable). The data supporting the findings of this study are included within the manuscript. Raw data will be accessible by contacting the first author.