Abstract
The intestinal microbiota is a complex ecosystem that not only affects various physiological functions, such as metabolism, inflammation and the immune response, but also has an important effect on the development of tumors and response to treatment. The detection of intestinal flora enables the timely identification of disease-related flora abnormalities, which has significant implications for both disease prevention and treatment. In the field of basic and clinical research targeting gut microbiome, there is a need to recognize and understand the laboratory assays for gut microbiomics. Currently, there is no unified standard for the experimental procedure, quality management and report interpretation of intestinal microbiome assay technology. In order to clarify the process, the Tumor and Microecology Committee of China Anti-Cancer Association and the Tumor and Microecology Committee of Hubei Provincial Immunology Society organized relevant experts to discuss and put forward the standard technical specifications for gut microecomics laboratories, which provides a basis for further in-depth research in the field of intestinal microecomics.
Keywords: gut microecology, experimental procedures, bioinformatics analysis, technical specifications
1. Introduction
The intestinal microecology (IM), also known as the intestinal microbiota and intestinal flora, is the largest and most important microecological system of the human body and the key factor for activating and maintaining the physiological functions of the intestine. An increasing number of studies have been conducted to investigate the effects of intestinal microorganisms on various tissues and organs of the human body, as well as their relationship with various diseases, and the findings are gradually being translated into clinical practice (1,2). Microecological treatment strategies, such as fecal microbiota transplantation (FMT), IM regulators and genetically engineered bacteria, have improved curative effects on refractory Bacillus infection, inflammatory bowel disease (IBD) and graft-versus-host disease than traditional methods (3). Intestinal microorganisms affect the occurrence, progression, treatment response and toxic side effects of tumors. With more research being performed on the IM and tumors, a new chapter has been opened in IM research driven by methods and technologies, such as second-generation sequencing and bioinformatics. The IM maintains the function of the host immune system and plays a key role in tumor-controlling drug therapy. Increasing evidence has proven that the efficacy of tumor control drugs depends largely on the IM balance and strategies based on IM technology have shown promising application prospects in tumor diagnosis and treatment.
2. Overview
Experimental microbiology techniques
Studies have shown that a variety of human diseases, such as digestive tract diseases, metabolic syndrome, cardiovascular and cerebrovascular diseases, immune-related diseases, mental disorders and tumors, are closely related to dysbiosis of the intestinal flora (4-6). The identification of intestinal flora enables the timely detection of disease-related flora abnormalities and is coordinated with targeted intervention and conditioning, which are effective ways to regulate the IM, prevent the occurrence of flora-related diseases and relieve symptoms (7). The analysis of the human microbiome by 16S rRNA gene sequencing and shotgun metagenomic sequencing provides a wealth of microbial data resources for the prediction and discovery of biomarkers of human diseases and health conditions (8,9). The dysregulation of microbiota-host interactions is associated with the occurrence and prognosis of numerous diseases; however, the mechanisms of different immune responses across individuals are not clear (10,11). In 2013, Viaud et al (12) first reported that the IM was involved in the regulation of the efficacy of chemotherapeutic drugs. Then three clinical studies were published simultaneously in 2018 on the effect of intestinal bacteria on the use of PD-1 immune checkpoint inhibitors in the treatment of tumors (13,14). These studies demonstrated that the presence of Clostridiales in the intestine increased the effectiveness of anti-PD-1 antibody therapy, Bacteroidales inhibited the efficacy of treatment and Akkermansia muciniphila enhanced the tumor-controlling effect of anti-PD-1 antibody therapy. These findings suggest that variations in the IM may be a major factor in the success or failure of treatment. Bacterial strains isolated from human feces have been found to have neoplastic effects on colon cancer by enhancing the effect of immune checkpoint inhibitors (15). In 2020, Fluckiger et al (16) reported on the specific mechanism by which IM symbiotic-specific lymphocytes promote the tumor-controlling immune response. The findings indicated that microbial genomes may encode major histocompatibility complex class I-restricted antigens that induce memory CD8+ T lymphocyte responses, which in turn cross-react with cancer antigens, leading to the conclusion that phages in the microbiota may enrich the therapeutic options for modulating the intestinal flora and stimulating systemic anticancer immune responses.
The role of the intestinal microbiota
A previous study suggested that the microbiota may modulate tumor immunotherapy (17). Bifidobacterium is associated with tumor control and oral administration of Bifidobacterium alone has been shown to provide the same degree of tumor improvement as PD-L1-specific antibody therapy. The combination of the two can almost completely inhibit tumor growth, with heightened dendritic cell function leading to enhanced effects of CD8+ T-cell initiation and accumulation in the tumor microenvironment. The use of antibiotics has been found to be related to the adverse effects of PD-1-blocking immunotherapy (13); it has been suggested that patients with unresponsive lung and renal cancer can be treated with low levels of Akkermansia muciniphila, which can be used orally in tumor-bearing mice (18). Subtle differences between human health and disease can be driven by host-microorganism interactions in which microbiota regulate tumor occurrence, development and response to treatment (19,20). In addition to the ability of different microbial species to regulate the efficacy of chemotherapeutic drugs, the symbiotic relationship between the epithelial barrier and microecology plays a considerable role in local and distant immunity, thus substantially affecting the clinical outcome of patients with cancer (21). The use of antibiotics can weaken the tumor-controlling effect of immune checkpoint inhibitors and enhance the immunotherapy effect in the presence of certain intestinal microorganisms (22).
The intestinal microbiome is associated with a variety of metabolites. One study conducted a bidirectional Mendelian randomization analysis of 3,432 Chinese individuals with genome-wide, metagenome-wide, anthropometric and blood metabolite characteristics data (23). This study identified 58 causal relationships between the gut microbiome and blood metabolites and replicated 43 of them, with increased relative abundance of Oscillibacter and the Alistipes phylum in feces being causally associated with lower triglyceride concentrations; conversely, blood metabolites, such as glutamate, appeared to reduce Oxalobacter, while the Aspergillus phylum members were revealed to be affected by metabolites such as 5-methyltetrahydrofolate, alanine, glutamate and selenium. This study illustrates the value of human genetic information to contribute to mechanistic and clinical studies of gut microbiome characterization. Future precision medicine strategies may rely on new diagnostic and therapeutic tools for identifying and correcting microbiota deficiencies that affect treatment outcomes (24).
Detection of intestinal microorganisms and markers
There is a considerable association between the intestinal microbial composition of patients and their clinical response. In one study, stool samples from patients with metastatic melanoma prior to immunotherapy were analyzed and treatment responder samples were found to contain a greater abundance of bacterial species such as Bifidobacterium longum, Collins aerogenes and Enterococcus faecalis (25). After reconstructing the intestinal flora of sterile mice with responder feces, tumor growth slowed down, the T-cell response was enhanced and the anti-PD-L1 therapeutic effect was markedly improved. These results suggest that the IM may possess a mechanism to regulate tumor-controlling immunotherapy in patients with cancer, which is of great importance for the synergistic use of immune checkpoint inhibitors in the treatment of tumors. A further metagenomic study revealed functional differences in gut bacteria in treatment responders, including enrichment in anabolic pathways (26).
Intestinal microbial markers have great advantages in noninvasive tumor detection. The incidence of sporadic young-onset colorectal cancer (yCRC) has been shown to be increasing and the diagnostic value of intestinal microorganisms is still unclear. Noninvasive tumor biomarkers remain an unmet medical need, with the most extensive and in-depth research on gut microbes and CRC (27). Fusobacterium nucleatum is recognized as a risk factor for CRC, which may serve as an early warning and prognostic marker, as well as a preventive and therapeutic target for CRC (28). Yang et al (29) conducted a study and found that the intestinal flora diversity in patients with yCRC was increased and patients with yCRC had unique characteristics of bacterial metabolism. Flavonifractor plautii is an important strain involved in yCRC, whereas Streptococcus is the major strain in old age-onset CRC, suggesting that the assessment of gut microbial markers may be a promising noninvasive oncological test with the potential to accurately detect and differentiate patients with yCRC. The role of gut microbes as diagnostic biomarkers in pancreatic cancer has also been explored (30). Using 16S rRNA sequencing and fluorescence in situ hybridization for detection, Kartal et al (30) found markedly different abundances of Bacteroides, Lactobacillus and Bifidobacterium in healthy and tumor-bearing pancreatic tissues, demonstrating that non-invasive, robust and specific screening based on fecal microbiota is feasible for the early detection of pancreatic ductal adenocarcinoma. In addition to tumors, gut microbial markers have a great advantage in IBD. Lee et al (31) identified fecal macrogenomic, serum metabolomic and proteomic markers that predicted different responses to anti-cytokine or anti-integrin therapy in patients with IBD.
In summary, different disease-associated groups of gut bacterial species may have relevance beyond their diagnostic use, providing promising future entry points for disease prevention and therapeutic interventions.
Clinical application of intestinal microorganisms
As the mechanism of action of the IM in diseases has not been fully revealed, the identification of the IM has not been fully accepted in the current clinical diagnosis or treatment of tumors. The management and treatment of Clostridium difficile-associated disease (32), radiation enteritis related to tumor radiotherapy and IM disorder, exposure to broad-spectrum antibiotics for post-chemotherapy granulocyte deficiency fever (33,34), intractable diarrhea following recent gastrointestinal surgery and fecal transplantation, or probiotic prophylaxis or treatment are among the conditions that necessitate a combination of IM analysis and intervention (35,36).
Furthermore, the IM may affect immune reconstitution after allogeneic hematopoietic stem cell transplantation, serving as an important monitoring indicator for adjusting immune-related strategies after transplantation (2). It may also provide information as to whether a disease is infectious or noninfectious through intestinal bacterial diversity analysis. The correlation of alterations in the gut microbiome with precancerous diseases, such as obesity, diabetes and IBD, may be an important reference for the treatment of specific types of cancer (37).
Human microecology and various disease areas have gained much attention, especially in the field of tumorigenesis, development and the effect on treatment. In addition, research has aimed to assess the role of microecology in the early diagnosis of tumors; the significance of microecology in tumorigenesis, progression and prognosis; and to determine how the respiratory and intestinal flora are transferred to various parts of the body and the inflammatory response they cause (38). Among them, the standardization of microbiome assay techniques, including experimental procedures, quality management and report interpretation, are important for clinical and scientific research and for the identification and determination of microbiota defects before and after treatment (39,40).
3. Technology for the detection of intestinal microbes
Detection methods. Currently, the main methods used to detect intestinal microbes are 16S rRNA sequencing, metagenomic sequencing and full-length gene sequencing based on nanopore sequencing. 16S rRNA sequencing is relatively simple and low cost, whereas metagenomic sequencing covers a more comprehensive range and can identify microorganisms down to the strain level. Due to the cost, 16S rRNA sequencing is more widely used in IM studies. The DNA sequence corresponding to the 16S rRNA, which encodes the small subunit of the prokaryotic ribosome, is present in all prokaryotic genomes and accounts for ~80% of genomic DNA, with a molecular size of ~1,540 bp. The 16S rRNA contains 10 constant regions and nine hypervariable regions; the conserved regions reflect the relatedness between species, whereas the hypervariable regions reflect the differences between species. This feature makes 16S rRNA a standard identification sequence for microbial strain identification. With the rapid development of next-generation sequencing (NGS) technology, an increasing number of microbial 16S rRNA sequences have been determined and included in international genetic databases and 16S rRNA genes have become the most commonly used molecular markers in phylogenetic taxonomic studies and are widely used in microbial ecology research (41). By extracting DNA from samples and specifically by amplifying one or two contiguous hypervariable regions, sequencing the hypervariable regions using a high-throughput sequencing platform and then performing sequence analysis and species annotation by bioinformatics, the sample community composition can be determined. Furthermore, α diversity and β diversity analyses have been performed to compare the variability between samples. Nanopore-based 16S sequencing allows the design of primers to cover the entire 16S gene and even the entire ribosomal manipulator. Nanopore sequencing outperforms traditional sequencing platforms in accurately discriminating more species (42,43).
Metagenomic sequencing refers to the high-throughput sequencing of the genomes of microbial communities in environmental samples, including fungi, viruses and parasites, in addition to bacteria (44). Based on the analysis of microbial diversity, population structure and evolutionary relationships, metagenomic analysis can be used to further explore IM functional activities, interbacterial collaborative relationships and relationships with the environment to uncover potential biological importance (45). Unlike traditional microbial research methods, metagenomic sequencing lacks the limitations of microbial isolation and culture, overcomes the disadvantage that unknown microorganisms cannot be detected and expands the opportunities for microbial detection and utilization; therefore, it has been widely used in microbiomics research in recent years (46).
It is recommended that in specific patients (such as patients with Clostridium difficile infection, or diarrhea due to the application of broad-spectrum antibiotics or due to agranulocytosis after chemotherapy and patients who are planning to undergo fecal transplantation or probiotic prophylaxis/treatment), in-depth microbial detection be performed (4,47). Notably, 16S rRNA sequencing used for this purpose is relatively simple and primers are designed by combining a conserved region and a hypervariable region at low cost. The analysis of some areas with categorical information outside the amplicon being analyzed may show low resolution during identification. Nanopore-based technologies for 16S rRNA sequencing and metagenomic sequencing can be used to distinguish between closely related species and have advantages in resolving repetitive regions and structural variants (48). However, the error rate of nanopore sequencing is relatively high, which is expected to be improved as the technology continues to advance.
Detection process
The process used to evaluate the IM is complex, involving specimen collection and management, nucleic acid extraction, library preparation, online sequencing, data analysis and quality control. It has been proposed that multipoint sampling be carried out for specimen collection in the intestine, which can prevent contamination and more truly reflect the microbial situation in the intestine. To ensure the stability of the intestinal flora, it is recommended that an intestinal flora preservation solution be added immediately after sampling, which can rapidly lyse the intestinal flora to achieve a fixative effect and prevent the proliferation of intestinal microbes outside the region, which will greatly affect the original state of the intestinal flora. The preservation solution can generally help the intestinal flora to remain stable at room temperature for 1 week (Fig. 1) (49-51).
Figure 1.
Flow chart of specimen collection.
Nucleic acid extraction
Nucleic acid extraction reagents with confirmed performance should be used and commercial DNA extraction kits are recommended to establish a complete nucleic acid detection process and to ensure the reproducibility and efficiency of the extraction method. The degree of DNA degradation and contamination by various impurities can have an effect on the sensitivity of the assay and criteria for qualified samples are established by measuring nucleic acid concentration, purity and integrity. The operation process strictly adheres to the requirements of aseptic technique and contamination prevention and control is essential for the quality control of specimen test results. Each batch of experiments needs to include an internal reference, a negative control and a positive control. Qualified DNA can be assessed by an A260/A280 ratio of 1.7-1.9 and an A260/A230 ratio of >2 and DNA quality can be verified by 1% agarose gel electrophoresis (no trailing, no stray bands and no protein contamination). DNA integrity can be assessed using an analyzer or other equipment. If the majority of fragments have sizes that are <200 nt, the DNA is considered severely degraded and should be re-extracted (52).
Library preparation
The library preparation process includes nucleic acid fragmentation, end repair, tag-junction ligation and PCR library construction. The library preparation has strict requirements for nucleic acid samples; each extraction of nucleic acid samples needs to be quantified and the starting nucleic acid concentration should be ≥0.1 ng/µl to ensure that the experimental requirements are met. If not, the nucleic acid should be re-extracted or the sample should be sent again. Commonly used library construction methods include enzyme digestion library construction, ultrasonic interruption library construction and transposase library construction. The use of performance-proven library construction reagents or commercial library construction kits is recommended. DNA library quality directly affects the quality of sequencing data; DNA should have an A260/A280 ratio of 1.75-2.00 and a library concentration of ≥1 ng/µl; if these conditions are not met, the library should be reconstructed. In addition, the library fragment size and peak type should be assessed using an Agilent 2100 system or other bioanalytical instruments. The qualified library insert fragment length should be >100 bp and the library should have an obvious main peak, no spurious peaks, no primer dimers and no junctions. If these conditions are not met, the library should be reconstructed or re-extracted and if the sample is still not qualified, the sample should be sent again. Library quantification is now commonly performed by Qubit fluorometry and reverse transcription-quantitative PCR. The real-time fluorescence quantitative PCR method is recommended and NGS quantitative PCR detection kits can be used (53-55).
Onboard sequencing
The NGS sequencing platforms commonly used in domestic laboratories include platforms from Illumina, Inc., Thermo Fisher Scientific, Inc. and MGI Tech Co., Ltd., each of which have different equipment configurations. Before sequencing, the corresponding data parameters need to be determined according to the sequencing platform and the appropriate chip should be chosen according to the length of the sequencing fragment, the number of test specimens, the quality of the specimens and the minimum sequencing depth needed to ensure the data quality of the sequencing results. It is recommended that commercial kits are used. During the testing process, the data obtained, such as the total number of read lengths and the average read length of sequencing, are judged to be reasonable based on indicators such as the capacity of the chip used and the size of the constructed library fragments. Notably, the parameters required by different sequencing platforms may vary (56).
For 16S rRNA sequencing, PCR is commonly used to amplify V2, V3, V4, V6, V7, V8 and V9 highly variable regions of 16S rRNA and the amplification products are quantified and then amplified with specific junctions after end repair to complete the sequencing library construction. The quality control samples for 16S sequencing of the intestinal flora should be confirmed to meet the following requirements: There should be three peaks at ~200, 250 and 300 bp of fragment length. Metagenomic sequencing is performed by randomly interrupting the microbial genome and then amplifying the fragments by adding connectors at both ends of the fragments. The main peaks of the library fragments should be 300-500 bp and the small fragments are spliced into longer sequences by assembly after upstream sequencing. An ion sphere particle density graph and sequencing length histogram are shown in Figs. 2 and 3 (57-59).
Figure 2.
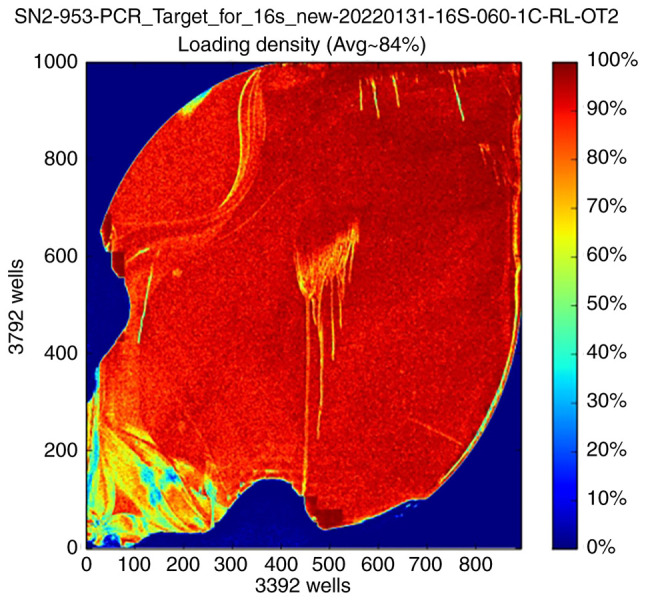
Ion sphere particle density graph. Visualization of the load distribution on the surface of the assay chip: Red indicates the high load region and blue indicates the low load region. SN2-953-PCR-Target-for-16s-new-20220131-16s-060-1C-RL-OT2 is the sequencing pipeline number and sequencing sample naming.
Figure 3.
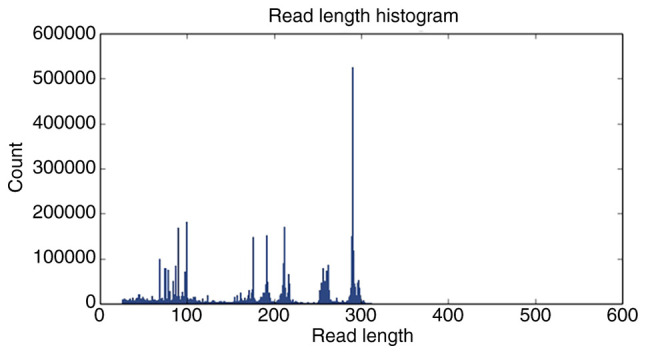
Sequencing sequence length histogram.
4. Bioinformatics analysis
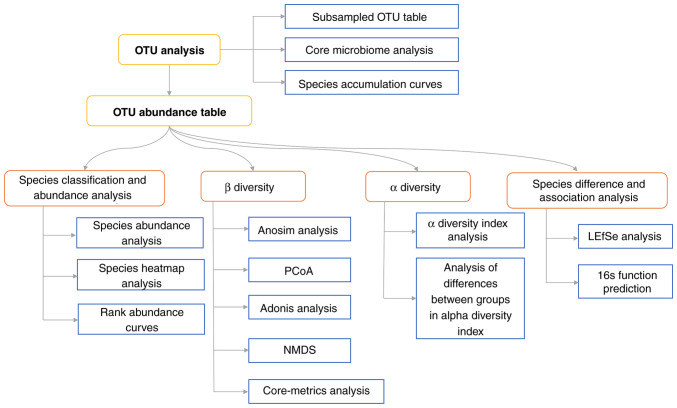
Bioinformatics analysts need to be proficient in NGS testing principles and bioinformatics software operations and should be able to maintain and manage data information, develop new algorithms and update databases. Bioinformatics confidence analysis mainly involves the processing and analysis of raw data, including data quality control, microbial species detection and other processes. At present, there is no unified standardized data analysis procedure and software for IM testing; therefore, researchers can choose to use a commercial automatic analysis system, or laboratories can also choose to synchronize with international algorithms and software to build a laboratory personalized analysis process. The microbial testing database contains genome sequence information for bacteria, fungi, viruses and parasites, with Mycoplasma, Chlamydia, spirochetes and Rickettsia either assessed independently or integrated into the appropriate bacteria category, as appropriate. Public databases require validation for use. The full-length reference genome and sequences with high sequencing quality, sample source information and complete clinical information should be preferentially selected for the construction of microbial databases. Individual microorganisms or nucleic acids that have been identified in specific reagents may also be listed for each reagent used in the process and a database of reagent background microbial sequences should be established and removed from the report (60). The bioinformatics analysis process is shown in Fig. 4.
Figure 4.
Flow chart of bioinformatics analysis. The number of reads corresponding to different samples varies widely and in order to avoid bias in the analysis due to the different sizes of the sequencing data of the samples, we randomly draw a flat process for each sample when the sample reaches a sufficient sequencing depth. Based on the total OTUs of the samples and the species represented by the OTUs, the Core microbiome (the microbiome of the samples with 100% coverage) could be found. OUT, operational taxonomic unit; PCoA, principal coordinates analysis; LEfSe, linear discriminant analysis effect size; NMDS, nonmetric multidimensional scale analysis.
Operational taxonomic unit (OTU) analysis. The original paired end (PE) reads obtained by sequencing have a certain proportion of sequencing errors; therefore, the original data should be filtered before analysis to remove low-quality reads and to obtain valid clean reads. The reads should be stitched into tags according to the overlap relationship between PE reads and further filtering should be performed to obtain target fragments (clean reads). Tags should be clustered into OTUs at a given degree of similarity and then annotated into OTU species to obtain community composition information for each sample. There are a number of advanced methods for OTU clustering analysis. The UCHIME chimera detection algorithm integrates the UPARSE algorithm and the UCHIME algorithm, which is a considerable improvement over the previous clustering methods. In addition to clustering methods, there are noise reduction methods that can be used to generate OTUs (61,62).
The number of reads for each sample varies widely; thus, to avoid bias caused by the different sizes of the sequencing data, each sample should be randomly sampled at a sufficient sequencing depth. The core microbiome (microbiome covering 100% of the sample) can be obtained based on the total number of OTUs and the species represented by the OTUs (Fig. 5) (63).
Figure 5.
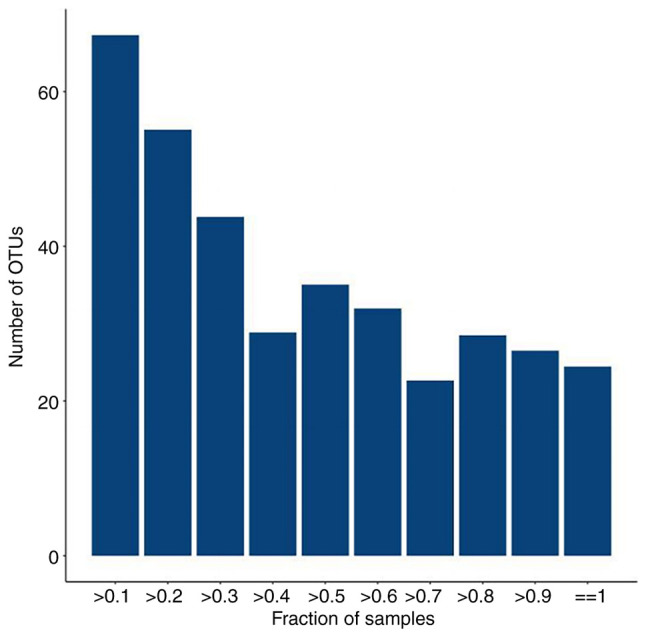
Plot of total number of OTUs vs. number of samples, The horizontal coordinate is the proportion of samples covered and the vertical coordinate is the number of total OTUs with a statistical coverage greater than this proportion of samples, which is represented in the figure as the number of OTUs for samples above a certain proportion of coverage. OUT, operational taxonomic unit.
Species accumulation curves. Species accumulation curves are used to describe the increase in the number of species with increasing sampling size and are a useful tool for investigating species composition and predicting species abundance. They are widely used in biodiversity and community surveys to determine the adequacy of sampling size and to assess species richness (Fig. 6) (64).
Figure 6.
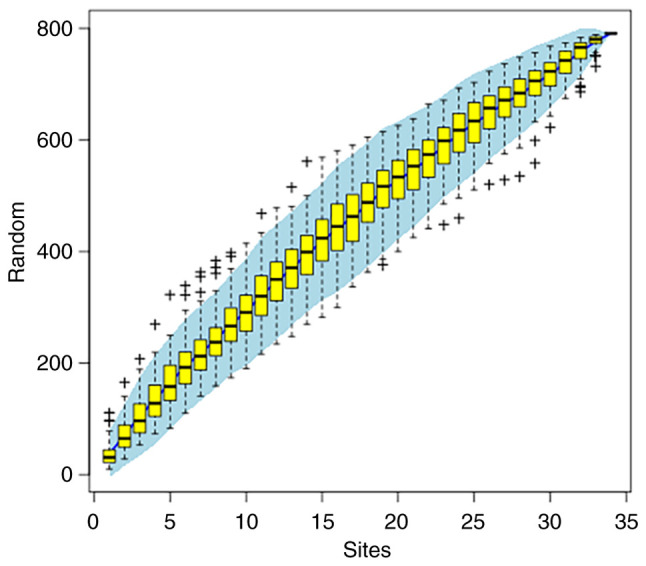
Species accumulation curves. The horizontal coordinate indicates the number of samples and the vertical coordinate indicates the number of OTUs. Whether the sampling amount is sufficient can be determined by the species accumulation curve and under the premise of sufficient sampling volume, species abundance can also be predicted by using the species accumulation curve. OUT, operational taxonomic unit.
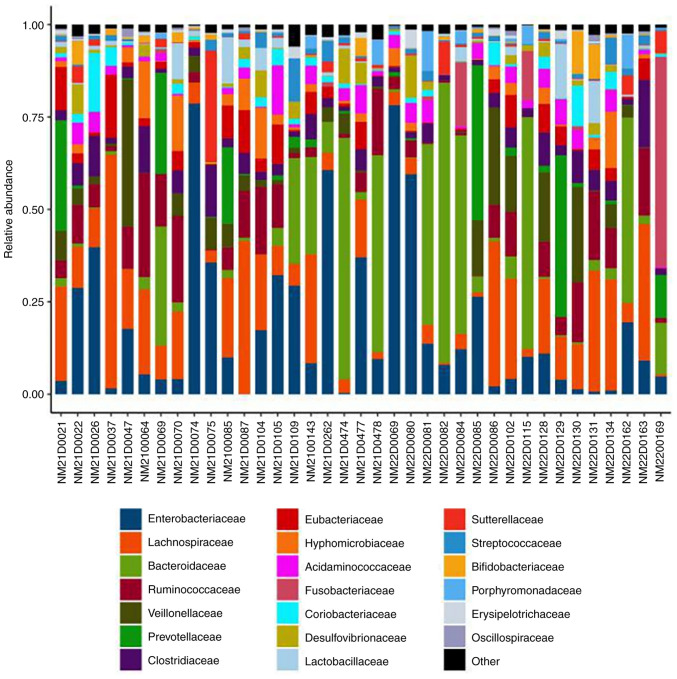
Species abundance analysis. Species abundance analysis is based on the results of species annotation and the corresponding histogram of species profiling is generated for each sample at different levels, which can be used to visualize the species with higher relative abundance and their proportion at different taxonomic levels (Fig. 7) (65).
Figure 7.
Species profiling histograms for samples at different taxonomic levels. The horizontal coordinate is the name of the sample and the vertical coordinate is the relative abundance of the species. Different colors correspond to different species and the length of the color block indicates the relative abundance of the species represented by that color.
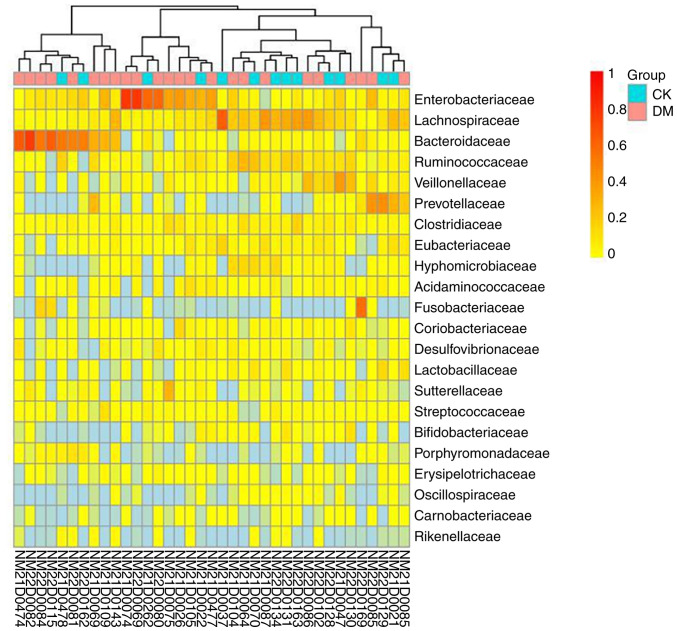
Heatmap clustering analysis. A heatmap is a graphical presentation that represents the magnitude of values in the data matrix as a color gradient and clusters them according to species abundance or sample similarity. Clustering plus grouping information, such as the treatment or sampling environment, enables visualization of clustering of samples from the same or similar environments and directly responds to similarities and differences in the composition of the sample community. Heatmap clustering analysis can be performed separately at different classification levels (Fig. 8) (66).
Figure 8.
Species abundance heat map. Longitudinal clustering indicates how similar the abundance of the species is across samples, with closer distances and shorter branch lengths indicating that the two species are more similar in composition across samples.
α diversity. α diversity is the analysis of species diversity, abundance and richness in a single sample and includes the Observed_species index, Chao1 index, Shannon index and Simpson index. Sample α diversity values can be calculated using relevant software and the corresponding dilution curves can be generated. The dilution curve calculates the expected value of each α diversity index when extracting n (n is less than the total number of measured read sequences) reads, using the known relative proportions of various OTUs in the measured 16S rRNA sequences and then generates a curve according to a set of n values (generally a set of arithmetic progression less than the total number of sequences) and the expected value of the corresponding α diversity index and generates a statistical table of the α diversity index. The Observed_species index indicates the number of OTUs that was actually observed; the Goods_coverage index indicates the sequencing depth; the Chao1 index is used to measure species abundance, i.e., the number of species present; and the Shannon and Simpson indices are used to estimate microbial community diversity. Notably, the larger the Shannon index is, the higher the diversity (67,68).
To assess the difference between α diversity indices, a rank sum test can be performed to assess each index of α diversity (the wilcox.test function in R can be used if two groups of samples are compared and the kruskal.test function in R can be used if more than two groups of samples are compared) (Fig. 9) (69).
Figure 9.
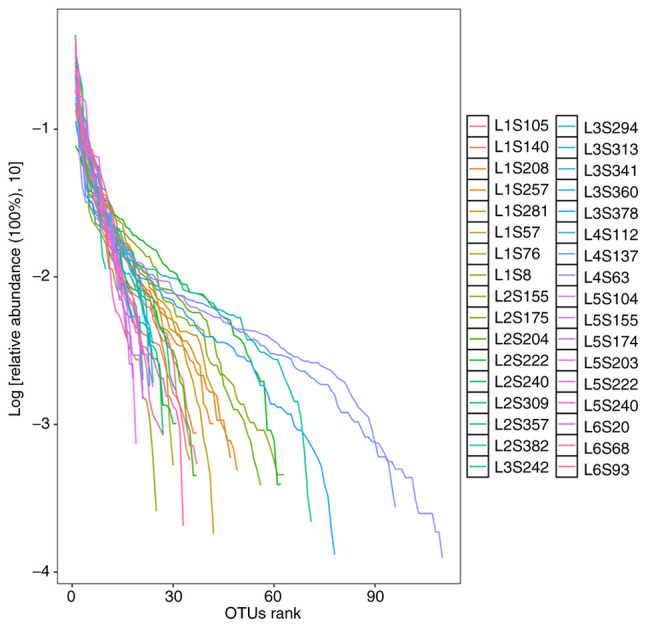
Sample sequencing depth α diversity sparse plot. The horizontal coordinate represents the number of reads extracted and the vertical coordinate represents the corresponding α diversity index value. Different colors in the graph represent different groups of samples. When the number of sequencing strips cannot cover the samples, the curve rises; when the number of sequencing strips increases to cover most of the microorganisms in the samples, the curve shows a flat trend.
β diversity. β diversity is a comparison of biodiversity between samples and can be used to compare microbial community composition between samples. Notably, intersample diversity comparisons need to be made, provided that the number of sequences is consistent across samples. The degree of variation in species abundance distribution between samples can be quantified and analyzed using statistics. The distance between two samples can be calculated using the statistical algorithm to obtain a distance matrix, which can be used for subsequent β diversity analysis and visual statistical analysis. Bray Curtis, Weighted Unifrac and Unweighted Unifrac distances can be calculated based on sample OTU abundance information, in order to assess differences in microbial community composition between samples (Fig. 10) (66).
Figure 10.
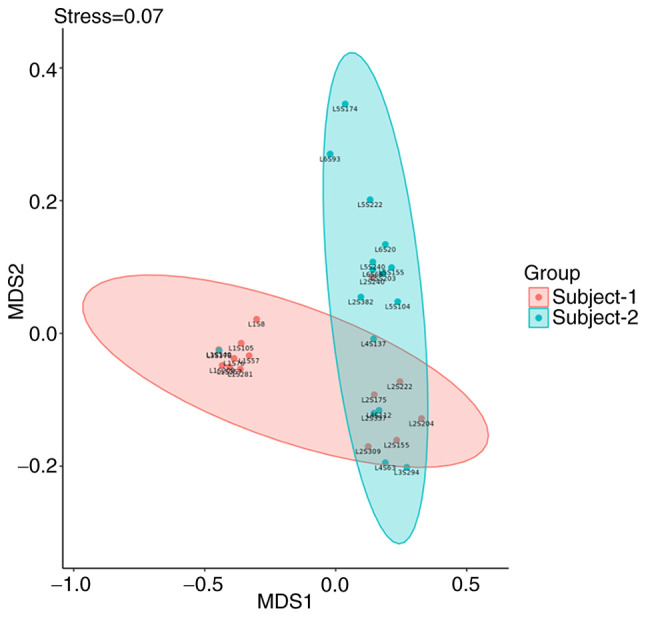
Sample sequencing depth alpha diversity sparse plot. The horizontal coordinate represents the number of reads extracted and the vertical coordinate represents the corresponding alpha diversity index value. Different colors in the graph represent different groups of samples. When the number of sequencing strips cannot cover the samples, the curve rises; when the number of sequencing strips increases to cover most of the microorganisms in the samples, the curve shows a flat trend.
ANOSIM similarity analysis. ANOSIM similarity analysis is a nonparametric test used to determine whether the difference between two or more groups is markedly greater than the difference within groups and can thus determine whether the grouping is significant (70).
Principal coordinates analysis (PCoA). To further demonstrate the differences in species diversity between samples, PCoA can be used to determine the magnitude of differences between samples. In a PCoA assessment of species diversity between samples, the presence of two samples that are close to each other indicates that the species composition of the two samples is similar. A PCoA graph is shown in Fig. 11 (71).
Figure 11.
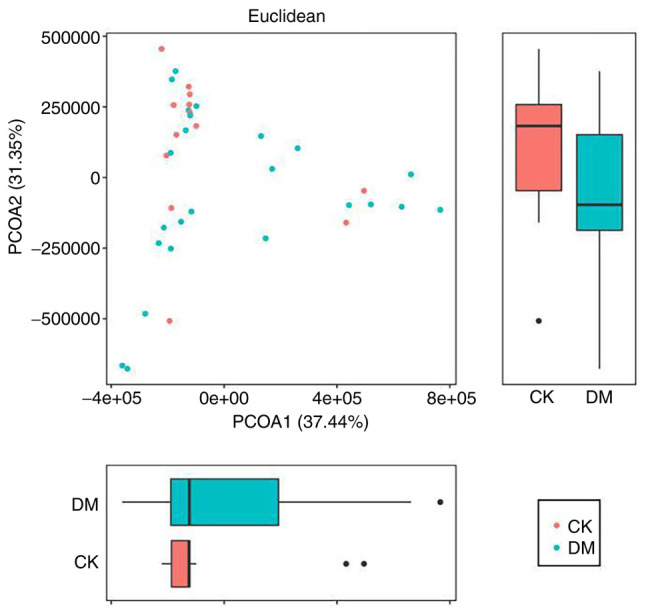
Principal coordinates analysis graph. The horizontal and vertical coordinates indicate the first and second principal coordinates, respectively; the percentages indicate the contribution of the corresponding principal coordinates to the difference between the samples; the P-value indicates the degree of difference between the two groups in the corresponding principal coordinates; the dots indicate the individual samples and the different colors indicate that the samples belong to different groups; the horizontal box plot is the distribution of the values of different groups in the first principal coordinate; the vertical box plot is the distribution of the values of different groups in the second principal coordinate.
Nonmetric multidimensional scale analysis (NMDS). In addition to PCoA, to further demonstrate the differences in β diversity between samples, the magnitude of the differences between samples can be demonstrated by NMDS. The NMDS results for β diversity between samples that are closer together indicate that the species composition of the two samples is similar. A NMDS graph is shown in Fig. 12 (71).
Figure 12.
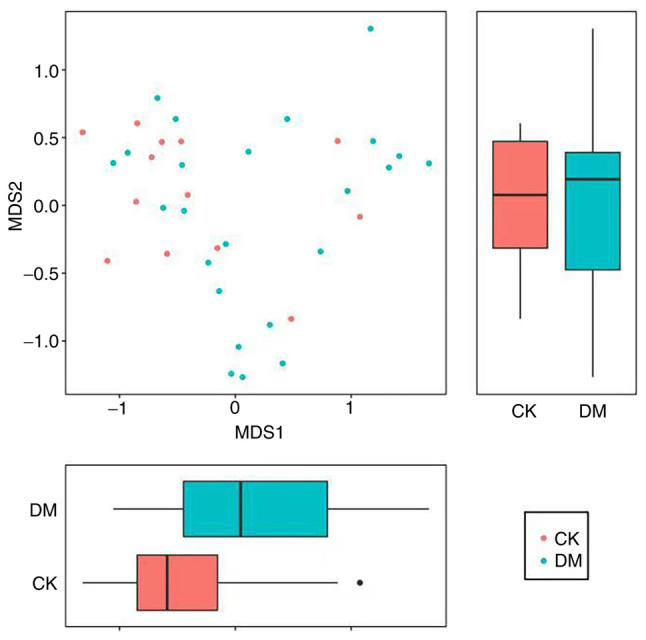
NMDS graph. The NMDS is an evaluation of the ranking information of distance values, the sample information on the graph only reflects the distance of data ranking information between samples, but not the real numerical difference, the horizontal and vertical axes do not have weight meaning, the horizontal axis is not necessarily more important than the vertical axis. the overall dimensionality reduction effect of NMDS is judged by the Stress value. Each point indicates each sample, different colors represent different groupings and the distance between points indicates the degree of difference. NMDS, nonmetric multidimensional scale analysis.
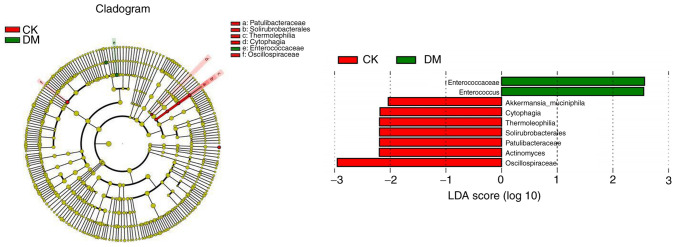
Linear discriminant analysis (LDA) effect size (LEfSe). LEfSe analysis uses LDA to estimate the magnitude of the effect of the abundance of each component (species) on the differential effect and to identify the component species that have a significant differential effect on the sample classification (Fig. 13) (71).
Figure 13.
Nonmetric multidimensional scaling graph. The left figure shows the clustering tree where different colors indicate different subgroups and nodes of different colors indicate microbial taxa that play an important role in the subgroup represented by that color. The yellow nodes indicate the microbial taxa that do not play an important role in the different groupings. The names of the species indicated by the letters in the figure are shown in the legend. The right figure shows the LDA score obtained after counting the microbial taxa that play a significant role in different groupings by LDA. LDA, linear discriminant analysis.
5. Quality control of experimental techniques
Laboratories need to establish and improve quality control systems and to develop corresponding procedure documents, standard operating procedures, internal quality control requirements and record forms and report quality control for each step before, during and after analysis, as well as assessing ‘human, machine, material, method and environment’ factors. The selection of reagents in a kit and the full process requires the consideration of residual nucleic acids from engineered and environmentally contaminated microorganisms and assessment of the impact these factors have on the assay. Internal references and negative and positive controls should be included in each batch of experiments to assess the presence of contamination from handling or the environment in each batch of samples and the presence of abnormalities in the assay process. If the quality control product is not adequate, it is necessary to analyze the reasons for the loss of quality and to take appropriate corrective and preventive measures. If the contamination of reagents or problems with the test procedure are identified in the test, the test should be repeated. Laboratories should regularly participate in IM testing interlaboratory quality evaluation or proficiency testing and if the results are found to be inconsistent, the reasons need to be identified and improvements should be made (72).
6. IM test report form content
The IM detection report should include the total number of sequences, sequencing coverage, sequencing depth, detection method and the technical description of the detection process. As needed, the abundance values of important microorganisms at the phylum, genus and species levels should be displayed and the reference values need to be updated in a timely manner, according to the corresponding databases. NGS has a higher throughput than normal PCR and the results indicate the detection or non-detection of nucleic acid fragments of the corresponding microorganisms in clinical specimens. Clarification of the relationship between the species and the infection needs to be integrated with other test results and clinical manifestations. If microecological variants of unknown importance are detected, this indicates that variants are detected that are currently difficult to define clinically and need to be evaluated in conjunction with clinical judgment. With the advancement of science and technology, it is possible that microecological variants that cannot be clarified at present will be clarified in the future. The detection of normal microecology indicates that the microecological status of the individual can be confirmed as not abnormal, when compared with the normal population in the database. Different regions, ages, dietary differences, medications and comorbidities may affect the level of IM detection and should be reported in conjunction with the appropriate reference information (73).
Overview indicators. The IM overview should contain a graph comparing the levels of microbes in test subjects with healthy individuals of the corresponding age group, the overall risk of IM disorders, diversity, functional core flora, enterotype, results on foodborne pathogenic and other pathogenic bacteria, results on beneficial bacteria, results on neutral bacteria and results on butyric acid-producing bacteria (74).
Bacterial diversity. Based on the diversity data of the flora of a healthy group, the α diversity of the flora of the test subjects can be assessed. When individuals have a similar environment and lifestyle but the IM diversity index is higher in one individual, this suggests that the intestinal tract is richer in microorganisms, the abundance of each species is more homogeneous without a single species occupying the majority and the intestinal flora is healthier (75). Conversely, if the IM diversity index is low due to the absence of a component of the flora, the metabolic pathway responsible for this component of the flora is likely to be absent as well, resulting in metabolic abnormalities. A low diversity index has been shown to increase the risk of bowel diseases, including intestinal dysbiosis, diarrhea, IBD, obesity, prediabetes and CRC (76-78). Therefore, it is important to consume a diverse diet and the use of antibiotics should be reduced. It is recommended that individuals consume more food with high dietary fiber content, supplement with probiotics and prebiotics if necessary, or take microecological interventions, such as enterobacterial transplantation or FMT to improve the diversity of intestinal flora (79).
The functional core flora is involved in energy metabolism and fermentation in the human intestine to produce short-chain fatty acids, which have multiple effects, such as maintaining human health (80). The intestinal pattern is established by the aggregation of different species of bacteria due to preferred communities and is a microcosm of individual characteristics, reflecting the long-term dietary habits of the individual independent of ethnicity, geography, age and sex (81). Some foodborne pathogenic bacteria include Campylobacter jejuni, Clostridium botulinum and Clostridium perfringens. Other common non-foodborne pathogenic bacteria include Helicobacter pylori, Pseudomonas and Acinetobacter. Beneficial bacteria include Bifidobacterium, Lactobacillus and Lactococcus.
Neutrophilic bacteria, also known as conditional pathogens, are widely present in the human intestinal tract. Due to the existence of the human immune system, disease does not normally occur; however, once the human flora is imbalanced, some neutrophilic bacteria, such as Leptotrichia, Brevundimonas and Cloacibacillus, can become conditional pathogens. These pathogens may be associated with bacteremia and timely intervention is required to reduce the risk of surgery if the standard level of bacteria is exceeded before surgery. Furthermore, Holdemania bacteria breakdown intestinal mucus and increase the probability of intestinal pain and are often considered a group of pathogenic bacteria; Rikenellaceae infections cause an increase in the levels of this genus (82). Scardovia abundance has been reported to be markedly increased in the intestine of patients with chronic kidney disease; and the prevalence of Gemmiger (83), Parabacteroides and Paraprevotella may be markedly increased in the intestines of patients with hepatocellular carcinoma and other conditions (84).
Disease-related risks. Studies have shown that changes in the intestinal flora are related to the development of various chronic diseases and the intestinal flora can be used as a biomarker for predicting the efficacy of disease treatment (85,86). Regional differences and age differences need to be considered when establishing models and verifying the reliability of the model. In addition, for the establishment of a baseline of relevant healthy individuals, it is recommended that data from >1,000 healthy individuals be used as a normal reference range and that more than three representative regional populations in China be included. IM-related diseases include colic, autism and asthma in infants (aged from birth to 1 year old); autism, asthma and atopic dermatitis in infants (aged 1-4 years old); gastrointestinal disorders, neurological disorders (autism) and atopic dermatitis in children (aged 5-11 years old); and gastrointestinal disorders, neurological disorders (autism) and atopic dermatitis in adolescents (aged 12-18 years old). In young adults (aged 19-35 years old), these diseases include digestive disorders, neurological disorders (autism and depression), nonalcoholic fatty liver disease, gout and multiple sclerosis; in middle-aged adults (aged 36-59 years old), these diseases include digestive disorders, neurological disorders (autism and depression), cancer (of the lung, stomach, liver and pancreas), nonalcoholic fatty liver disease, gout and multiple sclerosis. In elderly adults (aged ≥60 years old), these diseases include gastrointestinal diseases, neurological diseases (Alzheimer's disease, Parkinson's disease and stroke), cancer (of the lung, stomach, liver and pancreas), nonalcoholic fatty liver disease, gout and multiple sclerosis. In pregnant women (aged 18-45 years old), these diseases include gestational diabetes, preeclampsia, postpartum depression and intrahepatic cholestasis. Notably, gastrointestinal diseases include ulcerative colitis, constipation, intestinal stress syndrome and CRC (87).
Analysis of diet, living habits and nutritional metabolic capacity. The two most abundant phyla in the human intestinal microbiome are Firmicutes and Bacteroides, which account for ~90% of the total population. The Firmicutes/Bacteroides (F/B) ratio can roughly reflect IM balance and can be used to indirectly infer the host diet and metabolic state (88). This ratio is closely related to the host diet and individuals with high-fat, high-sugar and high-protein diets usually have a high F/B ratio, whereas the consumption of high-fiber foods can decrease the F/B ratio. Additionally, it has been reported in the literature that F/B is positively associated with various diseases, such as hypertension and obesity. The IM is notably involved in nutrient metabolism in the intestine, including carbohydrate metabolism, lipid metabolism, amino acid metabolism and vitamin synthesis. By assessing the nutrient metabolism ability of the intestinal flora, test subjects can be guided to adjust their diet and change their lifestyle according to their metabolic condition, with the aim of achieving the goal of improving their health (89).
Bowel age prediction. The microbiome is a precise ‘biological clock’ that can be used to predict the age of most individuals within a few years. This ‘microbiome aging clock’ can be used as a baseline to assess how quickly an individual's gut ages and to determine whether substances, such as alcohol, antibiotics, probiotics or diet, have any effect on longevity (90). It can also be used to compare healthy individuals with individuals who have certain diseases, such as Alzheimer's disease and to assess whether their IM deviates from normal. This analysis may also help to improve understanding of whether certain interventions, including medications and other therapies, have any effect on the aging process. Since the IM varies greatly around the world, IM data from Chinese individuals from different age groups may be used to understand the true biological age and health status of Chinese individuals and their neurodevelopmental status more accurately (91).
7. Conclusion
The ongoing advances in modern science and technology have facilitated the significant improvement of microbiology testing technology, leading to an increasingly in-depth study of microecological methodology. This has been made possible by the gradual substitution of genomics, metabolomics, high-throughput sequencing and genetic engineering technology in the place of more traditional biological research methods, such as direct observation and culture; this has greatly expanded the scope and depth of microecological research (92,93). Human commensal microorganisms and human health have been studied using the 16S rRNA technique in a number of local and international studies; this is due to the rapid development of human microbial high-throughput sequencing technologies in recent years (73,94). Regulation of the microbiome testing industry has frequently been disregarded, despite its potential to improve understanding of the human microbiome and to improve human health. As a result, relevant regulatory agencies should establish uniform standards and requirements for the industry to ensure the validity and utility of testing (95). In light of recent regulatory developments, European clinical geneticists strongly recommend that quality standards for genetic testing be the same as those applied in healthcare settings, which requires the involvement of healthcare professionals (96). The present study systematically described the experimental procedures, quality management and report interpretation of 16S rRNA sequencing technology, thus providing a basis for further in-depth research in the field of intestinal microecology, particularly in light of the current lack of relevant legal regulations in China.
Acknowledgements
Not applicable.
Funding Statement
Funding: The present study was supported by Shenzhen Nanshan District Health System Science and Technology Major Project: Induction of immune tolerance and graft-versus-host disease control program in allogeneic hematopoietic stem cell transplantation (grant no. NSZD2023018) and NHC Key Laboratory of Nuclear Technology Medical Transformation (Mianyang Central Hospital; grant no. 2023HYX034).
Availability of data and materials
The data generated in the present study are included in the figures and/or tables of this article.
Authors' contributions
ZG, QW and YL wrote and revised the paper. Data authentication is not applicable. All authors read and approved the final manuscript.
Ethics approval and consent to participate
Not applicable.
Patient consent for publication
Not applicable.
Competing interests
The authors declare that they have no competing interests.
References
- 1.Sommer F, Anderson JM, Bharti R, Raes J, Rosenstiel P. The resilience of the intestinal microbiota influences health and disease. Nat Rev Microbiol. 2017;15:630–638. doi: 10.1038/nrmicro.2017.58. [DOI] [PubMed] [Google Scholar]
- 2.Chinese expert consensus on the correlation between intestinal microecology and hematopoietic stem cell transplantation. J Inte Oncol. 2021;48:129–135. Tumor and Microecology Committee of Chinese Anti-Cancer Association. [Google Scholar]
- 3.Khoruts A, Staley C, Sadowsky MJ. Faecal microbiota transplantation for Clostridioides difficile: Mechanisms and pharmacology. Nat Rev Gastroenterol Hepatol. 2021;18:67–80. doi: 10.1038/s41575-020-0350-4. [DOI] [PubMed] [Google Scholar]
- 4.Wang J, Liang J, He M, Xie Q, Wu Q, Shen G, Zhu B, Yu J, Yu L, Tan X, et al. Chinese expert consensus on intestinal microecology and management of digestive tract complications related to tumor treatment (version 2022) J Cancer Res Ther. 2022;18:1835–1844. doi: 10.4103/jcrt.jcrt_1444_22. [DOI] [PubMed] [Google Scholar]
- 5.Chahwan B, Kwan S, Isik A, van Hemert S, Burke C, Roberts L. Gut feelings: A randomised, triple-blind, placebo-controlled trial of probiotics for depressive symptoms. J Affect Disord. 2019;253:317–326. doi: 10.1016/j.jad.2019.04.097. [DOI] [PubMed] [Google Scholar]
- 6.Iida N, Dzutsev A, Stewart CA, Smith L, Bouladoux N, Weingarten RA, Molina DA, Salcedo R, Back T, Cramer S, et al. Commensal bacteria control cancer response to therapy by modulating the tumor microenvironment. Science. 2013;342:967–970. doi: 10.1126/science.1240527. [DOI] [PMC free article] [PubMed] [Google Scholar]
- 7.Expert consensus on clinical application of microecological regulators in China (2020 edition) Chin J Microecol. 2020;32:953–965. Microecology Branch of Chinese Preventive Medicine Association. [Google Scholar]
- 8.Johnson JS, Spakowicz DJ, Hong BY, Petersen LM, Demkowicz P, Chen L, Leopold SR, Hanson BM, Agresta HO, Gerstein M, et al. Evaluation of 16S rRNA gene sequencing for species and strain-level microbiome analysis. Nat Commun. 2019;10(5029) doi: 10.1038/s41467-019-13036-1. [DOI] [PMC free article] [PubMed] [Google Scholar]
- 9.Zhang W, Fan X, Shi H, Li J, Zhang M, Zhao J, Su X. Comprehensive Assessment of 16S rRNA gene amplicon sequencing for microbiome profiling across multiple habitats. Microbiol Spectr. 2023;11(e0056323) doi: 10.1128/spectrum.00563-23. [DOI] [PMC free article] [PubMed] [Google Scholar]
- 10.Rutsch A, Kantsjö JB, Ronchi F. The Gut-Brain axis: How microbiota and host inflammasome influence brain physiology and pathology. Front Immunol. 2020;11(604179) doi: 10.3389/fimmu.2020.604179. [DOI] [PMC free article] [PubMed] [Google Scholar]
- 11.Ansaldo E, Farley TK, Belkaid Y. Control of immunity by the microbiota. Annu Rev Immunol. 2021;39:449–479. doi: 10.1146/annurev-immunol-093019-112348. [DOI] [PubMed] [Google Scholar]
- 12.Viaud S, Saccheri F, Mignot G, Yamazaki T, Daillère R, Hannani D, Enot DP, Pfirschke C, Engblom C, Pittet MJ, et al. The intestinal microbiota modulates the anticancer immune effects of cyclophosphamide. Science. 2013;342:971–976. doi: 10.1126/science.1240537. [DOI] [PMC free article] [PubMed] [Google Scholar]
- 13.Routy B, Le Chatelier E, Derosa L, Duong CPM, Alou MT, Daillère R, Fluckiger A, Messaoudene M, Rauber C, Roberti MP, et al. Gut microbiome influences efficacy of PD-1-based immunotherapy against epithelial tumors. Science. 2028;359:91–97. doi: 10.1126/science.aan3706. [DOI] [PubMed] [Google Scholar]
- 14.Gopalakrishnan V, Spencer CN, Nezi L, Reuben A, Andrews MC, Karpinets TV, Prieto PA, Vicente D, Hoffman K, Wei SC, et al. Gut microbiome modulates response to anti-PD-1 immunotherapy in melanoma patients. Science. 2018;359:97–103. doi: 10.1126/science.aan4236. [DOI] [PMC free article] [PubMed] [Google Scholar]
- 15.Tanoue T, Morita S, Plichta DR, Skelly AN, Suda W, Sugiura Y, Narushima S, Vlamakis H, Motoo I, Sugita K, et al. A defined commensal consortium elicits CD8 T cells and anti-cancer immunity. Nature. 2019;565:600–605. doi: 10.1038/s41586-019-0878-z. [DOI] [PubMed] [Google Scholar]
- 16.Fluckiger A, Daillère R, Sassi M, Sixt BS, Liu P, Loos F, Richard C, Rabu C, Alou MT, Goubet AG, et al. Cross-reactivity between tumor MHC class I-restricted antigens and an enterococcal bacteriophage. Science. 2020;369:936–942. doi: 10.1126/science.aax0701. [DOI] [PubMed] [Google Scholar]
- 17.Sivan A, Corrales L, Hubert N, Williams JB, Aquino-Michaels K, Earley ZM, Benyamin FW, Lei YM, Jabri B, Alegre ML, et al. Commensal Bifidobacterium promotes antitumor immunity and facilitates anti-PD-L1 efficacy. Science. 2015;350:1084–1089. doi: 10.1126/science.aac4255. [DOI] [PMC free article] [PubMed] [Google Scholar]
- 18.Zhang T, Li Q, Cheng L, Buch H, Zhang F. Akkermansia muciniphila is a promising probiotic. Microb Biotechnol. 2019;12:1109–1125. doi: 10.1111/1751-7915.13410. [DOI] [PMC free article] [PubMed] [Google Scholar]
- 19.Donald K, Finlay BB. Early-life interactions between the microbiota and immune system: Impact on immune system development and atopic disease. Nat Rev Immunol. 2023;23:735–748. doi: 10.1038/s41577-023-00874-w. [DOI] [PubMed] [Google Scholar]
- 20.Rinninella E, Raoul P, Cintoni M, Franceschi F, Miggiano GAD, Gasbarrini A, Mele MC. What is the Healthy gut microbiota composition? A changing ecosystem across age, environment, diet, and diseases. Microorganisms. 2019;7(14) doi: 10.3390/microorganisms7010014. [DOI] [PMC free article] [PubMed] [Google Scholar]
- 21.Parikh K, Antanaviciute A, Fawkner-Corbett D, Jagielowicz M, Aulicino A, Lagerholm C, Davis S, Kinchen J, Chen HH, Alham NK, et al. Colonic epithelial cell diversity in health and inflammatory bowel disease. Nature. 2019;567:49–55. doi: 10.1038/s41586-019-0992-y. [DOI] [PubMed] [Google Scholar]
- 22.Yu J, Yin Y, Yu Y, Cheng M, Zhang S, Jiang S, Dong M. Effect of concomitant antibiotics use on patient outcomes and adverse effects in patients treated with ICIs. Immunopharmacol Immunotoxicol. 2023;45:386–394. doi: 10.1080/08923973.2022.2145966. [DOI] [PubMed] [Google Scholar]
- 23.Liu X, Tong X, Zou Y, Lin X, Zhao H, Tian L, Jie Z, Wang Q, Zhang Z, Lu H, et al. Mendelian randomization analyses support causal relationships between blood metabolites and the gut microbiome. Nat Genet. 2022;54:52–61. doi: 10.1038/s41588-021-00968-y. [DOI] [PubMed] [Google Scholar]
- 24.Zitvogel L, Ma Y, Raoult D, Kroemer G, Gajewski TF. The microbiome in cancer immunotherapy: Diagnostic tools and therapeutic strategies. Science. 2018;359:1366–1370. doi: 10.1126/science.aar6918. [DOI] [PubMed] [Google Scholar]
- 25.Matson V, Fessler J, Bao R, Chongsuwat T, Zha Y, Alegre ML, Luke JJ, Gajewski TF. The commensal microbiome is associated with anti-PD-1 efficacy in metastatic melanoma patients. Science. 2018;359:104–108. doi: 10.1126/science.aao3290. [DOI] [PMC free article] [PubMed] [Google Scholar]
- 26.Mager LF, Burkhard R, Pett N, Cooke NCA, Brown K, Ramay H, Paik S, Stagg J, Groves RA, Gallo M, et al. Microbiome-derived inosine modulates response to checkpoint inhibitor immunotherapy. Science. 2020;369:1481–1489. doi: 10.1126/science.abc3421. [DOI] [PubMed] [Google Scholar]
- 27.Kim J, Lee HK. Potential Role of the gut microbiome in colorectal cancer progression. Front Immunol. 2022;12(807648) doi: 10.3389/fimmu.2021.807648. [DOI] [PMC free article] [PubMed] [Google Scholar]
- 28.Wang N, Fang JY. Fusobacterium nucleatum, a key pathogenic factor and microbial biomarker for colorectal cancer. Trends Microbiol. 2023;31:159–172. doi: 10.1016/j.tim.2022.08.010. [DOI] [PubMed] [Google Scholar]
- 29.Yang Y, Du L, Shi D, Kong C, Liu J, Liu G, Li X, Ma Y. Dysbiosis of human gut microbiome in young-onset colorectal cancer. Nat Commun. 2021;12(6757) doi: 10.1038/s41467-021-27112-y. [DOI] [PMC free article] [PubMed] [Google Scholar]
- 30.Kartal E, Schmidt TSB, Molina-Montes E, Rodríguez-Perales S, Wirbel J, Maistrenko OM, Akanni WA, Alashkar Alhamwe B, Alves RJ, Carrato A, et al. A faecal microbiota signature with high specificity for pancreatic cancer. Gut. 2022;71:1359–1372. doi: 10.1136/gutjnl-2021-324755. [DOI] [PMC free article] [PubMed] [Google Scholar]
- 31.Lee JWJ, Plichta D, Hogstrom L, Borren NZ, Lau H, Gregory SM, Tan W, Khalili H, Clish C, Vlamakis H, et al. Multi-omics reveal microbial determinants impacting responses to biologic therapies in inflammatory bowel disease. Cell Host Microbe. 2021;29:1294–1304. doi: 10.1016/j.chom.2021.06.019. [DOI] [PMC free article] [PubMed] [Google Scholar]
- 32.Young VB. The role of the microbiome in human health and disease: An introduction for clinicians. BMJ. 2017;356(j831) doi: 10.1136/bmj.j831. [DOI] [PubMed] [Google Scholar]
- 33.Jian Y, Zhang D, Liu M, Wang Y, Xu ZX. The impact of gut microbiota on radiation-induced enteritis. Front Cell Infect Microbiol. 2021;11(586392) doi: 10.3389/fcimb.2021.586392. [DOI] [PMC free article] [PubMed] [Google Scholar]
- 34.Wang L, Wang X, Zhang G, Ma Y, Zhang Q, Li Z, Ran J, Hou X, Geng Y, Yang Z, et al. The impact of pelvic radiotherapy on the gut microbiome and its role in radiation-induced diarrhoea: A systematic review. Radiat Oncol. 2021;16(187) doi: 10.1186/s13014-021-01899-y. [DOI] [PMC free article] [PubMed] [Google Scholar]
- 35.Samarkos M, Mastrogianni E, Kampouropoulou O. The role of gut microbiota in Clostridium difficile infection. Eur J Intern Med. 2018;50:28–32. doi: 10.1016/j.ejim.2018.02.006. [DOI] [PubMed] [Google Scholar]
- 36.Shogbesan O, Poudel DR, Victor S, Jehangir A, Fadahunsi O, Shogbesan G, Donato A. A systematic review of the efficacy and safety of fecal microbiota transplant for clostridium difficile infection in immunocompromised patients. Can J Gastroenterol Hepatol. 2018;2018(1394379) doi: 10.1155/2018/1394379. [DOI] [PMC free article] [PubMed] [Google Scholar]
- 37.Boulangé CL, Neves AL, Chilloux J, Nicholson JK, Dumas ME. Impact of the gut microbiota on inflammation, obesity, and metabolic disease. Genome Med. 2016;8(42) doi: 10.1186/s13073-016-0303-2. [DOI] [PMC free article] [PubMed] [Google Scholar]
- 38.Li S, He M, Lei Y, Liu Y, Li X, Xiang X, Wu Q, Wang Q. Oral microbiota and Tumor-A new perspective of tumor pathogenesis. Microorganisms. 2022;10(2206) doi: 10.3390/microorganisms10112206. [DOI] [PMC free article] [PubMed] [Google Scholar]
- 39.Diakite A, Dubourg G, Dione N, Afouda P, Bellali S, Ngom II, Valles C, Tall ML, Lagier JC, Raoult D. Optimization and standardization of the culturomics technique for human microbiome exploration. Sci Rep. 2020;10(9674) doi: 10.1038/s41598-020-66738-8. [DOI] [PMC free article] [PubMed] [Google Scholar]
- 40.Goren E, Wang C, He Z, Sheflin AM, Chiniquy D, Prenni JE, Tringe S, Schachtman DP, Liu P. Feature selection and causal analysis for microbiome studies in the presence of confounding using standardization. BMC Bioinformatics. 2021;22(362) doi: 10.1186/s12859-021-04232-2. [DOI] [PMC free article] [PubMed] [Google Scholar]
- 41.Laudadio I, Fulci V, Palone F, Stronati L, Cucchiara S, Carissimi C. Quantitative assessment of shotgun metagenomics and 16S rRNA amplicon sequencing in the study of human gut microbiome. OMICS. 2018;22:248–254. doi: 10.1089/omi.2018.0013. [DOI] [PubMed] [Google Scholar]
- 42.Kryukov K, Imanishi T, Nakagawa S. Nanopore sequencing data analysis of 16S rRNA genes using the GenomeSync-GSTK system. Methods Mol Biol. 2023;2632:215–226. doi: 10.1007/978-1-0716-2996-3_15. [DOI] [PubMed] [Google Scholar]
- 43.Zhang T, Li H, Ma S, Cao J, Liao H, Huang Q, Chen W. The newest oxford Nanopore R10.4.1 full-length 16S rRNA sequencing enables the accurate resolution of species-level microbial community profiling. Appl Environ Microbiol. 2023;89(e0060523) doi: 10.1128/aem.00605-23. [DOI] [PMC free article] [PubMed] [Google Scholar]
- 44.Deng X, Achari A, Federman S, Yu G, Somasekar S, Bártolo I, Yagi S, Mbala-Kingebeni P, Kapetshi J, Ahuka-Mundeke S, et al. Metagenomic sequencing with spiked primer enrichment for viral diagnostics and genomic surveillance. Nat Microbiol. 2020;5:443–454. doi: 10.1038/s41564-019-0637-9. [DOI] [PMC free article] [PubMed] [Google Scholar]
- 45.Shi Y, Wang G, Lau HC, Yu J. Metagenomic sequencing for Microbial DNA in human samples: Emerging technological advances. Int J Mol Sci. 2022;23(2181) doi: 10.3390/ijms23042181. [DOI] [PMC free article] [PubMed] [Google Scholar]
- 46.Qin J, Li R, Raes J, Arumugam M, Burgdorf KS, Manichanh C, Nielsen T, Pons N, Levenez F, Yamada T, et al. A human gut microbial gene catalogue established by metagenomic sequencing. Nature. 2010;464:59–65. doi: 10.1038/nature08821. [DOI] [PMC free article] [PubMed] [Google Scholar]
- 47.Johnson S, Lavergne V, Skinner AM, Gonzales-Luna AJ, Garey KW, Kelly CP, Wilcox MH. Clinical practice guideline by the infectious diseases society of America (IDSA) and society for healthcare epidemiology of America (SHEA): 2021 Focused update guidelines on management of clostridioides difficile infection in adults. Clin Infect Dis. 2021;73:e1029–e1044. doi: 10.1093/cid/ciab549. [DOI] [PubMed] [Google Scholar]
- 48.Eltokhy MA, Saad BT, Eltayeb WN, El-Ansary MR, Aboshanab KM, Ashour MSE. A metagenomic nanopore sequence analysis combined with conventional screening and spectroscopic methods for deciphering the antimicrobial metabolites produced by alcaligenes faecalis soil isolate MZ921504. Antibiotics (Basel) 2021;10(1382) doi: 10.3390/antibiotics10111382. [DOI] [PMC free article] [PubMed] [Google Scholar]
- 49.Guan H, Pu Y, Liu C, Lou T, Tan S, Kong M, Sun Z, Mei Z, Qi Q, Quan Z, et al. Comparison of fecal collection methods on variation in gut metagenomics and untargeted metabolomics. mSphere. 2021;6(e0063621) doi: 10.1128/mSphere.00636-21. [DOI] [PMC free article] [PubMed] [Google Scholar]
- 50.Mordant A, Kleiner M. Evaluation of sample preservation and storage methods for metaproteomics analysis of intestinal microbiomes. Microbiol Spectr. 2021;9(e0187721) doi: 10.1128/Spectrum.01877-21. [DOI] [PMC free article] [PubMed] [Google Scholar]
- 51.Haindl R, Totzauer L, Kulozik U. Preservation by lyophilization of a human intestinal microbiota: Influence of the cultivation pH on the drying outcome and re-establishment ability. Microb Biotechnol. 2022;15:886–900. doi: 10.1111/1751-7915.14007. [DOI] [PMC free article] [PubMed] [Google Scholar]
- 52.China Preventive Medicine Association. General Guidelines for Pathogen Screening based on High-throughput Sequencing (T/CMPA 010-2020) J Pathogen Biology. 2021;16:738–740. [Google Scholar]
- 53.Xiao W, Ren L, Chen Z, Fang LT, Zhao Y, Lack J, Guan M, Zhu B, Jaeger E, Kerrigan L, et al. Toward best practice in cancer mutation detection with whole-genome and whole-exome sequencing. Nat Biotechnol. 2021;39:1141–1150. doi: 10.1038/s41587-021-00994-5. [DOI] [PMC free article] [PubMed] [Google Scholar]
- 54.Poulsen CS, Ekstrøm CT, Aarestrup FM, Pamp SJ. Library preparation and sequencing platform introduce bias in metagenomic-based characterizations of microbiomes. Microbiol Spectr. 2022;10(e0009022) doi: 10.1128/spectrum.00090-22. [DOI] [PMC free article] [PubMed] [Google Scholar]
- 55.Kong N, Ng W, Thao K, Agulto R, Weis A, Kim KS, Korlach J, Hickey L, Kelly L, Lappin S, Weimer BC. Automation of PacBio SMRTbell NGS library preparation for bacterial genome sequencing. Stand Genomic Sci. 2017;12(27) doi: 10.1186/s40793-017-0239-1. [DOI] [PMC free article] [PubMed] [Google Scholar]
- 56.Sanschagrin S, Yergeau E. Next-generation sequencing of 16S ribosomal RNA gene amplicons. J Vis Exp. 2014;29(51709) doi: 10.3791/51709. [DOI] [PMC free article] [PubMed] [Google Scholar]
- 57.Matsuo Y. Full-Length 16S rRNA gene analysis using Long-Read nanopore sequencing for rapid identification of bacteria from clinical specimens. Methods Mol Biol. 2023;2632:193–213. doi: 10.1007/978-1-0716-2996-3_14. [DOI] [PubMed] [Google Scholar]
- 58.Jin J, Yamamoto R, Shiroguchi K. High-throughput identification and quantification of bacterial cells in the microbiota based on 16S rRNA sequencing with single-base accuracy using BarBIQ. Nat Protoc. 2024;9:207–239. doi: 10.1038/s41596-023-00906-8. [DOI] [PubMed] [Google Scholar]
- 59.Ranjan R, Rani A, Metwally A, McGee HS, Perkins DL. Analysis of the microbiome: Advantages of whole genome shotgun versus 16S amplicon sequencing. Biochem Biophys Res Commun. 2016;469:967–977. doi: 10.1016/j.bbrc.2015.12.083. [DOI] [PMC free article] [PubMed] [Google Scholar]
- 60.Expert Consensus on the standardization of clinical application of high-throughput metagenomic sequencing technology to detect pathogenic microorganisms. Chin J Laboratory Med. 2020;43:1181–1195. Laboratory Medicine Branch of Chinese Medical Association. [Google Scholar]
- 61.Nash AK, Auchtung TA, Wong MC, Smith DP, Gesell JR, Ross MC, Stewart CJ, Metcalf GA, Muzny DM, Gibbs RA, et al. The gut mycobiome of the human microbiome project healthy cohort. Microbiome. 2017;5(153) doi: 10.1186/s40168-017-0373-4. [DOI] [PMC free article] [PubMed] [Google Scholar]
- 62.Huang C, Callahan BJ, Wu MC, Holloway ST, Brochu H, Lu W, Peng X, Tzeng JY. Phylogeny-guided microbiome OTU-specific association test (POST) Microbiome. 2022;10(86) doi: 10.1186/s40168-022-01266-3. [DOI] [PMC free article] [PubMed] [Google Scholar]
- 63.Mokhtari EB, Ridenhour BJ. Filtering ASVs/OTUs via mutual information-based microbiome network analysis. BMC Bioinformatics. 2022;23(380) doi: 10.1186/s12859-022-04919-0. [DOI] [PMC free article] [PubMed] [Google Scholar]
- 64.Mao CX, Li J. Comparing species assemblages via species accumulation curves. Biometrics. 2009;65:1063–1067. doi: 10.1111/j.1541-0420.2008.01182.x. [DOI] [PubMed] [Google Scholar]
- 65.Sæther BE, Engen S, Grøtan V. Species diversity and community similarity in fluctuating environments: Parametric approaches using species abundance distributions. J Anim Ecol. 2013;82:721–738. doi: 10.1111/1365-2656.12068. [DOI] [PubMed] [Google Scholar]
- 66.Shahi SK, Zarei K, Guseva NV, Mangalam AK. doi: 10.3791/59980. Microbiota analysis using Two-step PCR and Next-generation 16S rRNA gene sequencing. J Vis Exp: Oct 15, 2019 doi: 10.3791/59980. [DOI] [PMC free article] [PubMed] [Google Scholar]
- 67.Xun W, Li W, Xiong W, Ren Y, Liu Y, Miao Y, Xu Z, Zhang N, Shen Q, Zhang R. Diversity-triggered deterministic bacterial assembly constrains community functions. Nat Commun. 2019;10(3833) doi: 10.1038/s41467-019-11787-5. [DOI] [PMC free article] [PubMed] [Google Scholar]
- 68.Wilmanski T, Rappaport N, Earls JC, Magis AT, Manor O, Lovejoy J, Omenn GS, Hood L, Gibbons SM, Price ND. Blood metabolome predicts gut microbiome α-diversity in humans. Nat Biotechnol. 2019;37:1217–1228. doi: 10.1038/s41587-019-0233-9. [DOI] [PubMed] [Google Scholar]
- 69. R Core Team (RELEASE YEAR-year version of R used was released). R: A language and environment for statistical computing. R Foundation for Statistical Computing, Vienna, Austria. [Google Scholar]
- 70.Yu X, Jiang W, Kosik RO, Song Y, Luo Q, Qiao T, Tong J, Liu S, Deng C, Qin S, et al. Gut microbiota changes and its potential relations with thyroid carcinoma. J Adv Res. 2021;35:61–70. doi: 10.1016/j.jare.2021.04.001. [DOI] [PMC free article] [PubMed] [Google Scholar]
- 71.Yu X, Jiang W, Kosik RO, Song Y, Luo Q, Qiao T, Tong J, Liu S, Deng C, Qin S, et al. Gut microbiota changes and its potential relations with thyroid carcinoma. J Adv Res. 2021;35:61–70. doi: 10.1016/j.jare.2021.04.001. [DOI] [PMC free article] [PubMed] [Google Scholar]
- 72.Schlaberg R. Microbiome Diagnostics. Clin Chem. 2020;66:68–76. doi: 10.1373/clinchem.2019.303248. [DOI] [PubMed] [Google Scholar]
- 73.Bharti R, Grimm DG. Current challenges and best-practice protocols for microbiome analysis. Brief Bioinform. 2021;22:178–193. doi: 10.1093/bib/bbz155. [DOI] [PMC free article] [PubMed] [Google Scholar]
- 74.Aly AM, Adel A, El-Gendy AO, Essam TM, Aziz RK. Gut microbiome alterations in patients with stage 4 hepatitis C. Gut Pathog. 2016;8(42) doi: 10.1186/s13099-016-0124-2. [DOI] [PMC free article] [PubMed] [Google Scholar]
- 75.Gao Y, Wu M. Accounting for 16S rRNA copy number prediction uncertainty and its implications in bacterial diversity analyses. ISME Commun. 2023;3(59) doi: 10.1038/s43705-023-00266-0. [DOI] [PMC free article] [PubMed] [Google Scholar]
- 76.Karpiński TM, Ożarowski M, Stasiewicz M. Carcinogenic microbiota and its role in colorectal cancer development. Semin Cancer Biol. 2022;86:420–430. doi: 10.1016/j.semcancer.2022.01.004. [DOI] [PubMed] [Google Scholar]
- 77.Lee M, Chang EB. Inflammatory bowel diseases (IBD) and the Microbiome-Searching the crime scene for clues. Gastroenterology. 2021;160:524–537. doi: 10.1053/j.gastro.2020.09.056. [DOI] [PMC free article] [PubMed] [Google Scholar]
- 78.Aron-Wisnewsky J, Warmbrunn MV, Nieuwdorp M, Clément K. Metabolism and metabolic disorders and the microbiome: The intestinal microbiota associated with obesity, lipid metabolism, and metabolic Health-Pathophysiology and therapeutic strategies. Gastroenterology. 2021;160:573–599. doi: 10.1053/j.gastro.2020.10.057. [DOI] [PubMed] [Google Scholar]
- 79.Youssef NH, Couger MB, McCully AL, Criado AE, Elshahed MS. Assessing the global phylum level diversity within the bacterial domain: A review. J Adv Res. 2015;6:269–282. doi: 10.1016/j.jare.2014.10.005. [DOI] [PMC free article] [PubMed] [Google Scholar]
- 80.Zou X, Wang L, Xiao L, Wang S, Zhang L. Gut microbes in cerebrovascular diseases: Gut flora imbalance, potential impact mechanisms and promising treatment strategies. Front Immunol. 2022;13(975921) doi: 10.3389/fimmu.2022.975921. [DOI] [PMC free article] [PubMed] [Google Scholar]
- 81.Adak A, Khan MR. An insight into gut microbiota and its functionalities. Cell Mol Life Sci. 2019;76:473–493. doi: 10.1007/s00018-018-2943-4. [DOI] [PMC free article] [PubMed] [Google Scholar]
- 82.Dash NR, Khoder G, Nada AM, Al Bataineh MT. Exploring the impact of Helicobacter pylori on gut microbiome composition. PLoS One. 2019;14(e0218274) doi: 10.1371/journal.pone.0218274. [DOI] [PMC free article] [PubMed] [Google Scholar]
- 83.Lun H, Yang W, Zhao S, Jiang M, Xu M, Liu F, Wang Y. Altered gut microbiota and microbial biomarkers associated with chronic kidney disease. Microbiologyopen. 2019;8(e00678) doi: 10.1002/mbo3.678. [DOI] [PMC free article] [PubMed] [Google Scholar]
- 84.Ren Z, Li A, Jiang J, Zhou L, Yu Z, Lu H, Xie H, Chen X, Shao L, Zhang R, et al. Gut microbiome analysis as a tool towards targeted non-invasive biomarkers for early hepatocellular carcinoma. Gut. 2019;68:1014–1023. doi: 10.1136/gutjnl-2017-315084. [DOI] [PMC free article] [PubMed] [Google Scholar]
- 85.Wang Q, Lei Y, Wang J, Xu X, Wang L, Zhou H, Guo Z. Expert consensus on the relevance of intestinal microecology and hematopoietic stem cell transplantation. Clin Transplant. 2023;38(e15186) doi: 10.1111/ctr.15186. Tumor and Microecology Committee of China Anti-Cancer Association. [DOI] [PubMed] [Google Scholar]
- 86.Li S, Wang T, Ren Y, Liu Z, Gao J, Guo Z. Prognostic impact of oral microbiome on survival of malignancies: A systematic review and meta-analysis. Syst Rev. 2024;13(41) doi: 10.1186/s13643-023-02419-7. [DOI] [PMC free article] [PubMed] [Google Scholar]
- 87.Lu J, Zhang L, Zhai Q, Zhao J, Zhang H, Lee YK, Lu W, Li M, Chen W. Chinese gut microbiota and its associations with staple food type, ethnicity, and urbanization. NPJ Biofilms Microbiomes. 2021;7(71) doi: 10.1038/s41522-021-00245-0. [DOI] [PMC free article] [PubMed] [Google Scholar]
- 88.Yang Q, Liang Q, Balakrishnan B, Belobrajdic DP, Feng QJ, Zhang W. Role of dietary nutrients in the modulation of gut microbiota: A narrative review. Nutrients. 2020;12(381) doi: 10.3390/nu12020381. [DOI] [PMC free article] [PubMed] [Google Scholar]
- 89.Corbin KD, Carnero EA, Dirks B, Igudesman D, Yi F, Marcus A, Davis TL, Pratley RE, Rittmann BE, Krajmalnik-Brown R, Smith SR. Host-diet-gut microbiome interactions influence human energy balance: A randomized clinical trial. Nat Commun. 2023;14(3161) doi: 10.1038/s41467-023-38778-x. [DOI] [PMC free article] [PubMed] [Google Scholar]
- 90.Jacobs JP, Lagishetty V, Hauer MC, Labus JS, Dong TS, Toma R, Vuyisich M, Naliboff BD, Lackner JM, Gupta A, et al. Multi-omics profiles of the intestinal microbiome in irritable bowel syndrome and its bowel habit subtypes. Microbiome. 2023;11(5) doi: 10.1186/s40168-022-01450-5. [DOI] [PMC free article] [PubMed] [Google Scholar]
- 91.He J, Chu Y, Li J, Meng Q, Liu Y, Jin J, Wang Y, Wang J, Huang B, Shi L, et al. Intestinal butyrate-metabolizing species contribute to autoantibody production and bone erosion in rheumatoid arthritis. Sci Adv. 2022;8(eabm1511) doi: 10.1126/sciadv.abm1511. [DOI] [PMC free article] [PubMed] [Google Scholar]
- 92.Rhoads DD, Sintchenko V, Rauch CA, Pantanowitz L. Clinical microbiology informatics. Clin Microbiol Rev. 2014;27:1025–1047. doi: 10.1128/CMR.00049-14. [DOI] [PMC free article] [PubMed] [Google Scholar]
- 93.Patel R. New developments in clinical bacteriology laboratories. Mayo Clin Proc. 2016;91:1448–1459. doi: 10.1016/j.mayocp.2016.06.020. [DOI] [PMC free article] [PubMed] [Google Scholar]
- 94.Rozas M, Brillet F, Callewaert C, Paetzold B. MinION™ nanopore sequencing of skin microbiome 16S and 16S-23S rRNA gene amplicons. Front Cell Infect Microbiol. 2022;11(806476) doi: 10.3389/fcimb.2021.806476. [DOI] [PMC free article] [PubMed] [Google Scholar]
- 95.Hoffmann DE, von Rosenvinge EC, Roghmann MC, Palumbo FB, McDonald D, Ravel J. The DTC microbiome testing industry needs more regulation. Science. 2024;383:1176–1179. doi: 10.1126/science.adk4271. [DOI] [PubMed] [Google Scholar]
- 96.Kalokairinou L, Borry P, Howard HC. ‘It's much more grey than black and white’: Clinical geneticists’ views on the oversight of consumer genomics in Europe. Per Med. 2020;17:129–140. doi: 10.2217/pme-2019-0064. [DOI] [PubMed] [Google Scholar]
Associated Data
This section collects any data citations, data availability statements, or supplementary materials included in this article.
Data Availability Statement
The data generated in the present study are included in the figures and/or tables of this article.


