

Abstract
Background
Familial Partial Lipodystrophy (FPLD) is a disease with wide clinical and genetic variation, with seven different subtypes described. Until genetic testing becomes feasible in clinical practice, non-invasive tools are used to evaluate body composition in lipodystrophic patients. This study aimed to analyze the different anthropometric parameters used for screening and diagnosis of FPLD, such as thigh skinfold thickness (TS), Köb index (Köbi), leg fat percentage (LFP), fat mass ratio (FMR) and leg-to-total fat mass ratio in grams (LTR), by dual-energy X-ray absorptiometry, focusing on determining cutoff points for TS and LFP within a Brazilian population.
Methods
Thirty-seven patients with FPLD and seventy-four healthy controls matched for body mass index, sex and age were studied. Data were collected through medical record review after signing informed consent. All participants had body fat distribution evaluated by skinfolds and DXA measures. Fasting blood samples were collected to evaluate glycemic and lipid profiles. Genetic studies were carried out on all patients. Two groups were categorized based on genetic testing and/or anthropometric characteristics: FPLD+ (positive genetic test) and FPLD1 (negative genetic testing, but positive clinical/anthropometric criteria for FPLD).
Results
Eighteen (48.6%) patients were classified as FPLD+, and 19 (51.4%) as FPLD1. Unlike what is described in the literature, the LMNA variant in codon 582 was the most common. Among the main diagnostic parameters of FPLD, a statistical difference was observed between the groups for, Köbi, TS, LFP, FMR, and LTR. A cutoff point of 20 mm for TS in FPLD women was found, which is lower than the value classically described in the literature for the diagnosis of FPLD. Additionally, an LFP < 29.6% appears to be a useful tool to aid in the diagnosis of these women.
Conclusion
Combining anthropometric measurements to assess body fat distribution can lead to a more accurate diagnosis of FPLD. This study suggests new cutoff points for thigh skinfold and leg fat percentage in women with suspected FPLD in Brazil. Further studies are needed to confirm these findings.
Keywords: Familial partial lipodystrophy, Lipodystrophy, Body composition, Dual-energy X-ray absorptiometry (DXA)
Background
Familial Partial Lipodystrophy (FPLD) is a disease with broad clinical and genetic variation [1, 2]. Seven different subtypes of FPLD have been described. However, the genetic inheritance of FPLD type 1 (FPLD1), or Köbberling syndrome, has not yet been identified [3]. Guíllin and colleagues proposed a measure to assist in the diagnosis of patients with FPLD1, known as the Köb index (Köbi), which is calculated by the ratio of subscapular (SS) and calf skinfold (CS) thickness. According to this study, a Köbi > 3.477 is highly suggestive of this syndrome, with a sensitivity of 89% and specificity of 84% [4]. The other subtypes range from 2 to 7 and have specific genetic variants: LMNA, PPARG, PLIN1, CIDEC, LIPE, and CAV1, respectively [3–5]. The subtypes of FPLD have in common the selective loss of adipose tissue, most commonly in the lower limbs [3, 6–8].
The diagnosis of FPLD is challenging due to its clinical and phenotypic variability, with atypical and typical forms described in the literature [2, 9]. Although its diagnosis is essentially clinical, non-invasive tools are used to evaluate body composition in lipodystrophic patients [10]. These include skinfold thickness measurement, bioimpedance analysis, magnetic resonance imaging (MRI), computerized tomography scan (CT) and dual-energy X-ray absorptiometry (DXA). Among these methods, thigh skinfold thickness (TS), central-to-peripheral mass ratio (or fat mass ratio [FMR]) by DXA, and Leg-to-total fat mass ratio in grams (LTR) by DXA are commonly used for FPLD diagnosis due to their ease of use and availability (3,5,10,11). The diagnosis of FPLD can be supported by the following criteria: TS < 22 mm for women and < 10 mm for men (3,11), FMR > 1.2 [3, 11], LTR < 25% [10], and Köbi > 3.477 [4].
To calculate FMR and LTR, more in-depth knowledge of FPLD is needed since it is mandatory to identify which measurements from the DXA report should be used in each index. The leg fat percentage (LFP), a straightforward measurement, evaluates the adipose tissue proportion in the lower limbs. A recent study examining DXA parameters for diagnosing FPLD in women determined that LFP is the optimal objective anthropometric measure for diagnosis [10].
This study aimed to analyze the different anthropometric parameters used for screening and diagnosis of FPLD, focusing on determining cutoff points for TS and LFP within a Brazilian population.
Patients and methods
Study population
In this cross-sectional study, we identified 37 patients with previous FPLD diagnosis, clinical or genotypic, who were followed at the Endocrinology outpatient clinic of the Federal University of Ceará (Fortaleza, Brazil). This clinic is a reference in FPLD care in northeast Brazil.
The exclusion criteria were as follows: age under 18 years, male sex, acquired lipodystrophies, congenital generalized lipodystrophy (CGL), severe renal or hepatic diseases, depression and alcoholism.
Two groups were categorized based on genetic testing and/or anthropometric characteristics. FPLD + patients were those with a positive genetic variant for FPLD-related genes. Those who met clinical and anthropometric criteria for FPLD but had negative genotyping were classified as FPLD1.
FPLD1 and participants had at least three of the following: loss of adipose tissue affecting the lower limbs post-puberty, noticeable veins and muscularity (essential criteria), acanthosis nigricans, polycystic ovarian syndrome (PCOS), type 2 diabetes (T2D) or impaired fasting glucose (IFG), hypertriglyceridemia or low high-density-lipoprotein (HDL) cholesterol. The diagnostic criteria for PCOS were oligomenorrhea and hirsutism without any other known cause.
For comparison of anthropometric data, a control group with 74 healthy volunteers matched for age, sex, and body mass index (BMI) in a 2:1 ratio was selected. This group was recruited from outpatient clinics and hospital employees and was not related to the patients. This study was conducted in accordance with the ethical guidelines of the Helsinki Declaration and received approval from the Ethics Committee. Patients provided informed consent, and data were collected through medical record review after obtaining consent.
Anthropometrical parameters
The subsequent criteria were used to support FPLD diagnosis: TS < 22 mm, FMR > 1.2, LTR < 25% and/or Köbi > 3.477.
Laboratorial parameters
All patients underwent molecular analysis through a genetic panel for lipodystrophies and pancreatitis as an outpatient routine. The genes assessed in this panel are ABCA1, AGPAT2, AKT2, APOA5, APOC2, BSCL2, CAV1, CAVIN1, CFTR, CIDEC, CTRC, CYP27A1, GPIHBP1, LIPA, LIPE, LMF1, LMNA, LMNB2, LPL, MFN2, PLIN1, POLD1, PPARG, PRSS1, PSMB8, SMPD1, SPINK1 and ZMPSTE24.
For the purpose of diagnosing FPLD, variants in the genes LMNA, PPARG, PLIN1, CIDEC, LIPE, and CAV1 were taken into consideration. Adhering to the guidelines outlined by the American College of Medical Genetics and Genomics and the Association for Molecular Pathology, genetic variations in LIPE and CIDEC genes are deemed pathogenic exclusively in the homozygous state due to their autosomal recessive inheritance. Conversely, the remaining genetic variants are classified as pathogenic in both homozygous and heterozygous presentations, as their inheritance follows an autosomal dominant pattern.
The American Diabetes Association diagnostic standards for T2D and IFG were used. Dyslipidemia was diagnosed using triglycerides ≥ 150 mg/dL and/or HDL-cholesterol levels < 50 mg/dL. Fasting blood samples were collected to evaluate glycemic and lipid profiles.
Body composition evaluation
Body evaluation by skinfolds and DXA is routinely performed by two experienced nutritionists from the clinic. Fasting weight, height, and skinfold thickness of the TS, SS and CS were measured with a calibrated Lange® caliper. BMI was calculated by dividing weight (kg) by height squared (m2). Whole-body, truncal, upper limb, and lower limb fat mass were measured using DXA scan (GE Healthcare, model Lunar Prodigy Advance, software enCORE version 17), following the manufacturer’s recommendations for positioning, scan protocols, and analysis.
Statistical analysis
Statistical analysis was performed using RStudio version 22.07.1 and Microsoft Excel 2016. Unpaired t tests were used for parametric variables, Kruskal-Wallis and then Mann–Whitney tests were used for nonparametric variables. A significance level of 5% was adopted. The sensitivity and specificity of TS and LFP in patients with FPLD were calculated using receiver operating characteristic curve (ROC) analysis.
Results
Of the 37 identified patients, 18 (48.6%) were classified as FPLD + and 19 (51.4%) as FPLD1. The median age and follow-up time of the entire group were 44 and 2 years, respectively.
The anthropometric characteristics of each group are detailed in Table 1. The clinical characteristics of each participant are shown in Tables 2 and 3 of this article. When analyzing only regarding the medians of the anthropometric parameters defining lipodystrophy for all patients, we noted Köbi 4.66 (0.84-14; ± 6.33), TS 11 mm (5–55; ± 8.5), FMR 1.46 (1.07–2.16; ± 0.3), LTR 0.22 (10.3–29.3; ± 0.05), and LFP 25% (10.4–48,7; ±8,3).
Table 1.
Comparison of anthropometric and dual-energy X-ray absorptiometry measurements between different types of familial partial lipodystrophy and healthy controls
| Groups | |||||||||
|---|---|---|---|---|---|---|---|---|---|
| Variables | N | Total1 | Control N = 741 | FPLD+, N = 181 | FPLD1, N = 191 | p value2 | Control vs. FPLD+ | Control vs. FPLD1 | FPLD + vs. FPLD1 |
| Age (yo) | 111 | 44 ± 12 (44) |
43 ± 12 (43) |
45 ± 15 (42) |
50 ± 8 (52) |
0.053 | 0.6 | 0.1 | 0.056 |
| BMI (kg/m2) | 111 | 27.2 ± 4.5 (26.5) | 26.8 ± 4.4 (26.4) | 26.1 ± 4.3 (25.3) | 29.5 ± 4.7 (28.8) | ** | 0.8 | 0.056 | 0.068 |
| SS (mm) | 111 | 29 ± 11 (28) |
26 ± 9 (19) |
31.8 ± 15 (31) | 37 ± 12 (39) | * | 0.3 | * | 0.4 |
| CS (mm) | 63 | 14 ± 8 (11) |
20 ± 9 (19) |
3 ± 4 (6) |
13 ± 6 (13) |
* | * | ** | * |
| Köbi | 63 | 3.35 ± 2.88 (2.35) | 1.49 ± 1.25 (1.12) | 6.12 ± 3.4 (5.75) | 3.28 ± 1.73 (3.14) | * | * | * | ** |
| TS (mm) | 111 | 27 ± 14 (27) |
33 ± 11 (33) |
8.2 ± 3 (8) |
20 ± 12 (17) | * | * | * | * |
| WFP (%) | 111 | 37 ± 8 (38) |
40 ± 6 (40) |
29 ± 8 (31) |
37 ± 7 (38) |
* | * | 0.3 | ** |
| LFP (%) | 111 | 35 ± 10 (35) |
39 ± 7 (38) |
22 ± 7 (20) |
30 ± 7 (28) |
* | * | * | ** |
| TFP (%) | 111 | 40 ± 8 (41) |
41 ± 7 (41) |
34 ± 9 (37) |
42 ± 8 (42) |
** | * | 0.9 | ** |
| FMR | 111 | 1.21 ± 0.3 (1.13) | 1.06 ± 0.22 (1.02) | 1.6 ± 0.32 (1.63) | 1.45 ± 0.69 (1.35) | * | * | * | 0.3 |
| LTR | 111 | 0.3 ± 0.1 (0.31) | 0.98 ± 0.13 (1) | 0.20 ± 0.04 (0.21) | 0.22 ± 0.05 (0.23) | * | * | * | 0.4 |
1 Mean ± Standard Deviation (Median); n (%). 2 Kruskal-Wallis Test; Fisher’s Exact Test. * p < 0.001. ** p < 0.05
Notes: BMI, body mass index; CS, calf skinfold; FMR, fat mass ratio; Köbi, Köb index; LFP, leg fat percentage; LTR, leg-to-trunk ratio; N/A, not available; SS, subscapular skinfold; TFP, trunk fat percentage; TS, thickness skinfold; yo, years old; WFP, whole fat percentage
Table 2.
Summary of clinical and genotypic characteristics of familial partial lipodystrophy positive genotype patients
| Case, age, sex | Genotype | Clinical lipoatrophy | Fat deposition | BMI | Diabetes treatment | A1c | PCOS | Comorbidities | Dyslipidemia | Higher triglycerides value (mg/dL) | Current Dyslipidemia treatment |
|---|---|---|---|---|---|---|---|---|---|---|---|
| A1, 25, F | LMNA p.(Arg582Cys) | Four limbs | DC, H | 25,6 | MTF (IFG) | 5,2 | yes | no | no | 83 | no |
| B1, 53, F | LMNA p.(Arg582Cys) | Lower limbs | DC, H, ABD | 28,06 | MTF, PIO, INS (2,48) | 9,6 | yes | HBP, mild HE, DR, DPN | ↓HDL | 392 | ATO |
| B2, 58, F | LMNA p.(Arg582Cys) | Lower limbs | H, ABD | 27,3 | MTF, PIO, GLI& | 13,9 | menopause | HBP | ↑TGL | 307 | no |
| C1, 29, F * | LMNA p.(Arg582Cys) | Four limbs | No | 19,0 | MTF, PIO, INS (1,83) | 8,1 | yes | Moderate HE, CAN | ↓HDL,↑TGL | 4459 | ATO, CIP |
| C2, 31, F *† | LMNA p.(Arg582Cys), ABCA1 | Four limbs | DC, ABD | 20,3 | MTF, PIO | 6,8 | no | Mild HE, DPN | ↓HDL,↑TGL | 1264 | CIP |
| D1, 33, F | LMNA p.(Arg482Trp) | Four limbs | DC, ABD | 23,6 | MTF, PIO | 8,8 | yes | Mild HE, DPN | ↓HDL,↑TGL | 245 | ATO |
| D3, 67, F | LMNA p.(Arg482Trp) | Four limbs | ABD | 22,9 | MTF, GLI | 6,3 | menopause | HBP, liver Tx by NAFLD, PAD, CKD, DR, DPN | ↓HDL | 248 | SIN |
| E1, 52, F | LMNA p.(Arg582Cys) | Four limbs | ABD | 24,5 | MTF (IFG) | 5,7 | no | HBP, mild HE, CAD, CAN | ↓HDL,↑TGL | 379 | ATO |
| F1, 33, F | LMNA p.(Arg582Cys) | Lower limbs | DC, H, ABD | 32,3 | INS (0,75) | 8,5 | yes | Mild HE | ↑TGL | 100 | no |
| F2, 30, F | LMNA p.(Arg582Cys) | Lower limbs | DC, H, ABD | 31,6 | MTF (IFG) | 5,1 | yes | no | ↓HDL,↑TGL | 193 | no |
| F3, 42, F | LMNA p.(Arg582Cys) | Four limbs | DC, H, ABD | 30,9 | No (newly diagnosed diabetes) | 9,6 | yes | No | ↓HDL,↑TGL | 185 | SIN |
| G1, 57, F | LMNA p.(Arg582Cys) | Four limbs | DC, ABD | 23,1 | MTF | 6,3 | menopause | HBP, CI, CKD, mild HE | ↓HDL,↑TGL | 471 | ATO |
| G3, 59, F | LMNA p.(Arg582Cys) | Four limbs | DC, H, ABD | 28,8 | MTF, INS (0,75) | menopause | no | ↓HDL,↑TGL | 254 | SIN | |
| H1, 32, F | LMNA p.(Arg582Cys) | Four limbs | DC, H, ABD | 25,5 | MTF, PIO, GLIC | 8 | yes | Mild HE | ↓HDL,↑TGL | 4523 | ATO, EZE, CIP |
| I1, 23, F | LMNA p.(Arg582Cys) | Lower limbs | DC, H, ABD | 35,2 | MTF (IFG) | 5,8 | yes | no | ↓HDL,↑TGL | 254 | no |
| J1, 41, F | PPARG p.(Leu298Profs*41) | Lower limbs | ABD | 20,1 | MTF, INS (2,21) | 10,2 | yes | DPN | ↓HDL,↑TGL | 816 | no |
| L1, 38, F | PPARG p.(Leu298Profs*41) | Lower limbs | DC, H, ABD | 26,0 | MTF, PIO, GLI, ALO, INS (1,7) | 8,9 | yes | HBP | ↓HDL,↑TGL | 218 | ROS |
| L2, 36, F | PPARG p.(Leu298Profs*41) | Four limbs | DC, ABD | 23,5 | MTF (IFG) | 5,7 | no | no | ↓HDL,↑TGL | 511 | GEM |
* Homozygous variant in LMNA gene
† Homozygous variant in ABCA1 gene
& Does not accept insulin therapy
# LMNA and PPARG variants are classified as pathogenic in both homozygous and heterozygous presentations, as their inheritance follows an autosomal dominant pattern, according to the guidelines of the American College of Medical Genetics and Genomics and the Association for Molecular Pathology
# The numbers in parentheses represent the amount of insulin units per kilogram of weight
Notes: ABD, abdominal; ALO, alogliptin; ATO, atorvastatin; CAD, coronary artery disease; CAN, cardiovascular autonomic neuropathy; CIP, ciprofibrate; CKD, chronic kidney disease; DC, double chin; DE, erectile dysfunction; HE, hepatic steatosis; EZE, ezetimibe; F, female; G, hump; GEM, gemfibrozil; GLI, gliclazide; HAS, systemic arterial hypertension; HDL, high density lipoprotein; IC, heart failure; INS, insulin; M, male; MMSS, upper limbs; MMII, lower limbs; MTF, metformin; NAFLD, non-alcoholic fatty liver disease; PAD, peripheral arterial obstructive disease; PIO, pioglitazone; PND, diabetic polyneuropathy; RD, diabetic retinopathy; ROS, rosuvastatin; SIN, simvastatin; TGL, triglycerides; TX, transplant
Table 3.
Summary of clinical and genotypic characteristics of familial partial lipodystrophy type 1 (Köbberling) group
| Case, age, sex | Genotype | Clinical lipoatrophy | Fat deposition | BMI | Diabetes treatment | A1c | PCOS | Comorbidities | Dyslipidemia | Higher triglycerides value (mg/dL) | Current Dyslipidemia treatment |
|---|---|---|---|---|---|---|---|---|---|---|---|
| K1, 37, F | Negative | Four limbs | DC, H, ABD | 37,7 | MTF, PIO, GLI, INS (1,2) | 10,0 | yes | HBP | ↓HDL,↑TGL | 382 | ATO |
| K2, 54, F | Negative | Four limbs | H, ABD | 25,9 | MTF, PIO, INS (1,9) | 11,8 | menopause | HBP, DR, DPN | ↓HDL,↑TGL | 540 | ROS, EZE |
| K3, 54, F | Negative | Four limbs | DC, ABD | 28,0 | MTF, INS (1,48) | 9,0 | menopause | HBP, mild HE, DR, CI | ↓HDL,↑TGL | 345 | SIN, CIP |
| K4, 61, F | Negative | Four limbs | DC, H, ABD | 30,6 | MTF, INS (1,77) | 7,6 | menopause | HBP, DR, DPN, CAD, CI, CKD | ↓HDL,↑TGL | 191 | ATO |
| K5, 44, F | Negative | Four limbs | DC, H, ABD | 30,0 | MTF, PIO, INS (1,55) | 12,0 | Yes | HBP, mild HE, DPN | ↓HDL,↑TGL | 9900 | ROS, EZE, CIP |
| K6, 42, F | Negative | Four limbs | DC, ABD | 22,1 | MTF | 4,9 | No | HBP | ↓HDL,↑TGL | 263 | SIN |
| K7, 55, F | Negative | Four limbs | DC, ABD | 28,8 | MTF | 7,2 | menopause | Mild HE | ↓HDL | 156 | SIN |
| K8*, 52, F | AGPAT2, ABCA1 | Lower limbs | DC, ABD | 31,5 | MTF, PIO, INS (0,7) | 9,4 | menopause | HBP, DPN | ↓HDL,↑TGL | 315 | ATO |
| K9, 59, F | Negative | Four limbs | ABD | 26,4 | MTF, PIO, GLI, INS (2,09) | 10,0 | yes | HBP, DPN, CAD, CI | ↓HDL,↑TGL | 1075 | ATO, CIP |
| K10, 40, F | Negative | Lower limbs | DC, H, ABD | 26,0 | MTF, INS (1,1) | 11,9 | menopause | DPN | ↓HDL,↑TGL | 5745 | ATO, CIP |
| K11, 55, F | Negative | Lower limbs | DC, H, ABD | 39,7 | MTF, INS (1,88) | 9,0 | No | HBP, DR, DPN, CI | ↓HDL,↑TGL | 172 | ATO, CIP |
| K12, 29, F | Negative | Upper limbs | DC, H, ABD | 39,9 |
MTF (IFG) |
6,1 | menopause | HBP | ↓HDL,↑TGL | 191 | no |
| K13, 42, F | Negative | Lower limbs | DC, H, ABD | 26,2 | MTF, INS (2,04) | 9,2 | yes | DPN, CAD, CI | ↓HDL,↑TGL | 1869 | ATO, EZE, CIP |
| K14, 62, F | Negative | Four limbs | DC, H, ABD | 30,9 | MTF, PIO, DAP, INS (1,0) | 6,7 | No | HBP, DPN, CAN, CAD, CI | ↓HDL,↑TGL | 336 | ATO |
| K15, 56, F | Negative | Lower limbs | DC, ABD | 21,6 | MTF, GLI& | 9,6 | menopause | DPN, CAD | ↓HDL,↑TGL | 266 | CIP |
| K16, 49, F | Negative | Four limbs | DC, ABD | 28,8 | MTF, INS (0,84) | 8,0 | menopause | HBP, DR, CAD, CKD | ↓HDL,↑TGL | 334 | ROS, EZE |
| K17, 39, F | Negative | Four limbs | DC, H, ABD | 33,2 | MTF, INS (1,85) | 6,5 | No | HBP, DR, DPN | ↓HDL,↑TGL | 162 | ATO |
| K18, 40, F ** | LPL p.Glu448Lys | no | DC, H, ABD | 26,7 | MTF, INS (1,2) | 7,1 | No | HBP, DPN | ↓HDL,↑TGL | 321 | ATO |
| K19, 60, F ** | LPL p.Asn318Ser | Upper limbs | DC, H, ABD | 35,5 | MTF, EMP, INS (1,28) | 9,7 | menopause | HBP, DR, DPN, CKD | ↓HDL,↑TGL | 1872 | ATO |
* Heterozygous variant in the AGPAT2 and ABCA1 genes
** Heterozygous variant in the LPL genes
# Heterozygous variants in LPL, AGPAT2 and ABCA1 genes are classified as variant of uncertain significance, according to the guidelines of the American College of Medical Genetics and Genomics and the Association for Molecular Pathology
# The numbers in parentheses represent the amount of insulin units per kilogram of weight
Notes: ABD, abdominal; ATO, atorvastatin; CAD, coronary artery disease; CI, cardiac insufficiency; CIP, ciprofibrate; CKD, chronic kidney disease; DC, double chin; DPN, diabetic polyneuropathy; DR, diabetic retinopathy; EZE, ezetimibe; F, female; H, hump; GLI, gliclazide; HBP, high blood pressure; HDL, high density lipoprotein; HE, hepatic steatosis; INS, insulin; M, male; MTF, metformin; NAFLD, non-alcoholic fatty liver disease; PAD, peripheral artery disease; PIO, pioglitazone; ROS, rosuvastatin; SIN, simvastatin; TGL, triglycerides
The FPLD + group (N = 18) includes individuals from 11 different families, all of whom are native to the state of Ceará. The average follow-up time was 5.2 years, with a median age of 45 years. Three patients reported familial consanguinity, and one was an adopted daughter. Fifteen patients (83.3%) had Dunnigan Syndrome (FPLD2), belonging to nine different families. The mean age was 40.6 years, and the mean follow-up time was 5.3 years. Among FPLD2 patients, twelve (80%) had LMNA p.(Arg582Cys) variant, while three (20%) harbored the LMNA p.(Arg482Trp) variant. Two sisters (Cases C1 and C2, Table 2), born to consanguineous parents, had homozygous LMNA p.(Arg582Cys) variant, presenting with the generalized phenotype. These two cases were previously reported in the literature [12]. Three women belonging to two lineages carried PPARG p.(Leu298Profs*41) variant. It was not possible to analyze FPLD + subgroups separately due to the small sample of patients with PPARG gene variants. In this group, only two women carrying the LMNA p.(Arg582Cys) variant did not satisfy the FMR criteria (Cases C1 and G3, Table 2); notably, one of these individuals presented the variant in a homozygous state. Both TS and FMR were frequently identified as diagnostic criteria in the FPLD + group, with all FPLD + patients meeting the criteria when TS was employed.
Seventeen (89.5%) of the FPLD1 group had obesity or overweight. FMR was ≥ 1.2 in all individuals of the group. Eight FPLD1 patients had a Köbi > 3.477, of whom seven had TS < 22 mm, and only one patient, with a BMI of 37.6 kg/m2, had a TS of 23.5 mm. The remaining patients in the group did not show positivity for Köbi. The median BMI for all groups remained within the overweight range (p 0.04). The leanest individuals belonged to the FPLD + group.
A significant p value was observed in the analysis between all groups for Köbi, TS, LFP, FMR, and LTR (p < 0.001). When comparing controls versus FPLD + and controls versus FPLD1 for the same parameters mentioned above, p < 0.001 was found to all comparisons.
When correlating the diagnostic criteria among FPLD groups, we found statistically significant differences in the comparison for Köbi (p 0.016). However, when analyzing the components of this index, there was a significant difference between these two groups only for CS (p < 0.001). Regarding TS, the FPLD + group was different from FPLD1, with a p value of < 0.001 for both comparisons. The parameters that showed similarity between FPLD subtypes were LTR and FMR.
Lipoatrophy of the lower limbs is a prominent feature observed during the evaluation of FPLD. TS represents one of the main parameters for the diagnostic support of lipodystrophic syndromes. Based on its relevance in the literature, we analyzed a cutoff point of TS in the sample. The cutoff point by Youden’s criterion with the best balance was 20 mm, with a sensitivity of 81%, specificity of 93.2%, and area under the curve (AUC) of 0.89 (Fig. 1). Furthermore, LFP cutoff point was also evaluated as a diagnostic tool for FPLD and it was 29.6% (sensitivity 72.9%, specificity of 95.9% and AUC 0.895) (Fig. 2). For this particular group of women, the median age, TS, and LFP were 42 years, 11 mm, and 25%, respectively.
Fig. 1.
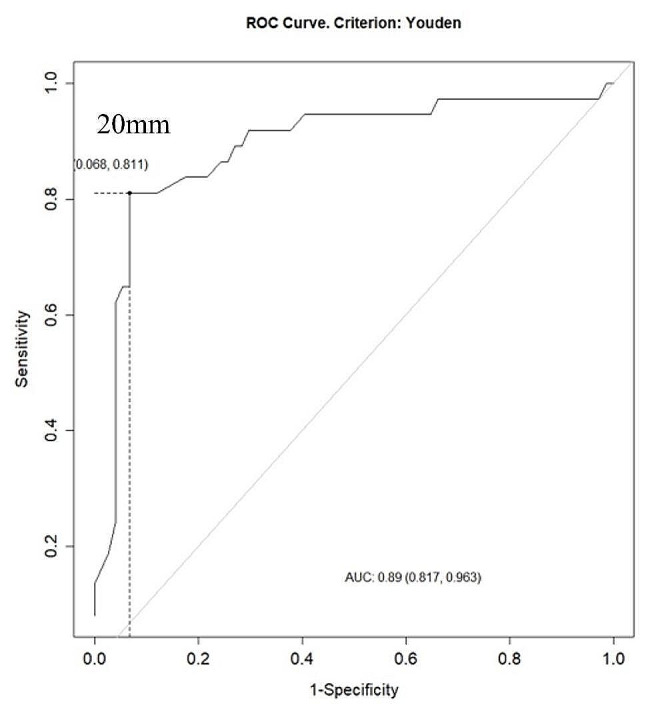
ROC curve for thigh skinfold thickness cutoff point in Familial Partial Lipodystrophy women by Youden’s criterion
Fig. 2.
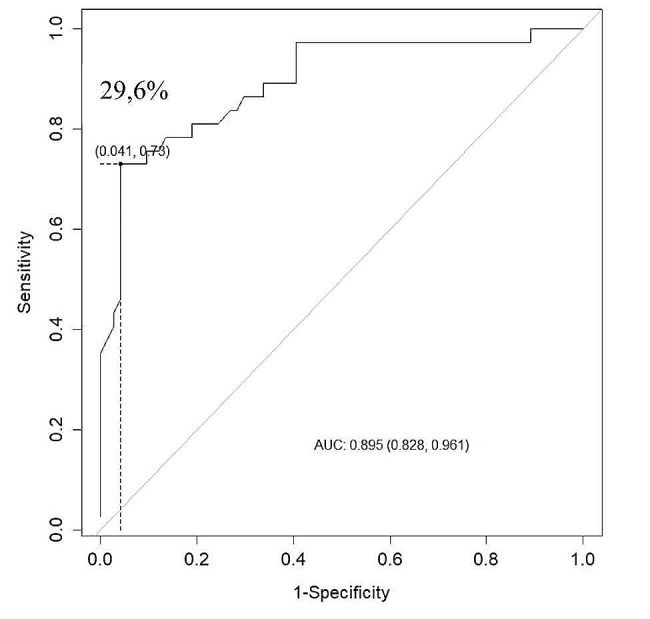
ROC curve for leg fat percentage cutoff point in Familial Partial Lipodystrophy women by Youden’s criterion
Discussion
This is the first Brazilian study comparing different subtypes of FPLD among themselves and with a healthy control group, having evaluated 37 patients and 74 healthy controls.
It is known that genetic tests are costly and have low availability in our setting. Therefore, anthropometric analyses remain the most commonly used to support the diagnosis of lipodystrophic syndromes, possibly due to their greater simplicity of execution and lower cost, especially the performance of skinfold thickness measurements. It is important to note that FMR, LTR, and skinfold thickness measurements are indirect measures and may not be specific to FPLD and may be altered in other conditions that affect body fat distribution, such as hypercortisolism and exogenous obesity [1, 13–15]. Delayed diagnosis may contribute to increased comorbidities and complications in this population [5, 16, 17].
When analyzing the diagnostic criteria for lipodystrophies, lower limbs lipoatrophy is present, even indirectly, in several evaluative methods, such as TS, the Köbi index, and ratios between masses and fat percentages in DXA (FMR and LTR) [10, 11]. Additionally, this is a remarkable phenotypic change that captures the attention of healthcare professionals examining patients with suspected FPLD. There was a statistically significant difference in the comparison between FPLD + and FPLD1 for Köb (p = 0.016). However, when analyzing the components of this index, there was a significant difference for these two groups only for CS, which had a p value < 0.001, whereas the same was not observed in the comparison between the SS skinfolds of the groups. This finding supports the significance of lower limbs lipoatrophy in distinguishing between subtypes of FPLD lacking established genetic bases.
Diagnostic aid tools that rely on physical characteristics, such as TS, may be influenced by ethnicity, and the same cutoff points may not be applicable to different populations worldwide. TS is one of the most widely accepted and used parameters for the diagnosis of FPLD, probably due to its relative simplicity in execution. However, it requires a properly calibrated and scientifically validated skinfold caliper, as well as a professional who knows how to perform the technique properly. In addition, it is an operator-dependent test, and there may be discrepancies in measurements even among experienced examiners. These points may explain the statistically significant difference found between the groups.
The LFP may be an alternative to TS for diagnostic suspicion in scenarios where genetic testing is not feasible and the examiner lacks familiarity with other anthropometric indices of DXA, such as FMR and LTR. Other advantages of LFP include the possibility of objective documentation, easy evaluation without the need for patient privacy concerns during the consultation, low cost and quick execution compared to MRI, and low radiation dose compared to CT scan.
The available data in the current literature on TS are largely derived from non-Brazilian populations and subsequently extrapolated for use in the evaluation of the Brazilian population [4, 8]. Therefore, the cutoff values found in FPLD women for TS and LFP in this study may represent more suitable parameters for the evaluation of female patients with lipodystrophy from Brazil.
Limitations of this research include the retrospective data collection, some of which were self-reported; the small sample size, although it should be noted that this is a rare disease; the exclusively northeastern and Ceará cohort, which may limit the generalizability of the findings to other regions of Brazil; and the exclusion of the male and pediatric population from the study.
Conclusion
The combined use of anthropometric measurements for assessing body fat distribution, clinical history, and, if possible, genetic analysis contributes to a definitive and more accurate diagnosis of FPLD. A new cutoff point for thigh skinfold and leg fat percentage in women in this case series was suggested, which are 20 mm and 29,6%, respectively. These parameters might be deemed more suitable for assessing suspected FPLD women in Brazil. Further studies are needed to confirm these associations.
Acknowledgements
Not applicable.
Abbreviations
- AUC
Area under the curve
- BMI
Body mass index
- CGL
Congenital generalized lipodystrophy
- CS
Calf skinfold
- CT
Computerized tomography scan
- DXA
Dual-energy X-ray absorptiometry
- FMR
Fat mass ratio
- FPLD
Familial Partial Lipodystrophy
- FPLD+
Patients were those with a positive genetic variant for FPLD
- FPLD1
Patients with negative genetic testing, but who met clinical and anthropometric criteria for FPLD
- HDL
High-density-lipoprotein
- IFG
Impaired fasting glucose
- Köbi
Köb index
- LFP
Leg fat percentage
- LTR
Leg-to-total fat mass ratio in grams
- MRI
Magnetic resonance imaging
- PCOS
Polycystic ovarian syndrome
- SS
Subscapular
- T2D
Type 2 diabetes
- TS
Thigh skinfold thickness
Author contributions
RMMJ, VRV, GKP, VOF and CMV were responsible for the study’s conception. Material preparation was performed by V.R. V, and RMMJ. The first draft of the manuscript was written by V.R.V. and all authors contributed to the other versions of the manuscript. All the authors have read and approved the final manuscript.
Funding
This work was supported by the National Institute of Science and Technology (INCT) for Diabetes and Obesity, CNPq, Federal University of Ceará and FUNCAP.
Data availability
All data generated or analysed during this study are included in this published article [and its supplementary information files].
Declarations
Ethics approval and consent to participate
This work was approved by the Brazilian Ethics System (Plataforma Brasil: http://plataformabrasil.saude.gov.br/login.jsf), with the Certificate of Presentation for Ethical Assessment (CAAE) number: 41766820.2.0000.5045 and opinion number: 4.500.872.
Consent for publication
Not applicable.
Competing interests
The authors declare no competing interests.
Footnotes
Publisher’s Note
Springer Nature remains neutral with regard to jurisdictional claims in published maps and institutional affiliations.
References
- 1.Herbst KL, Tannock LR, Deeb SS, Purnell JQ, Brunzell JD, Chait A. Kobberling type of familial partial lipodystrophy: an underrecognized syndrome. Diabetes Care. 2003;26(6):1819–24. 10.2337/diacare.26.6.1819 [DOI] [PubMed] [Google Scholar]
- 2.Vantyghem MC, Balavoine AS, Douillard C, Defrance F, Dieudonne L, Mouton F, et al. How to diagnose a lipodystrophy syndrome. Annales D’endocrinologie. Elsevier; 2012. pp. 170–89. [DOI] [PubMed]
- 3.Brown RJ, Araujo-Vilar D, Cheung PT, Dunger D, Garg A, Jack M, et al. The diagnosis and management of lipodystrophy syndromes: a multi-society practice guideline. J Clin Endocrinol Metab. 2016;101(12):4500–11. 10.1210/jc.2016-2466 [DOI] [PMC free article] [PubMed] [Google Scholar]
- 4.Guillín-Amarelle C, Sánchez-Iglesias S, Castro-Pais A, Rodriguez-Cañete L, Ordóñez-Mayán L, Pazos M, et al. Type 1 familial partial lipodystrophy: understanding the Köbberling syndrome. Endocrine. 2016;54:411–21. 10.1007/s12020-016-1002-x [DOI] [PubMed] [Google Scholar]
- 5.Handelsman Y, Oral E, Bloomgarden Z, Brown R, Chan J, Einhorn D, et al. The clinical approach to the detection of lipodystrophy–an AACE consensus statement. Endocr Pract. 2013;19(1):107–16. 10.4158/endp.19.1.v767575m65p5mr06 [DOI] [PMC free article] [PubMed] [Google Scholar]
- 6.Garg A, Lipodystrophies. Am J Med. 2000;108(2):143–52. 10.1016/S0002-9343(99)00414-3 [DOI] [PubMed] [Google Scholar]
- 7.Simha V, Garg A. Inherited lipodystrophies and hypertriglyceridemia. Curr Opin Lipidol. 2009;20(4):300–8. 10.1097/MOL.0b013e32832d4a33 [DOI] [PubMed] [Google Scholar]
- 8.Hegele RA, Cao H, Anderson CM, Hramiak IM. Heterogeneity of nuclear lamin A mutations in Dunnigan-type familial partial lipodystrophy. J Clin Endocrinol Metab. 2000;85(9):3431–5. [DOI] [PubMed] [Google Scholar]
- 9.Guillín-Amarelle C, Fernández-Pombo A, Sánchez-Iglesias S, Araújo-Vilar D. Lipodystrophic laminopathies: diagnostic clues. Nucleus. 2018;9(1):277–88. 10.1080/19491034.2018.1454167 [DOI] [PMC free article] [PubMed] [Google Scholar]
- 10.Vasandani C, Li X, Sekizkardes H, Adams-Huet B, Brown RJ, Garg A. Diagnostic value of anthropometric measurements for familial partial lipodystrophy, Dunnigan variety. J Clin Endocrinol Metab. 2020;105(7):2132–41. 10.1210/clinem/dgaa137 [DOI] [PMC free article] [PubMed] [Google Scholar]
- 11.Valerio CM, Zajdenverg L, de Oliveira JEP, Mory PB, Moyses R, Godoy-Matos AF. Body composition study by dual-energy x-ray absorptiometry in familial partial lipodystrophy: finding new tools for an objective evaluation. Diabetol Metab Syndr. 2012;4:1–6. 10.1186/1758-5996-4-40 [DOI] [PMC free article] [PubMed] [Google Scholar]
- 12.Montenegro RM, Costa-Riquetto AD, Fernandes VO, Montenegro APDR, de Santana LS, de Jorge AA. L, Homozygous and heterozygous nuclear lamin a p. R582C mutation: different lipodystrophic phenotypes in the same kindred. Front Endocrinol (Lausanne). 2018;9(AUG). [DOI] [PMC free article] [PubMed]
- 13.Boschmann M, Engeli S, Moro C, Luedtke A, Adams F, Gorzelniak K, et al. LMNA mutations, skeletal muscle lipid metabolism, and insulin resistance. J Clin Endocrinol Metab. 2010;95(4):1634–43. 10.1210/jc.2009-1293 [DOI] [PMC free article] [PubMed] [Google Scholar]
- 14.Garg A, Lipodystrophies. Genetic Acquir Body Fat. 2015;96(November 2011):3313–25. [DOI] [PMC free article] [PubMed] [Google Scholar]
- 15.Kwapich M, Lacroix D, Espiard S, Ninni S, Brigadeau F, Kouakam C, et al. Cardiometabolic assessment of lamin A/C gene mutation carriers: a phenotype–genotype correlation. Diabetes Metab. 2019;45(4):382–9. 10.1016/j.diabet.2018.09.006 [DOI] [PubMed] [Google Scholar]
- 16.Mosbah H, Donadille B, Vatier C, Janmaat S, Atlan M, Badens C, et al. Dunnigan lipodystrophy syndrome: French national diagnosis and care protocol (PNDS; Protocole National De Diagnostic et de soins). Orphanet J Rare Dis. 2022;17(1):1–23. [DOI] [PMC free article] [PubMed] [Google Scholar]
- 17.Garg A, Agarwal AK. Lipodystrophies: disorders of adipose tissue biology. Biochimica et Biophysica Acta (BBA)-Molecular and Cell Biology of lipids. 2009;1791(6):507–13. [DOI] [PMC free article] [PubMed]
Associated Data
This section collects any data citations, data availability statements, or supplementary materials included in this article.
Data Availability Statement
All data generated or analysed during this study are included in this published article [and its supplementary information files].