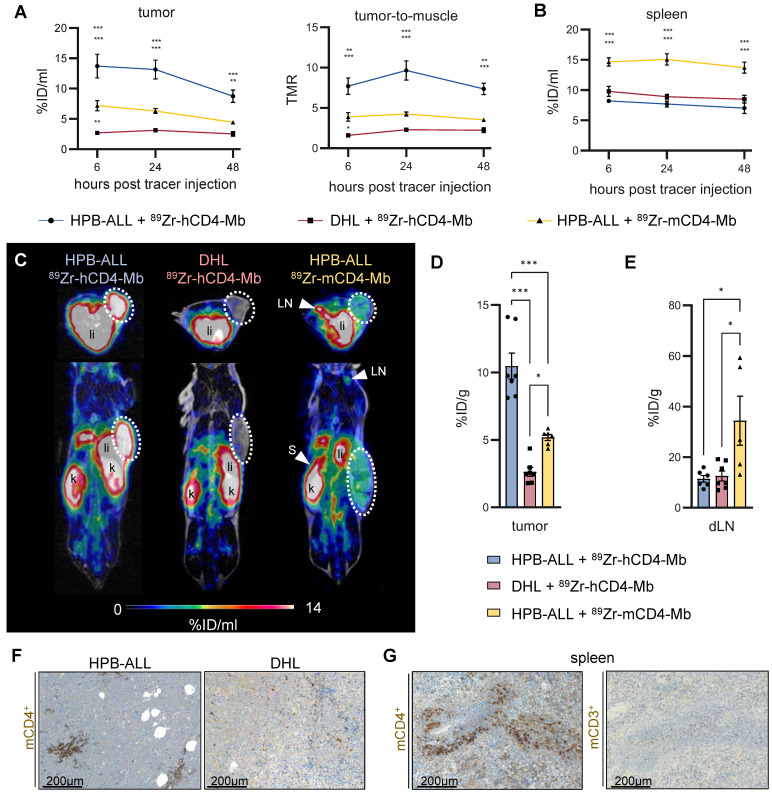
Figure 2.
In vivo 89Zr-hCD4-Mb and 89Zr-mCD4-Mb binding to CD4+ cells in immunodeficient NSG mice. (A) In vivo PET uptake quantification and tumor-to-muscle ratio of hCD4+ HPB-ALL and hCD4- DHL xenografts 6, 24, and 48 h after 89Zr-hCD4-Mb or 89Zr-mCD4-Mb injection. (B) In vivo PET uptake quantification of the spleen. (C) Representative PET/MR images acquired 48 h after 89Zr-hCD4-Mb or 89Zr-mCD4-Mb injection. Tumors are highlighted with a white circle. LN: lymph nodes; s: spleen; k: kidney; li: liver. (D) Ex vivo biodistribution of hCD4+ HPB-ALL and hCD4- DHL tumors and (E) draining lymph nodes (dLNs) measured by γ-counting at 48 h after 89Zr-hCD4-Mb or 89Zr-mCD4-Mb injection. (F) Ex vivo immunohistochemistry (IHC) of endogenous mCD4+ cells from HPB-ALL tumors and DHL tumors of NSG mice. (G) ex vivo IHC of endogenous mCD4+ cells and mCD3+ cells from the spleens of NSG mice. P values were calculated by two-way ANOVA (A, B) or ordinary one-way ANOVA (D, E) using the Tukey post-hoc test. Data derived from two independent experiments (n = 6-7 per group). *p < 0.05, **p < 0.01, ***p < 0.001.

