PLOS ONE logoLink to PLOS ONE
. 2024 Sep 4;19(9):e0293431. doi: 10.1371/journal.pone.0293431

Concurrent disease burden from multiple infectious diseases and the influence of social determinants in the contiguous United States

Emma Blake 1, Este Stringham 1, Chantel Sloan-Aagard 1,*
Editor: Sana Eybpoosh2
PMCID: PMC11373817  PMID: 39231143

Abstract

Social determinants of health are known to underly excessive burden from infectious diseases. However, it is unclear if social determinants are strong enough drivers to cause repeated infectious disease clusters in the same location. When infectious diseases are known to co-occur, such as in the co-occurrence of HIV and TB, it is also unknown how much social determinants of health can shift or intensify the co-occurrence. We collected available data on COVID-19, HIV, influenza, and TB by county in the United States from 2019–2022. We applied the Kulldorff scan statistic to examine the relative risk of each disease by year depending on the data available. Additional analyses using the percent of the county that is below the US poverty level as a covariate were conducted to examine how much clustering is associated with poverty levels. There were three counties identified at the centers of clusters in both the adjusted and unadjusted analysis. In the poverty-adjusted analysis, we found a general shift of infectious disease burden from urban to rural clusters.

Introduction

Local transmission and prevalence of infectious diseases is highly dependent on a variety of factors including population density, vaccination coverage, social determinants of health, and human behavior relative to transmission mechanisms. [1, 2]. The impact of poverty and other deprivation metrics were exacerbated in certain geographic areas in the COVID-19 era [35]. While the underlying factors that create greater epidemic potential in certain neighborhoods are widely studied for individual conditions, cross-studies between multiple infectious diseases are rare [69].

Individuals living in areas with potential for multiple overlapping outbreaks are at higher risk of infection and co-infection. Previous research indicates that individuals co-infected with tuberculosis (TB), human immunodeficiency virus (HIV), and coronavirus disease (COVID-19) were at the highest risk of death and needed additional care during the COVID-19 era [10, 11]. Infection with TB worsened COVID-19 symptom severity and mortality rates and could be further worsened when co-infected with HIV [1214]. Coinfection with influenza and COVID-19 may likewise increase mortality and worsen health outcomes [14], although the influence varied depending on type. Some global geographic areas with high flu vaccination rates were found to have lower mortality rates for COVID-19 [15].

Concurrent local epidemics can further impact the receipt of treatment and be an excessive burden on health services. Services for TB and other diseases were decreased due to the COVID-19 pandemic, and the disease burden increased due to the overwhelming rise in COVID-19 cases in certain areas [2, 16, 17]. Investigating individual locations that have experienced past epidemics of multiple infectious diseases will help identify those that are at risk of concurrent infections going forward and encourage additional local interventions that can reduce overall disease burden. This study aims to examine concentrated multiple disease burden in specific counties or geographic locales of the United States and determine which diseases are more prevalent in these locations to identify patterns and assist efforts in combatting infectious disease among the population.

Methods

This study was a descriptive ecological study. It investigated infectious diseases from all contiguous counties in the US from the years 2019–2022 that data was available for the infectious diseases, TB, HIV, COVID-19, and influenza. The data case counts were annual data, or data collected from the total of each year.

Data sources

Data for TB, HIV, COVID-19, and influenza were compiled from existing data sets.

(Data was collected from the seasons 2019–20 and 2020–21 and included all strains of influenza) [1820]. The data were organized by county and/or city subdivisions and we identified the centroid coordinates of each location for spatial analyses. Data sets were chosen according to the most recently collected data; the TB and HIV data was from years 2019 and 2020 while the influenza data was from years 2020 and 2021, and the COVID-19 data was from years 2021 and 2022.

COVID-19

The methods of reporting were different for each data set. COVID-19 data were reported based on positive COVID-19 tests and compiled by the New York Times. The surveillance case definition for COVID-19 [18] was the total number of both confirmed and probable cases. Individuals with a confirmed case had a positive COVID-19 test from a laboratory test that was reported by a federal, state, territorial or local government agency. Only tests that detected viral RNA in the sample were considered confirmatory. A probable case counted individuals that did not have a confirmed test but were evaluated by public health officials using criteria developed by states and the federal government and reported by a health department. Laboratory, epidemiological, clinical and vital records were considered evidence by public health officials. According to the Council of State and Territorial Epidemiologists, tests that detected antigens or antibodies were considered evidence towards a probable case.

HIV and TB

HIV and TB data were reported to the Centers for Disease Control and Prevention (CDC) through local and state health departments and downloaded through the AtlasPlus portal. The surveillance case definition for TB [20, 21] was a case that met the clinical case definition or was laboratory confirmed. The clinical criteria for a case diagnosis consisted of a positive tuberculin skin test or positive interferon gamma release for M. tuberculosis, other signs and symptoms compatible with TB (abnormal chest radiograph, abnormal chest computerized tomography scan, etc.), treatment with two or more anti-TB medications, or a completed diagnostic evaluation. The laboratory criteria for a case diagnosis were the isolation of M. tuberculosis from a clinical specimen, demonstration of M. tuberculosis complex from a clinical specimen by nucleic acid amplification test, or the demonstration of acid-fast bacilli in a clinical specimen when a culture has not been or cannot be obtained or is falsely negative or contaminated. The surveillance case definition for HIV [20, 22] was a confirmed case in one of the five HIV infection stages (0, 1, 2, 3, or unknown). If there was a negative HIV test within six months of the first HIV infection diagnosis, then the stage is zero. The other stages of HIV infection were determined by the age-specific CD4+ T-lymphocyte count or CD4+ T-lymphocyte percentage of total lymphocytes.

Influenza

Influenza data were reported by public health laboratories to formulate FluView’s existing surveillance from the US WHO Collaborating Systems and NRVESS located throughout all 50 states of the United States [23]. For this study, data from the 48 contiguous states were used. The surveillance case definition for influenza [24] is a laboratory confirmation as well as signs and symptoms. A laboratory definition is virus isolation, molecular detection, detection of viral antigens or rapid influenza diagnostic tests, use of immunohistochemistry, or serologic testing using hemagglutination inhibition or microneutralization. The case definition used by the CDC in the US Outpatient Influenza-like Illness Surveillance Network, in which healthcare providers report the total number of patient visits and number of patients seen for ILI every week, is a fever 100⁰F or higher and a cough/sore throat. The influenza data was collected from the CDC Flu view for seasons 2019–20 and 2020–21 and includes all strains of influenza.

Different methods of data collection from various sources led to the possibility of inequalities in data comparison. Because of these potential differences, we chose to focus on overall patterns in disease distribution rather than individual cluster outputs.

Statistical analysis

Poisson model

We employed a cluster detection method using the Kulldorff scan statistic implemented in the SaTScan software. We used the discrete Poisson probability model using case counts and underlying county populations to determine the ratios of observed to expected cases in a given year, identifying both high and low-risk areas. The maximal spatial cluster was set for 10% of the population at risk. The maximum number of replications was 999. Hierarchical priority was given to the most likely clusters and removed those of the same disease/year combination with geographical overlap. We ran a purely spatial analysis for each infectious disease for each year available, resulting in eight total unadjusted analyses (see S3 File).

A spatial cluster never contained more than 50% of the population at risk because a larger size is interpreted as a lower disease rate. The default maximum was 50%, but we chose a smaller maximum because it is difficult to make a meaningful interpretation of larger maximums. We originally set the maximum at 5%, but the maximum was too small for interpretation. We decided to set the maximum at 10% because it was small enough to be significant and large enough for interpretation.

The clusters were expressed in a circular window of kilometers. Large clusters indicated consistent higher disease burden across a geographical area. Smaller clusters indicated concentrations of high disease burden in smaller geographical areas or specific counties. The radius described in the results section was of high-risk clusters. The definition of a high-risk cluster for TB, HIV, COVID-19, and influenza was a geographical area with a significantly higher number of observed cases than expected cases. Groups of cases were defined as a high-risk cluster because of a pattern of high infectious disease burden in that geographical area.

Expected cases were determined by using a spatial scan statistic software [25] to analyze the geographical distribution of infectious disease cases in the contiguous United States. The spatial scan statistic evenly distributed the risk of each disease (i.e. TB cases for 2020) across counties, which was the expected case count. The expected cases were then compared to the observed cases using the Poisson model to discover counties with a statistically significant disease burden.

Poisson model with covariate

In this research, the dependent variable was the amount of a disease. It was measured by the number of observed cases in the data collected from the NY Times, US CDC influenza surveillance, and US CDC NCHHSTP. Location was the controlled independent variable. This research sought to find a relationship between location and disease burden. For example, the location of New York County had a significantly higher amount of COVID-19 and therefore individuals there were at greater risk than in another county. The controlled independent variable (location) affected the dependent variable (amount of disease).

Covariates are independent variables that can influence the outcome of a statistical trial. In this research, the covariate was the poverty level. The poverty levels of the percent of the population at or below 125% of the Federal Poverty Level were taken from the 2020 US Census for each county and used as an uncontrolled independent variable. Eight additional analyses (see S6 File) were completed by adjusting for underlying poverty levels. The covariate analysis was used to examine differences in the mean values of the dependent variables that are related to the effect of the controlled independent variable while taking into account the influence of the uncontrolled independent variable (percent below poverty level). It assumed a linear relationship between the dependent variable and the covariate. Therefore, by comparing the adjusted and unadjusted analyses, we can determine if there are strong patterns relative to socioeconomics that are driving cluster detection.

Results of the analyses frequently output single-county clusters. In order to compare across analyses, we focused on the central county of each cluster. Therefore, the results described refer to a single county, although it was not uncommon for clusters to span multiple counties. This study was not subject to IRB approval because we used freely available datasets. We were ethically careful not to display rates in counties with low numbers.

Results

Unadjusted analysis

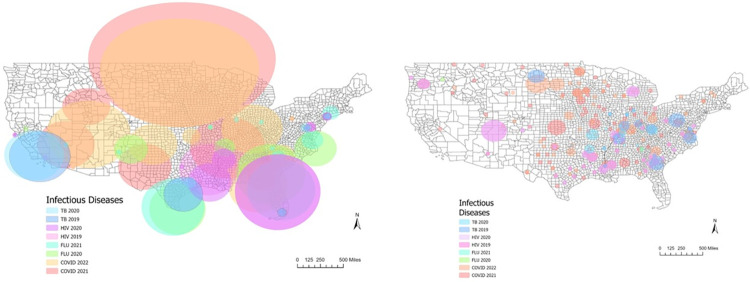
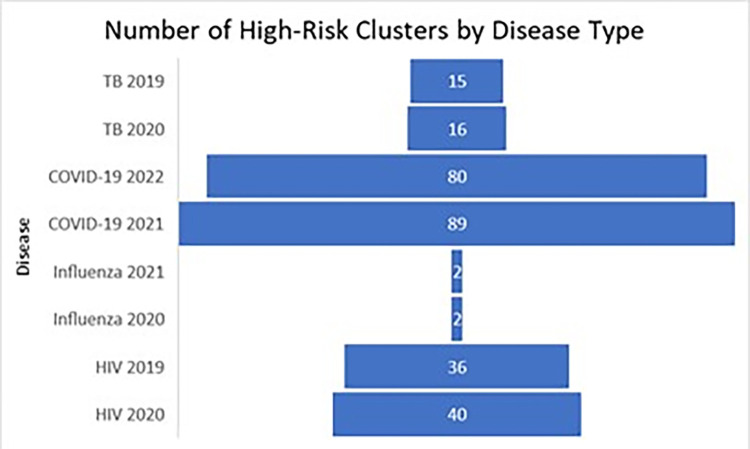
The unadjusted analysis output 72 high risk clusters, or 72 areas where there were significantly higher cases of HIV, influenza, TB or COVID-19 in individual years than statistically expected, and 81 low risk clusters. We will focus mainly on the areas of high risk due to alignment with the study purpose. There were patterns of clusters that show a significantly higher amount of TB, HIV, and influenza in urban areas, the south, and along the coastline (see Fig 1). COVID-19 clusters were distributed differently and generally included a higher disease burden in areas that did not overlap with the other infectious diseases. For maps showing the central counties in each cluster, see S1 File.

Fig 1. High-risk cluster locations in the unadjusted analysis and poverty-adjusted analysis.

Fig 1

This figure shows high-risk cluster locations and radii for disease and year for the unadjusted analysis (left), and high-risk cluster locations and radii for disease and year for the poverty-adjusted analysis (right). The shapefile used was from the US Census Bureau publicly available TIGER/Line Shapefiles. Counties at the center of high-risk clusters in consecutive years (see S4 File) were found for COVID-19, HIV, and Influenza. Central counties for high-risk clusters for COVID-19 were in Miami-Dade County, FL, New York County, NY, Westmoreland County, PA and Yuma County, AZ. Counties at the center of regions with high disease burden of HIV in consecutive years were Anne Arundel County, MD, Lake County, FL, Los Angeles County, CA and San Francisco County, CA. The county with a high disease burden of influenza in consecutive years was Boone County, MO. Based on this analysis, none of the counties were at the center of high-risk clusters for TB in consecutive years.

Concentric HIV and TB high-risk clusters were identified as centered on Bronx County, NY, Kings County, NY, and Dallas County, TX (see S5 File). Significant high-risk clusters of COVID-19 and influenza were found in Clark County, NV, and COVID-19 and HIV clusters were found centered on Fairfield County, SC. The largest clusters were detected for COVID-19 in 2021 with a radius of 1045 miles, and COVID-19 in 2022 with a radius of 906 miles in the North-Central part of the US. Despite being the largest in size, these clusters did not overlap with other infectious disease high risk areas. Most of the other diseases had some overlap.

Poverty-adjusted analysis

The poverty-adjusted analysis output 280 high risk clusters (see Fig 2). All of the counties in the poverty-adjusted analysis that were centers of high-risk clusters for COVID-19 in consecutive years had populations of less than 100,000 people. These included counties in TN, MN, TX, KY, CO, MO, MN, WI, VA, IL, and NC. When investigating rates of HIV in consecutive years, all counties were found to be at the center of a high-risk cluster and had populations less than 100,000. There was only one county that was at the center of an influenza cluster in consecutive years, Gordon County, GA (see S7 File). There were two counties identified as cluster centers for TB in consecutive years, Fulton County, IN and Richmond County, VA.

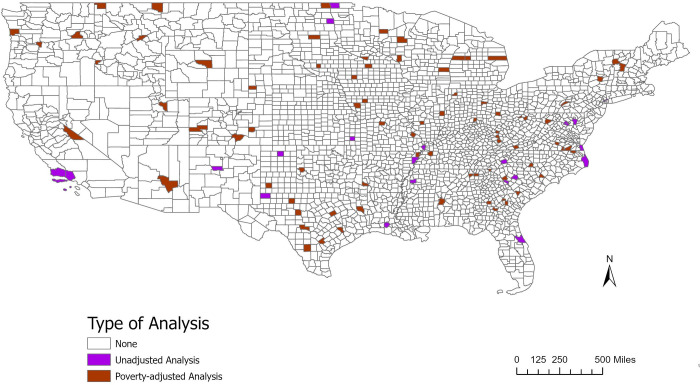
Fig 2. Analysis type for counties found in high-risk clusters.

Fig 2

This figure shows the counties that were found to be at the center of a high relative risk cluster by analysis type: unadjusted or poverty-adjusted (adjusted for 125% below the poverty level). The shapefile used was from the US Census Bureau publicly available TIGER/Line Shapefiles.

There was a spatial correlation between COVID-19 for years 2021 and 2022 and HIV for years 2019 and 2020 (see S8 File). Clusters were found with overlaps in 16 counties primarily in the south and southeast US. This included 11 counties that were centers of high-risk clusters for HIV in consecutive years 2019 and 2020 (in addition to a high-risk cluster of COVID-19 in either 2021or 2022), and three that were centers of high-risk clusters for COVID-19 in consecutive years 2021 and 2022 (in addition to a high-risk cluster of HIV in either 2019 or 2020). There were two counties, Kerr County, TX and Stanly County, NC, that had high-risk clusters for HIV in 2019 and 2020 and high-risk clusters for COVID-19 in 2021 and 2022.

There were two counties with clusters of COVID-19 and influenza (see S8 File), Boyle County, KY and Gordon County, GA. Overlap between three or more disease cluster types was rare, however. Richmond County, VA had overlapping clusters of COVID-19, HIV, and TB. In the poverty-adjusted analysis, the largest clusters were for COVID-19 (2022) with a radius of 129 miles, and COVID-19 (2021) with a radius of 104 miles.

The percentage of the county population at or below the US poverty level in counties identified as part of clusters ranged from 7.65% to 44.8%. Most of the clusters were centered on counties central to high-risk clusters had between 10 and 29.9% of their population below the poverty line (see S2 File).

Patterns across analyses

The type of analysis used in relation to the counties found in the center of high-risk clusters was examined (Fig 3). There were three counties identified at the centers of one or more disease clusters in both of the analyses. These counties were Grady County, GA, Hansford County, TX, and Scott County, IN. The percent of the population below the poverty line was 23.43%, 26.28%, and 24.19% respectively. All of these counties had high-risk clusters for COVID-19. Each of these three counties were found in rural areas. Grady County, GA and Scott County, IN had populations of around 25,000 people, while Hansford County had a population of about 5,000 people.

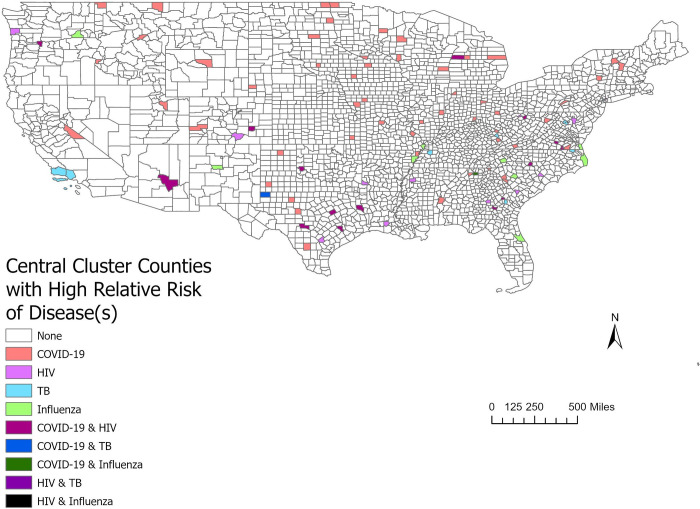
Fig 3. Counties found in high-risk clusters with one or multiple diseases.

Fig 3

This figure shows the counties that were at the center of clusters by disease, one or multiple diseases. The shapefile used was from the US Census Bureau publicly available TIGER/Line Shapefiles.

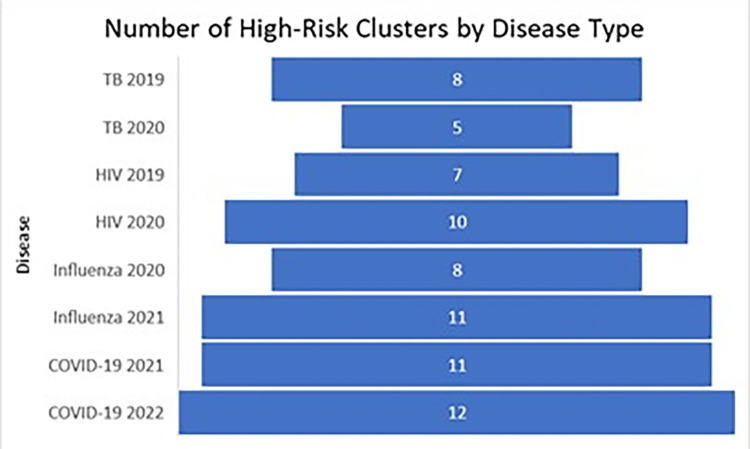
The overlap of clusters indicated that several counties were at a high relative risk for disease burden and concurrent disease burden. An analysis of the counties at the center of disease clusters and the type of associated infectious disease was completed (Fig 4). These counties were found to be at a higher risk for one or multiple diseases.

Fig 4. High-risk clusters attributed to type of infectious disease in the unadjusted analysis.

Fig 4

These figures show the number of high-risk clusters attributed to the type of infectious disease from the unadjusted analysis.

There was an increase in the number of clusters from the unadjusted analysis (see Fig 5) to the poverty-adjusted analysis except for influenza. There were about eight times as many COVID-19 clusters, four times as many HIV clusters, and two or three times as many TB clusters in the poverty-adjusted analysis. There were a quarter as many influenza clusters. It was expected that the poverty-adjusted analysis would decrease the number of clusters and the higher infectious disease burden would be explained by poverty. Instead, there was an increase of clusters with smaller radii in rural areas, indicating that rural poverty is a driver of infectious disease burden.

Fig 5. High-risk clusters attributed to type of infectious disease in the poverty-adjusted analysis.

Fig 5

These figures show the number of high-risk clusters attributed to the type of infectious disease from the poverty-adjusted analysis.

Discussion

The unadjusted analysis showed higher numbers of clusters of TB, HIV, and influenza in urban areas, the south, and along the coastline, while COVID-19 clusters appeared separately. Upon adjusting for poverty, more localized and rural clusters were found in the interior of the country for HIV, TB and COVID-19.

High population density in urban areas is known to be associated with infectious disease spread [26, 27]. On the other hand, rural areas face infrastructure and staffing challenges, making it difficult to prevent and respond to infectious disease outbreaks [27]. The distribution of infectious diseases in rural vs urban areas in the unadjusted analysis was found to be different depending on the infectious disease. A high relative risk for HIV was consistently more prevalent in urban areas. This could be attributed to certain lifestyles that are more common or accepted in urban settings.

Influenza clusters were few, which was expected given the low counts of influenza during the COVID-19 era [28]. What clusters were found, persisted specifically in New Mexico and neighboring regions in the southwestern US. There is a possible vaccination gap in this area of the US, although more research would need to be conducted to see if high rates of influenza are correlated with influenza vaccination coverage in southwest states [29]. Both TB and COVID-19 had clusters with high relative risks for both urban and rural areas. Due to the COVID-19 pandemic, TB case diagnoses may have been missed. Data from 2021 to 2022 indicates that TB cases increased but were still lower than they were in 2019 [30].

In the US, urban areas experienced a higher incidence rate of COVID-19 for the first several months of the pandemic, and then the higher rate of incidents shifted over to rural areas [31]. The spread of infectious disease in rural areas was possibly due to localization, or increased exposure at locations, such as a gas station, where individuals go to obtain needed supplies. Rural areas were also at a high risk of morbidity and mortality for COVID-19 because of the combined factors of high disease burden and low healthcare capacity [31].

When adjusting for poverty, the most striking overall pattern was a shift from large clusters primarily centered on urban areas to many small clusters in more rural areas in the interior of the country. This suggests that the major driver of statistically high rates of infectious disease in the United States is (or is closely correlated with) poverty. In past studies of influenza clustering, poverty adjustment decreased the overall number of clusters by almost 90% [32]. The pattern of reduction for influenza persisted in this analysis, however the results were very different for COVID-19, HIV and TB. Here we saw a proliferation of clusters. After removing the statistical influence of poverty, there may be more localized effects associated with rural areas including lack of access to medical services, lower vaccination coverage, etc. that drives variability in disease rates. Those influences for COVID-19 are especially interesting and worthy of investigation, including whether clusters persisted in the same locations during different types of COVID-19 (wild type, delta, omicron).

The study was limited in that we were relying on separate data sources for each infectious disease, with different collection methods, accuracy, and some different years of availability. This is why we focused primarily on overall changes in patterns of disease rather than focusing on identifying specific counties for interventions. However, we do present county data in the supporting information if others are interested in comparing our results with their own.

Conclusion

Poverty is associated with the patterns of disease clusters for multiple infectious diseases, including HIV, TB, COVID-19 and influenza. However, following adjustment for poverty the clusters occurred in different locations and in different patterns, though mostly moving from large urban-centric clusters to smaller rural-centric clusters. This suggests that localized variation relative to mechanisms of disease spread play strong secondary roles for COVID-19, HIV and TB, and that variations leading to higher disease burden tend to be more pronounced in rural areas.

In both urban and rural areas, poverty is associated with statistically high rates of infectious disease in the United States. It is important to consider the impact that health interventions have on each of the urban and rural populations. Health interventions should be adjusted to meet the needs of the population to improve the social determinants of health in that community and combat poverty in the United States.

Supporting information

S1 File. File containing a map of the central cluster counties with the highest relative risk for each disease in the study, a second map showing the central cluster counties for multiple diseases, and a graph of the number of high-risk clusters by percent of the population below the poverty line.

(DOCX)

pone.0293431.s001.docx (375.5KB, docx)
S2 File. File with tables containing the data supporting figures found in S1 File.

(DOCX)

pone.0293431.s002.docx (17.3KB, docx)
S3 File. This file contains several tables showing the results for the unadjusted clusters for COVID-19, HIV, Influenza, and TB in the years 2019–2022.

Included in the tables are the county name, state, p-value, expected number of cases, observed number of cases, the relative risk for the disease, and the county population.

(DOCX)

pone.0293431.s003.docx (28.5KB, docx)
S4 File. File containing tables which list counties with a high relative risk for the same disease in consecutive years.

Included in the table are the county name, state, p-value, expected number of cases, observed number of cases, the relative risk for the disease, and the county population.

(DOCX)

pone.0293431.s004.docx (18.3KB, docx)
S5 File. This file contains tables listing the counties that had a high relative risk for two different diseases in the unadjusted analysis.

Included in the table are the county name, state, p-value, expected number of cases, observed number of cases, the relative risk for the disease, and the county population.

(DOCX)

pone.0293431.s005.docx (17.1KB, docx)
S6 File. The included tables list the counties that were at a high relative risk for each of the diseases, COVID-19, HIV, Influenza, and TB in the years 2019–2022 in the adjusted analysis.

Included in the table are the county name, state, p-value, expected number of cases, observed number of cases, the relative risk for the disease, the county population, the number of individuals below the poverty line in the county, and the percent of the county population that is 125% below the US poverty line.

(DOCX)

pone.0293431.s006.docx (70.5KB, docx)
S7 File. The tables included in this file list the counties with a high relative risk for the same disease in consecutive years, adjusted for poverty.

Included in the table are the county name, state, p-value, expected number of cases, observed number of cases, the relative risk for the disease, the county population, the number of individuals below the poverty line in the county, and the percent of the county population that is 125% below the US poverty line.

(DOCX)

pone.0293431.s007.docx (40.4KB, docx)
S8 File. File containing tables which show the counties that had a high relative risk for two different diseases, adjusted for poverty.

Included in the table are the county name, state, p-value, expected number of cases, observed number of cases, the relative risk for the disease, the county population, the number of individuals below the poverty line in the county, and the percent of the county population that is 125% below the US poverty line.

(DOCX)

pone.0293431.s008.docx (36.5KB, docx)

Data Availability

https://githubcom/nytimes/covid-19-data2021 https://www.cdc.gov/nchhstp/atlas/index.htm https://www.cdc.gov/flu/weekly/overview.htm#Viral https://www.cdc.gov/flu/fluvaxview/interactive.htm

Funding Statement

The author(s) received no specific funding for this work.

References

  • 1.Mamelund S-E, Dimka J. Social inequalities in infectious diseases. SAGE Publications Sage UK: London, England; 2021. p. 675–80. [DOI] [PubMed] [Google Scholar]
  • 2.Dheda K, Perumal T, Moultrie H, Perumal R, Esmail A, Scott AJ, et al. The intersecting pandemics of tuberculosis and COVID-19: population-level and patient-level impact, clinical presentation, and corrective interventions. The Lancet Respiratory Medicine. 2022. doi: 10.1016/S2213-2600(22)00092-3 [DOI] [PMC free article] [PubMed] [Google Scholar]
  • 3.Patel JA, Nielsen F, Badiani AA, Assi S, Unadkat V, Patel B, et al. Poverty, inequality and COVID-19: the forgotten vulnerable. Public health. 2020;183:110. doi: 10.1016/j.puhe.2020.05.006 [DOI] [PMC free article] [PubMed] [Google Scholar]
  • 4.Pereira M, Oliveira AM. Poverty and food insecurity may increase as the threat of COVID-19 spreads. Public health nutrition. 2020;23(17):3236–40. doi: 10.1017/S1368980020003493 [DOI] [PMC free article] [PubMed] [Google Scholar]
  • 5.Whitehead M, Taylor-Robinson D, Barr B. Poverty, health, and covid-19. British Medical Journal Publishing Group; 2021. [DOI] [PubMed] [Google Scholar]
  • 6.Hui EK-W. Reasons for the increase in emerging and re-emerging viral infectious diseases. Microbes and infection. 2006;8(3):905–16. doi: 10.1016/j.micinf.2005.06.032 [DOI] [PMC free article] [PubMed] [Google Scholar]
  • 7.Acevedo-Garcia D. Residential segregation and the epidemiology of infectious diseases. Social science & medicine. 2000;51(8):1143–61. doi: 10.1016/s0277-9536(00)00016-2 [DOI] [PubMed] [Google Scholar]
  • 8.Mitani AA, Haneuse S. Small data challenges of studying rare diseases. JAMA network open. 2020;3(3):e201965-e. doi: 10.1001/jamanetworkopen.2020.1965 [DOI] [PubMed] [Google Scholar]
  • 9.Visca D, Ong C, Tiberi S, Centis R, D’ambrosio L, Chen B, et al. Tuberculosis and COVID-19 interaction: a review of biological, clinical and public health effects. Pulmonology. 2021;27(2):151–65. doi: 10.1016/j.pulmoe.2020.12.012 [DOI] [PMC free article] [PubMed] [Google Scholar]
  • 10.Gao Y, Liu M, Chen Y, Shi S, Geng J, Tian J. Association between tuberculosis and COVID‐19 severity and mortality: a rapid systematic review and meta‐analysis. Journal of medical virology. 2021;93(1):194. doi: 10.1002/jmv.26311 [DOI] [PMC free article] [PubMed] [Google Scholar]
  • 11.Group TC-GS. Tuberculosis and COVID-19 co-infection: description of the global cohort. European Respiratory Journal. 2022;59(3). [DOI] [PMC free article] [PubMed] [Google Scholar]
  • 12.Ssentongo P, Heilbrunn ES, Ssentongo AE, Advani S, Chinchilli VM, Nunez JJ, et al. Epidemiology and outcomes of COVID-19 in HIV-infected individuals: a systematic review and meta-analysis. Scientific reports. 2021;11(1):6283. doi: 10.1038/s41598-021-85359-3 [DOI] [PMC free article] [PubMed] [Google Scholar]
  • 13.González-Domenech CM, Pérez-Hernández I, Gómez-Ayerbe C, Viciana Ramos I, Palacios-Muñoz R, Santos J. A pandemic within other pandemics. when a multiple infection of a host occurs: SARS-CoV-2, HIV and Mycobacterium tuberculosis. Viruses. 2021;13(5):931. doi: 10.3390/v13050931 [DOI] [PMC free article] [PubMed] [Google Scholar]
  • 14.Abdoli A, Falahi S, Kenarkoohi A. COVID-19-associated opportunistic infections: a snapshot on the current reports. Clinical and experimental medicine. 2022;22(3):327–46. doi: 10.1007/s10238-021-00751-7 [DOI] [PMC free article] [PubMed] [Google Scholar]
  • 15.Marín‐Hernández D, Schwartz RE, Nixon DF. Epidemiological evidence for association between higher influenza vaccine uptake in the elderly and lower COVID‐19 deaths in Italy. Journal of medical virology. 2021;93(1):64. doi: 10.1002/jmv.26120 [DOI] [PMC free article] [PubMed] [Google Scholar]
  • 16.Louie J, Reid M, Stella J, Agraz-Lara R, Graves S, Chen L, et al. A decrease in tuberculosis evaluations and diagnoses during the COVID-19 pandemic. Int J Tuberc Lung Dis. 2020;24(8):860–2. doi: 10.5588/ijtld.20.0364 [DOI] [PubMed] [Google Scholar]
  • 17.Deutsch-Feldman M, Pratt RH, Price SF, Tsang CA, Self JL. Tuberculosis—United States, 2020. Morbidity and Mortality Weekly Report. 2021;70(12):409. doi: 10.15585/mmwr.mm7012a1 [DOI] [PMC free article] [PubMed] [Google Scholar]
  • 18.Times TNY. Coronavirus (Covid-19) Data in the United States. https://githubcom/nytimes/covid-19-data2021.
  • 19.Centers for Disease Control and Prevention. US influenza surveillance: purpose and methods. US Influenza Surveillance: Purpose and Methods| CDC. 2021.
  • 20.Prevention CfDCa. NCHHSTP AtlasPlus 2023 [Available from: https://www.cdc.gov/nchhstp/atlas/index.htm.
  • 21.Prevention CfDCa. Tuberculosis (TB) (Mycobacterium tuberculosis) 2009 Case Definition. 2021. In: National Notifiable Diseases Surveillance System [Internet]. Available from: https://ndc.services.cdc.gov/case-definitions/tuberculosis-2009/.
  • 22.Prevention CfDCa. Terms, Definitions, and Calculations Surveillance Overview HIV 2022 [Available from: https://www.cdc.gov/hiv/statistics/surveillance/terms.html#:~:text=The%20surveillance%20case%20definition%20is,2%2C%203%2C%20or%20unknown)%3A.
  • 23.Prevention CfDCa. U.S. Influenza Surveillance: Purpose and Methods 2023 [Available from: https://www.cdc.gov/flu/weekly/overview.htm#Viral.
  • 24.Prevention CfDCa. Influenza. 2017. In: Vaccine Preventable Diseases Surveillance Manual [Internet]. Available from: https://www.cdc.gov/vaccines/pubs/surv-manual/chpt06-influenza.html#:~:text=A%20case%20definition%20of%20fever,seen%20for%20ILI%20each%20week.
  • 25.Abdurrob A & Kulldorff M. Satscan tutorial #3 advanced options Brigham and Women’s Hospital Harvard Medical School; 2016. Available from: https://www.satscan.org/tutorials/advancedoptions/SaTScanTutorialAdvancedOptions.pdf.
  • 26.Neiderud C-J. How urbanization affects the epidemiology of emerging infectious diseases. Infection ecology & epidemiology. 2015;5(1):27060. doi: 10.3402/iee.v5.27060 [DOI] [PMC free article] [PubMed] [Google Scholar]
  • 27.Santibañez S, Bellis KS, Bay A, Chung CL, Bradley K, Gibson D, et al. Strengthening rural states’ capacity to prepare for and respond to emerging infectious diseases, 2013–2015. Southern Medical Journal. 2019;112(2):101. doi: 10.14423/SMJ.0000000000000930 [DOI] [PMC free article] [PubMed] [Google Scholar]
  • 28.Olsen SJ, Azziz-Baumgartner E, Budd AP, Brammer L, Sullivan S, Pineda RF, et al. Decreased influenza activity during the covid-19 pandemic—United States, Australia, Chile, and South Africa, 2020. American Journal of Transplantation. 2020;20(12):3681–5. doi: 10.1111/ajt.16381 [DOI] [PMC free article] [PubMed] [Google Scholar]
  • 29.Prevention CfDCa. FluVaxView Interactive 2023 [Available from: https://www.cdc.gov/flu/fluvaxview/interactive.htm.
  • 30.Prevention CfDCa. TB is Still Here–New CDC Data Show U.S. Cases Increased Again in 2022. CDC Newsroom. 2023.
  • 31.Cuadros DF, Branscum AJ, Mukandavire Z, Miller FD, MacKinnon N. Dynamics of the COVID-19 epidemic in urban and rural areas in the United States. Annals of epidemiology. 2021;59:16–20. doi: 10.1016/j.annepidem.2021.04.007 [DOI] [PMC free article] [PubMed] [Google Scholar]
  • 32.Sloan C, Chandrasekhar R, Mitchel E, Ndi D, Miller L, Thomas A, et al. Spatial and temporal clustering of patients hospitalized with laboratory-confirmed influenza in the united states. Epidemics. 2020;31:100387. doi: 10.1016/j.epidem.2020.100387 [DOI] [PubMed] [Google Scholar]

Decision Letter 0

Sana Eybpoosh

31 Jul 2023

PONE-D-23-15168Concurrent Disease Burden from Multiple Infectious Diseases and the Influence of Social Determinants in the Contiguous United StatesPLOS ONE

Dear Dr. Sloan-Aagard,

Thank you for submitting your manuscript to PLOS ONE. After careful consideration, we feel that it has merit but does not fully meet PLOS ONE’s publication criteria as it currently stands. Therefore, we invite you to submit a revised version of the manuscript that addresses the points raised during the review process.

==============================

ACADEMIC EDITOR: 

The manuscript addresses an important issue and has merit. However, authors must carefully attend to the concerns raised by the reviewers. This involves addressing various aspects:

  • Ensuring language and terminology are clear in the entire text, tables, and figures.

  • Expanding on the study's justification and objectives for better understanding.

  • Providing necessary clarifications on study design, datasets, definitions, and analyses.

  • Enhancing graph color contrast for better visual clarity.

  • Elaborating further on study conclusions and their implications.

By addressing these points, the authors can substantially enhance the manuscript's clarity, validity, and impact.

==============================

Please submit your revised manuscript by Sep 14 2023 11:59PM. If you will need more time than this to complete your revisions, please reply to this message or contact the journal office at plosone@plos.org. When you're ready to submit your revision, log on to https://www.editorialmanager.com/pone/ and select the 'Submissions Needing Revision' folder to locate your manuscript file.

Please include the following items when submitting your revised manuscript:

  • A rebuttal letter that responds to each point raised by the academic editor and reviewer(s). You should upload this letter as a separate file labeled 'Response to Reviewers'.

  • A marked-up copy of your manuscript that highlights changes made to the original version. You should upload this as a separate file labeled 'Revised Manuscript with Track Changes'.

  • An unmarked version of your revised paper without tracked changes. You should upload this as a separate file labeled 'Manuscript'.

If you would like to make changes to your financial disclosure, please include your updated statement in your cover letter. Guidelines for resubmitting your figure files are available below the reviewer comments at the end of this letter.

If applicable, we recommend that you deposit your laboratory protocols in protocols.io to enhance the reproducibility of your results. Protocols.io assigns your protocol its own identifier (DOI) so that it can be cited independently in the future. For instructions see: https://journals.plos.org/plosone/s/submission-guidelines#loc-laboratory-protocols. Additionally, PLOS ONE offers an option for publishing peer-reviewed Lab Protocol articles, which describe protocols hosted on protocols.io. Read more information on sharing protocols at https://plos.org/protocols?utm_medium=editorial-email&utm_source=authorletters&utm_campaign=protocols.

We look forward to receiving your revised manuscript.

Kind regards,

Sana Eybpoosh

Academic Editor

PLOS ONE

Journal requirements:

When submitting your revision, we need you to address these additional requirements.

1. Please ensure that your manuscript meets PLOS ONE's style requirements, including those for file naming. The PLOS ONE style templates can be found at

https://journals.plos.org/plosone/s/file?id=wjVg/PLOSOne_formatting_sample_main_body.pdf and

https://journals.plos.org/plosone/s/file?id=ba62/PLOSOne_formatting_sample_title_authors_affiliations.pdf

2. We note that Figures 1A,1B,2 and 3 in your submission contain [map/satellite] images which may be copyrighted. All PLOS content is published under the Creative Commons Attribution License (CC BY 4.0), which means that the manuscript, images, and Supporting Information files will be freely available online, and any third party is permitted to access, download, copy, distribute, and use these materials in any way, even commercially, with proper attribution. For these reasons, we cannot publish previously copyrighted maps or satellite images created using proprietary data, such as Google software (Google Maps, Street View, and Earth). For more information, see our copyright guidelines: http://journals.plos.org/plosone/s/licenses-and-copyright.

We require you to either (1) present written permission from the copyright holder to publish these figures specifically under the CC BY 4.0 license, or (2) remove the figures from your submission:

a. You may seek permission from the original copyright holder of Figures 1A,1B,2 and 3  to publish the content specifically under the CC BY 4.0 license. 

We recommend that you contact the original copyright holder with the Content Permission Form (http://journals.plos.org/plosone/s/file?id=7c09/content-permission-form.pdf) and the following text:

“I request permission for the open-access journal PLOS ONE to publish XXX under the Creative Commons Attribution License (CCAL) CC BY 4.0 (http://creativecommons.org/licenses/by/4.0/). Please be aware that this license allows unrestricted use and distribution, even commercially, by third parties. Please reply and provide explicit written permission to publish XXX under a CC BY license and complete the attached form.”

Please upload the completed Content Permission Form or other proof of granted permissions as an "Other" file with your submission.

In the figure caption of the copyrighted figure, please include the following text: “Reprinted from [ref] under a CC BY license, with permission from [name of publisher], original copyright [original copyright year].”

b. If you are unable to obtain permission from the original copyright holder to publish these figures under the CC BY 4.0 license or if the copyright holder’s requirements are incompatible with the CC BY 4.0 license, please either i) remove the figure or ii) supply a replacement figure that complies with the CC BY 4.0 license. Please check copyright information on all replacement figures and update the figure caption with source information. If applicable, please specify in the figure caption text when a figure is similar but not identical to the original image and is therefore for illustrative purposes only.

The following resources for replacing copyrighted map figures may be helpful:

USGS National Map Viewer (public domain): http://viewer.nationalmap.gov/viewer/

The Gateway to Astronaut Photography of Earth (public domain): http://eol.jsc.nasa.gov/sseop/clickmap/

Maps at the CIA (public domain): https://www.cia.gov/library/publications/the-world-factbook/index.html and https://www.cia.gov/library/publications/cia-maps-publications/index.html

NASA Earth Observatory (public domain): http://earthobservatory.nasa.gov/

Landsat: http://landsat.visibleearth.nasa.gov/

USGS EROS (Earth Resources Observatory and Science (EROS) Center) (public domain): http://eros.usgs.gov/#

Natural Earth (public domain): http://www.naturalearthdata.com/

3. Please include captions for your Supporting Information files at the end of your manuscript, and update any in-text citations to match accordingly. Please see our Supporting Information guidelines for more information: http://journals.plos.org/plosone/s/supporting-information.

[Note: HTML markup is below. Please do not edit.]

Reviewers' comments:

Reviewer's Responses to Questions

Comments to the Author

1. Is the manuscript technically sound, and do the data support the conclusions?

The manuscript must describe a technically sound piece of scientific research with data that supports the conclusions. Experiments must have been conducted rigorously, with appropriate controls, replication, and sample sizes. The conclusions must be drawn appropriately based on the data presented.

Reviewer #1: Yes

Reviewer #2: Yes

**********

2. Has the statistical analysis been performed appropriately and rigorously?

Reviewer #1: I Don't Know

Reviewer #2: Yes

**********

3. Have the authors made all data underlying the findings in their manuscript fully available?

The PLOS Data policy requires authors to make all data underlying the findings described in their manuscript fully available without restriction, with rare exception (please refer to the Data Availability Statement in the manuscript PDF file). The data should be provided as part of the manuscript or its supporting information, or deposited to a public repository. For example, in addition to summary statistics, the data points behind means, medians and variance measures should be available. If there are restrictions on publicly sharing data—e.g. participant privacy or use of data from a third party—those must be specified.

Reviewer #1: Yes

Reviewer #2: Yes

**********

4. Is the manuscript presented in an intelligible fashion and written in standard English?

PLOS ONE does not copyedit accepted manuscripts, so the language in submitted articles must be clear, correct, and unambiguous. Any typographical or grammatical errors should be corrected at revision, so please note any specific errors here.

Reviewer #1: Yes

Reviewer #2: Yes

**********

5. Review Comments to the Author

Please use the space provided to explain your answers to the questions above. You may also include additional comments for the author, including concerns about dual publication, research ethics, or publication ethics. (Please upload your review as an attachment if it exceeds 20,000 characters)

Reviewer #1: Abstract:

Please write numbers less than 10 in letters (in the whole of the text)

Introduction:

Please replace "vaccination rates" with vaccination coverage.

Please justify the necessity of this study and write the aim of the study, in the last paragraph of the introduction.

Methods:

What is your study design?

What are the existing data sets? Do you mean the surveillance system?

Please refer to the source of data. In addition, please provide the definition of TB, HIV, COVID-19, and influenza in the US surveillance system.

Please provide the definition of a cluster for TB, HIV, COVID-19, and Influenza.

How to determine the expected cases?

What is the definition of high-risk and low-risk areas and clusters?

Please define the dependent variable. How to measure the dependent variable?

What are the covariates, and how to measure them?

How to assess the socioeconomic status of counties?

Results

In the first paragraph of the results, describe your data. For example, number of counties and incidence of the mentioned diseases in each county, and percent of the population below the poverty line in each county.

The authors declared "The percent of the county population at or below 125% of the US poverty level in counties identified as part of clusters ranged from 7.65% to 44.8%" 125% is correct?

Reviewer #2: Comments of Reviewer

This study aims to assess concurrent disease burden from multiple infectious diseases and the influence of social determinants in the contiguous United States. They applied the Kulldorff scan statistic to examine the relative risk of each disease by year depending on available data on COVID-19, HIV, influenza, and tuberculosis by county in the United States from 2019-2022. The unadjusted analysis showed higher numbers of clusters of TB, HIV, and influenza in urban areas, the south, and along the coastline, while COVID-19 clusters appeared separate. Upon adjusting for poverty, much more localized and rural clusters more in the interior of the country for HIV, TB and COVID-19. In my opinion, the obtained results can be used to inform policy makers and the public health. However, there are some issues that need to be addressed.

Major

1- I have concerns about the structure of this manuscript. The introduction and method of this manuscript is written very briefly. This manuscript does not have a conclusion section; it seems that it is better to add conclusion to the manuscript.

Abstract

Introduction

1- The introduction section is written very briefly, it is better to explain more about a brief statement of the overall aim of the work and a comment about whether that aim was achieved in the last paragraph. Moreover, please define the problem addressed and why it is important.

Method

1- Please clarify that you used the radius of the population coverage or the geographical radius? Why?

2- Please clarify that the discrete Poisson probability model or Poisson model was used because the incidence for some disease like TB and HIV were not very high

3- Please explain more about the most likely cluster area, and other clusters.

4- Please explain more about the selection of the maximum radius of the spatial

scanning window and the maximum length of the temporal scanning window. Why did you consider the maximal spatial cluster 10% of the population at risk?

5- Please clarify that you used monthly or annual incidences.

6- Please explain more about circular window.

7- Please clarify that did your study have an ethical approval and ethical code?

Results

1- Please move the first paragraph of the results in to the method section.

2- Please change the colors in the Graphs, the colors are not recognizable.

**********

6. PLOS authors have the option to publish the peer review history of their article (what does this mean?). If published, this will include your full peer review and any attached files.

If you choose “no”, your identity will remain anonymous but your review may still be made public.

Do you want your identity to be public for this peer review? For information about this choice, including consent withdrawal, please see our Privacy Policy.

Reviewer #1: No

Reviewer #2: No

**********

[NOTE: If reviewer comments were submitted as an attachment file, they will be attached to this email and accessible via the submission site. Please log into your account, locate the manuscript record, and check for the action link "View Attachments". If this link does not appear, there are no attachment files.]

While revising your submission, please upload your figure files to the Preflight Analysis and Conversion Engine (PACE) digital diagnostic tool, https://pacev2.apexcovantage.com/. PACE helps ensure that figures meet PLOS requirements. To use PACE, you must first register as a user. Registration is free. Then, login and navigate to the UPLOAD tab, where you will find detailed instructions on how to use the tool. If you encounter any issues or have any questions when using PACE, please email PLOS at figures@plos.org. Please note that Supporting Information files do not need this step.

Attachment

Submitted filename: Comments.docx

pone.0293431.s009.docx (11.9KB, docx)
PLoS One. 2024 Sep 4;19(9):e0293431. doi: 10.1371/journal.pone.0293431.r002

Author response to Decision Letter 0


14 Sep 2023

Responses to Editor and Reviewers

A. Comments from the Editor:

1. Editor: Please ensure that your manuscript meets PLOS ONE's style requirements, including those for file naming. The PLOS ONE style templates can be found at

https://journals.plos.org/plosone/s/file?id=wjVg/PLOSOne_formatting_sample_main_body.pdf and

https://journals.plos.org/plosone/s/file?id=ba62/PLOSOne_formatting_sample_title_authors_affiliations.pdf

Response: Thank you for reminding us of the templates. We reviewed the manuscript and changed the heading font size to 18 for level 1 headings, to font size 16 for level 2 headings, and to font size 14 for level 3 headings. We added page and line numbers to the document and inserted paragraph indentations. We changed figure citations to “Fig 1A” instead of “Figure 1A,” and capitalized table citations from “tables 1-3” to “Tables 1-3.” We revised the captions for Figures 1A, 1B, 2, 3, 4A and 4B to list the figure name, title, and legend in the format shown in the template. The tables are lengthy and were maintained in the supplement to the manuscript. The files for the figures were renamed “Fig 1A.tif” etc. to fit the requirements.

We adjusted the title so that the first word of the title and proper nouns were the only capitalized words. We examined the names and affiliations to ensure that it was accurate and according to the guidelines.

2. Editor: We note that Figures 1A,1B,2 and 3 in your submission contain [map/satellite] images which may be copyrighted. All PLOS content is published under the Creative Commons Attribution License (CC BY 4.0), which means that the manuscript, images, and Supporting Information files will be freely available online, and any third party is permitted to access, download, copy, distribute, and use these materials in any way, even commercially, with proper attribution. For these reasons, we cannot publish previously copyrighted maps or satellite images created using proprietary data, such as Google software (Google Maps, Street View, and Earth). For more information, see our copyright guidelines: http://journals.plos.org/plosone/s/licenses-and-copyright.

Response: The images were created using tiger shapefiles (https://www.census.gov/geographies/mapping-files/time-series/geo/tiger-line-file.html) and data from the cited data sources (NY Times, CDC, and US Influenza Surveillance) into the software ArcGIS Pro. On page 9 of the shapefile technical documentation, it states, “Copyright protection is not available for any work of the United States Government (Title 17 U.S.C., Section 105). Thus, you are free to reproduce census materials as you see fit. We would ask, however, that you cite the Census Bureau as the source.” The images in this manuscript are not previously copyrighted and are original to the research. We added citations for the US Census Bureau for the map shapefiles throughout the manuscript.

3. Editor: Please include captions for your Supporting Information files at the end of your manuscript, and update any in-text citations to match accordingly. Please see our Supporting Information guidelines for more information.

Response: Thank you for explaining that the captions for the supporting information should be at the end of the manuscript. After the references, we added the titles for the captions in the format described. Many of the captions have legends included.

B. Comments from Reviewer #1:

1. Reviewer:

Abstract:

Please write numbers less than 10 in letters (in the whole of the text)

Response: Thank you for your correction. The numbers less than 10 were written out in letters. On line 15, “3” was changed to “three”. On line 127, “3” was changed to “three”.

2. Reviewer:

Introduction:

Please replace "vaccination rates" with vaccination coverage.

Please justify the necessity of this study and write the aim of the study, in the last paragraph of the introduction.

Response: We replaced "Vaccination rates" was replaced with vaccination coverage.

The following sentence was added to the end of the introduction to justify and clarify the aim of the study, “This study aims to examine whether counties in the United States experience concurrent excessive burden from multiple infectious diseases and identify if those patterns are associated with underlying socioeconomic status.”

3. Reviewer: The reviewer provided an excellent series of questions related to the Methods Section. We answer each in turn below and in the document.

What is your study design?

This study was a descriptive ecological study. It investigated infectious diseases across counties in the US at a point in time from the years for which data were available.

What are the existing data sets? Do you mean the surveillance system? Please refer to the source of data.

The existing data sets were taken from the NY Times, US CDC influenza surveillance, and US CDC NCHHSTP as described in the manuscript, found in references, 18, 19 and 20 respectively.

18. Times TNY. Coronavirus (Covid-19) Data in the United States.

19. Centers for Disease Control and Prevention. US influenza surveillance: purpose and methods. US Influenza Surveillance: Purpose and Methods CDC. 2021.

20. Centers for Disease Control and Prevention. NCHHSTP AtlasPlus 2023.

In addition, please provide the definition of TB, HIV, COVID-19, and influenza in the US surveillance system.

The surveillance case definition for COVID-19 provided by the NY times is the total number of both confirmed and probable cases. Individuals with a confirmed case had a positive laboratory COVID-19 test reported by a federal, state, territorial or local government agency. Only tests that detected viral RNA in the sample were considered confirmatory. A probable case counted individuals that did not have a confirmed test but were evaluated by public health officials using criteria developed by states and the federal government and reported by a health department. Laboratory, epidemiological, clinical and vital records were considered evidence by public health officials. Tests that detected antigens or antibodies were considered evidence towards a “probable” case, but were not sufficient on their own, according to the Council of State and Territorial Epidemiologists.

The surveillance case definition for TB was a case that met the clinical case definition or was laboratory confirmed. The clinical case definition included a positive tuberculin skin test or positive interferon gamma release for M. tuberculosis, other signs and symptoms compatible with TB such as an abnormal chest radiograph or abnormal chest computerized tomography scan, treatment with two or more anti-TB medications, or a completed diagnostic evaluation. The laboratory criteria for a case diagnosis was isolation of M. tuberculosis from a clinical specimen, demonstration of M. tuberculosis complex from a clinical specimen by nucleic acid amplification test, or the demonstration of acid-fast bacilli in a clinical specimen when a culture has not been or cannot be obtained or is falsely negative or contaminated.

The surveillance case definition for influenza was laboratory confirmation as well as signs and symptoms. A laboratory definition included virus isolation, molecular detection, detection of viral antigens or rapid influenza diagnostic tests, use of immunohistochemistry, or a serologic testing using hemagglutination inhibition or microneutralization. The case definition was a fever 100⁰F or higher and a cough/sore throat used by the CDC in the US Outpatient Influenza-like Illness Surveillance Network, in which healthcare providers report the total number of patient visits and number of patients seen for ILI every week. The influenza data was collected from the CDC Flu view for seasons 2019-20 and 2020-21 and includes all influenza strains.

The surveillance case definition for HIV was a confirmed case in one of the five HIV infection stages (0, 1, 2, 3, or unknown). After the first HIV infection diagnosis, if there was a negative HIV infection diagnosis then the stage is 0. The other stages are determined by the following table:

HIV infection stage, based on age-specific CD4+ T-lymphocyte count or CD4+ T-lymphocyte percentage of total lymphocytes

Stage Cells (<1 year) % (<1 year) Cells (1-5 years) % (1-5 years) Cells (6 years) % (6 years)

1 ≥1500 ≥34 ≥1000 ≥30 ≥500 ≥26

2 750-1499 26-33 500-999 22-29 200-499 14-25

3 <750 <26 <500 <22 <200 <14

The above information and table was made available from the following source: Centers for Disease Control and Prevention. Terms, Definitions, and Calculations Surveillance Overview HIV 2022 [Available from: https://www.cdc.gov/hiv/statistics/surveillance/terms.html

Please provide the definition of a cluster for TB, HIV, COVID-19, and Influenza.

The definition of a cluster for TB, HIV, COVID-19, and influenza was a geographical area with a significantly higher number of observed cases than expected cases.

How to determine the expected cases? What is the definition of high-risk and low-risk areas and clusters?

Expected cases were determined using a spatial scan statistic software (SaTScan) to analyze the geographical distribution of infectious disease cases in the contiguous United States. The spatial scan statistic evenly distributed the risk of each disease (i.e. TB cases for 2020) across counties, which is the expected case count. The expected cases were then compared to the observed cases using a Markov Chain Monte Carlo method to discern counties with a statistically higher or lower than expected cases according to likelihood. Counties with an associated p-value <0.05 were considered significant. We refer the reader to the SaTScan documentation for more detail.

Please define the dependent variable. How to measure the dependent variable?

The dependent variable was frequency of occurrence of each disease in each county within a given year, adjusted by the underlying population.

What are the covariates, and how to measure them?

The primary covariate was the percent of the population at or below 125% of the Federal poverty level as obtained from the 2020 US Census, as described.

How to assess the socioeconomic status of counties?

Socioeconomic status can be measured using multiple variables. We selected the percentage of the population at or below 125% of the Federal Poverty Level because poverty is associated with many health-related outcomes in the US, including access to care and insurance coverage.

4. Reviewer: In the first paragraph of the results, describe your data. For example, number of counties and incidence of the mentioned diseases in each county, and percent of the population below the poverty line in each county.

The authors declared "The percent of the county population at or below 125% of the US poverty level in counties identified as part of clusters ranged from 7.65% to 44.8%" 125% is correct?

Response: Thank you for the feedback. We included more information describing the data in the first paragraph. Yes, the statement is accurate according to the research, but we rephrased it for clarification.

C. Comments from Reviewer #2:

1. Reviewer: I have concerns about the structure of this manuscript. The introduction and method of this manuscript is written very briefly. This manuscript does not have a conclusion section; it seems that it is better to add conclusion to the manuscript.

Response: Thank you for your feedback. Additions were included in the introduction and methods sections to better explain the process of this research. A conclusion was added to the manuscript.

2. Reviewer:

Introduction

The introduction section is written very briefly; it is better to explain more about a brief statement of the overall aim of the work and a comment about whether that aim was achieved in the last paragraph. Moreover, please define the problem addressed and why it is important.

Response: Thank you, we agree that more information should be added to the introduction. We added, “This study aims to examine whether counties in the United States experience concurrent excessive burden from multiple infectious diseases and identify if those patterns are associated with underlying socioeconomic status.”

3. Reviewer: The reviewer provided a series of excellent comments related to the methods section. We answer each in turn below, and corresponding updated language can be found in the manuscript.

Please clarify that you used the radius of the population coverage or the geographical radius? Why?

The radius described in the manuscript was of each high-risk cluster. This cluster indicates the size of the geographic area with a significantly high risk of a specific infectious disease, and is standard SaTScan output.

Please clarify that the discrete Poisson probability model or Poisson model was used because the incidence for some disease like TB and HIV were not very high.

The discrete Poisson probability model was used in SaTScan. It was a purely spatial analysis. Incidence for TB cases were lower than the other diseases, and this is because of lower observation rates in counties throughout the US. The discrete Poisson probability model is better for low case counts.

Please explain more about the most likely cluster area, and other clusters.

High-risk clusters are geographic areas with a statistically significant concentration of one or multiple infectious diseases in the county. The most likely cluster is the high-risk cluster with the highest maximum likelihood. We report this as well as other clusters with a p-value <0.05.

Please explain more about the selection of the maximum radius of the spatial scanning window and the maximum length of the temporal scanning window. Why did you consider the maximal spatial cluster 10% of the population at risk?

The default maximum is 50% of the population, but we chose a smaller maximum because larger maximums are difficult to make a meaningful interpretation of. The choice of 10% followed some experimentation with different size radii, and seemed a good balance of being able to identify rural and urban clusters that improved our understanding of national patterns (not very tiny or very large).

Please clarify that you used monthly or annual incidences.

We used annual incidence.

Please explain more about circular window.

The SaTScan standard is to create circular windows, though elliptical windows are an option. We find elliptical windows to be less informative because you can have many overlapping ellipses rotated on different axis.

Please clarify that did your study have an ethical approval and ethical code?

This study was not subject to IRB approval because we used freely available datasets. However, we were very careful to use ethical mapping principles, including not displaying rates in counties with very low case counts.

4. Reviewer:

Please move the first paragraph of the results into the method section.

Please change the colors in the Graphs, the colors are not recognizable.

Response: Thank you. The first paragraph of the results section was moved to the end of the methods section.

We considered changing the colors of the graphs to make it clear which disease was which, but it was distracting, and we determined to keep the colors the same color as before in order to maintain the focus on the comparison of the number high-risk clusters and disease type.

Attachment

Submitted filename: response to reviewers_final.docx

pone.0293431.s010.docx (28.1KB, docx)

Decision Letter 1

Sana Eybpoosh

12 Oct 2023

Concurrent Disease Burden from Multiple Infectious Diseases and the Influence of Social Determinants in the Contiguous United States

PONE-D-23-15168R1

Dear Dr. Chantel Sloan-Aagard,

We’re pleased to inform you that your manuscript has been judged scientifically suitable for publication and will be formally accepted for publication once it meets all outstanding technical requirements.

Within one week, you’ll receive an e-mail detailing the required amendments. When these have been addressed, you’ll receive a formal acceptance letter and your manuscript will be scheduled for publication.

An invoice for payment will follow shortly after the formal acceptance. To ensure an efficient process, please log into Editorial Manager at http://www.editorialmanager.com/pone/, click the 'Update My Information' link at the top of the page, and double check that your user information is up-to-date. If you have any billing related questions, please contact our Author Billing department directly at authorbilling@plos.org.

If your institution or institutions have a press office, please notify them about your upcoming paper to help maximize its impact. If they’ll be preparing press materials, please inform our press team as soon as possible -- no later than 48 hours after receiving the formal acceptance. Your manuscript will remain under strict press embargo until 2 pm Eastern Time on the date of publication. For more information, please contact onepress@plos.org.

Kind regards,

Sana Eybpoosh

Academic Editor

PLOS ONE

Additional Editor Comments (optional):

Reviewers' comments:

Reviewer's Responses to Questions

Comments to the Author

1. If the authors have adequately addressed your comments raised in a previous round of review and you feel that this manuscript is now acceptable for publication, you may indicate that here to bypass the “Comments to the Author” section, enter your conflict of interest statement in the “Confidential to Editor” section, and submit your "Accept" recommendation.

Reviewer #2: All comments have been addressed

Reviewer #3: All comments have been addressed

**********

2. Is the manuscript technically sound, and do the data support the conclusions?

The manuscript must describe a technically sound piece of scientific research with data that supports the conclusions. Experiments must have been conducted rigorously, with appropriate controls, replication, and sample sizes. The conclusions must be drawn appropriately based on the data presented.

Reviewer #2: Yes

Reviewer #3: Yes

**********

3. Has the statistical analysis been performed appropriately and rigorously?

Reviewer #2: Yes

Reviewer #3: I Don't Know

**********

4. Have the authors made all data underlying the findings in their manuscript fully available?

The PLOS Data policy requires authors to make all data underlying the findings described in their manuscript fully available without restriction, with rare exception (please refer to the Data Availability Statement in the manuscript PDF file). The data should be provided as part of the manuscript or its supporting information, or deposited to a public repository. For example, in addition to summary statistics, the data points behind means, medians and variance measures should be available. If there are restrictions on publicly sharing data—e.g. participant privacy or use of data from a third party—those must be specified.

Reviewer #2: Yes

Reviewer #3: Yes

**********

5. Is the manuscript presented in an intelligible fashion and written in standard English?

PLOS ONE does not copyedit accepted manuscripts, so the language in submitted articles must be clear, correct, and unambiguous. Any typographical or grammatical errors should be corrected at revision, so please note any specific errors here.

Reviewer #2: Yes

Reviewer #3: Yes

**********

6. Review Comments to the Author

Please use the space provided to explain your answers to the questions above. You may also include additional comments for the author, including concerns about dual publication, research ethics, or publication ethics. (Please upload your review as an attachment if it exceeds 20,000 characters)

Reviewer #2: (No Response)

Reviewer #3: (No Response)

**********

7. PLOS authors have the option to publish the peer review history of their article (what does this mean?). If published, this will include your full peer review and any attached files.

If you choose “no”, your identity will remain anonymous but your review may still be made public.

Do you want your identity to be public for this peer review? For information about this choice, including consent withdrawal, please see our Privacy Policy.

Reviewer #2: No

Reviewer #3: Yes: Amin Doosti-Irani

**********

Associated Data

    This section collects any data citations, data availability statements, or supplementary materials included in this article.

    Supplementary Materials

    S1 File. File containing a map of the central cluster counties with the highest relative risk for each disease in the study, a second map showing the central cluster counties for multiple diseases, and a graph of the number of high-risk clusters by percent of the population below the poverty line.

    (DOCX)

    pone.0293431.s001.docx (375.5KB, docx)
    S2 File. File with tables containing the data supporting figures found in S1 File.

    (DOCX)

    pone.0293431.s002.docx (17.3KB, docx)
    S3 File. This file contains several tables showing the results for the unadjusted clusters for COVID-19, HIV, Influenza, and TB in the years 2019–2022.

    Included in the tables are the county name, state, p-value, expected number of cases, observed number of cases, the relative risk for the disease, and the county population.

    (DOCX)

    pone.0293431.s003.docx (28.5KB, docx)
    S4 File. File containing tables which list counties with a high relative risk for the same disease in consecutive years.

    Included in the table are the county name, state, p-value, expected number of cases, observed number of cases, the relative risk for the disease, and the county population.

    (DOCX)

    pone.0293431.s004.docx (18.3KB, docx)
    S5 File. This file contains tables listing the counties that had a high relative risk for two different diseases in the unadjusted analysis.

    Included in the table are the county name, state, p-value, expected number of cases, observed number of cases, the relative risk for the disease, and the county population.

    (DOCX)

    pone.0293431.s005.docx (17.1KB, docx)
    S6 File. The included tables list the counties that were at a high relative risk for each of the diseases, COVID-19, HIV, Influenza, and TB in the years 2019–2022 in the adjusted analysis.

    Included in the table are the county name, state, p-value, expected number of cases, observed number of cases, the relative risk for the disease, the county population, the number of individuals below the poverty line in the county, and the percent of the county population that is 125% below the US poverty line.

    (DOCX)

    pone.0293431.s006.docx (70.5KB, docx)
    S7 File. The tables included in this file list the counties with a high relative risk for the same disease in consecutive years, adjusted for poverty.

    Included in the table are the county name, state, p-value, expected number of cases, observed number of cases, the relative risk for the disease, the county population, the number of individuals below the poverty line in the county, and the percent of the county population that is 125% below the US poverty line.

    (DOCX)

    pone.0293431.s007.docx (40.4KB, docx)
    S8 File. File containing tables which show the counties that had a high relative risk for two different diseases, adjusted for poverty.

    Included in the table are the county name, state, p-value, expected number of cases, observed number of cases, the relative risk for the disease, the county population, the number of individuals below the poverty line in the county, and the percent of the county population that is 125% below the US poverty line.

    (DOCX)

    pone.0293431.s008.docx (36.5KB, docx)
    Attachment

    Submitted filename: Comments.docx

    pone.0293431.s009.docx (11.9KB, docx)
    Attachment

    Submitted filename: response to reviewers_final.docx

    pone.0293431.s010.docx (28.1KB, docx)

    Data Availability Statement

    https://githubcom/nytimes/covid-19-data2021 https://www.cdc.gov/nchhstp/atlas/index.htm https://www.cdc.gov/flu/weekly/overview.htm#Viral https://www.cdc.gov/flu/fluvaxview/interactive.htm


    Articles from PLOS ONE are provided here courtesy of PLOS

    RESOURCES