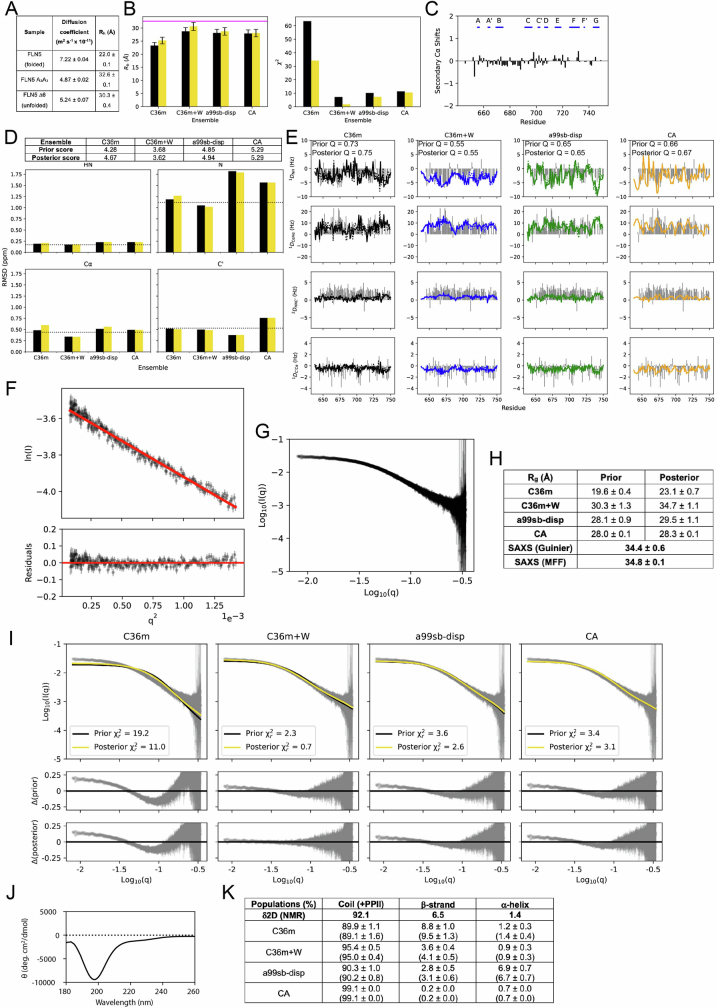
Extended Data Fig. 4. Validation of the ensembles against orthogonal data not used in the reweighting process.
(A) Diffusion coefficients (mean ± RMSE propagated from NMR intensity fits) and radius of hydration (Rh) (see methods) as measured for folded FLN5, FLN5 A3A3 and the unfolded state of FLN5Δ6, a previously characterised truncation variant24. (B) Comparison between the experimental Rh (32.6 ± 0.1 Å, plotted as a horizontal line in magenta) and the calculated Rh of the ensembles before (black bar) and after (yellow bar) reweighting. The error bars represent the uncertainty around the ensemble average expected from the forward model (see methods). The right panel shows the corresponding χ2 values, quantifying the agreement with the experimental data. (C) Secondary Cα chemical shifts of FLN5 A3A3 using the random coil shifts predicted by POTENCI139. (D) Comparison between experimental and calculated chemical shifts from the MD ensembles before (black bars) and after (yellow bar) reweighting for each nucleus. The table above the plot summarises a global agreement score, calculated by adding the nucleus specific RMSD values normalised by the error of the forward model. The forward model error is plotted as a horizontal line in the bar plots, taken as the RMSE values reported by the method124. (E) Comparison between the experimental RDCs (grey bars) measured in PEG/octanol with the simulated RDCs before (dotted line) and after reweighting with the PRE data (solid line). The RDC Q-factors are used to quantify the agreement. (F) Guinier region and linear fit (red line) to the experimental SAXS data (black circles). The bottom plot shows the residuals. (G) Experimental SAXS profile shown as a double log plot (mean ± errors propagated as determined by the ATSAS package80). (H) Ensemble-averaged Rg values obtained from the MD ensembles before (prior) and after reweighting (posterior) compared with the experimental value from the Guinier analysis in panel F, obtained with the autorg tool80, and the molecular form factor (MFF) analysis140. (I) Comparison of the experimental and theoretical SAXS profiles obtained from the MD ensembles before and after reweighting. The goodness of fit is quantified with the reduced χ2 and residuals are shown below the main plot for the prior and posterior ensembles. (J) CD spectrum of isolated FLN5 A3A3 recorded at 283 K. (K) Secondary structure populations obtained from the NMR chemical shifts with δ2D141 compared with average populations observed in the MD ensembles before (in parantheses) and after reweighting (mean ± SEM from block averaging).

