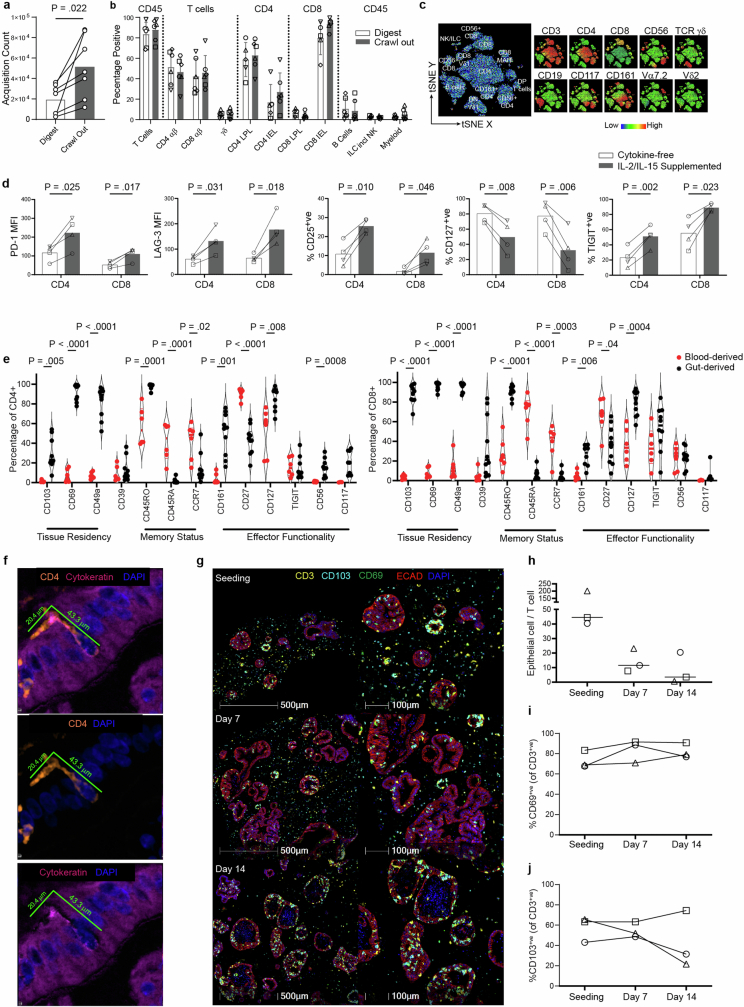
Extended Data Fig. 1. Intestinal TRM isolation and comparison to circulating T cells.
a, Comparison of viable CD45+ count in matched donors subjected to either digestion- or crawl out- based isolation. Two-tailed paired T-test. 7 biological replicates. b, Comparison of immune cell proportions subjected to either digestion- or crawl out- based isolation. Values represent percentages of parent population listed above each bar, as determined via flow cytometry. LPL lamina propria lymphocyte, IEL intraepithelial lymphocyte. Mean ± SD of 5 (Digest CD4 LPL, CD4 IEL, CD8 LPL, CD8 IEL, B cells) or 6 (all other conditions) biological replicates. Different symbol shapes represent individual donors. c, Flow cytometry-generated tSNE analysis of one intestinal lymphocyte isolation incorporating lineage-defining immune cell markers. Leftmost plot represents annotated cell populations with smaller plots displaying heatmaps for each of the 10 key surface markers assessed. DP double positive, DN double negative. Data is representative of six biologically-independent replicates. d, Bar charts comparing expression of key activation markers in gut-derived CD4+ and CD8+ T cells isolated via crawl out in cytokine-free or cytokine-supplemented (10IU/ml IL-2, 2 ng/ml IL-15) media in four biological replicates. Two-tailed paired T-test. e, Flow cytometry assessment of key functionality markers in CD4+ T cells (left graph) and CD8+ T cells (right graph) after crawl out isolation. Violin plots collate data from 10 (8 for CD117) independent intestinal tissue resections, 5 (3 for CD117) of which have matched blood-derived comparators, with 1 additional blood only sample. Two-tailed unpaired T-test between gut- and blood-derived expression values for each marker. f, mIF image of an elongated flossing T cell inserting itself between basal-lateral epithelial cell junctions. The 3 images are from the same region: upper image shows the full stain, middle image contains only CD4 and DAPI to emphasize the unusual shape of the T cell, lower image shows only DAPI and cytokeratin to reveal the space in the epithelium generated by the CD4 cell integration. Diameter of the T cell from head to tail is listed. Similar elongated T cells were observed in all IIO cultures analysed by mIF (n = 5). g, Representative mIF image of the IIO culture over time (upon immune cell introduction, 7 and 14 days later). Markers for T cell (CD3) and epithelial cell (ECAD: E-cadherin) identity, and tissue-residence (CD103 and CD69) are included. Data are quantified in (h-j). h, Ratio of epithelial cells to immune cells within identified organoids, during the course of a 14 day IIO culture. Line at median. i-j, Percent of CD3+ T cells expressing CD69 (i) or CD103 (j) during the course of a 14 day IIO culture, as determined by mIF. Data from h-j is derived from 3 biological replicates, with each individual donor represented by a different symbol.

