Abstract
Background
Leukocyte- and platelet-rich fibrin (L-PRF) is an autologous platelet concentrate, prepared by centrifugation of blood and consisting of a dense fibrin network with incorporated leukocytes and platelets. This study aims to perform an in-depth analysis of the cells, growth factors, and transcriptome of L-PRF.
Methods and results
Fresh, 1 week and 2 weeks cultured human L-PRF membranes and liquid L-PRF glue were characterized on cellular and transcriptional level using flow cytometry (n = 4), single-cell RNA sequencing (n = 5) and RT-qPCR. Growth factor kinetics were investigated using ELISA (EGF, VEGF, PDGF-AB, TGF-β1, bFGF). L-PRF contained a large number of viable cells (fresh 97.14 ± 1.09%, 1 week cultured 93.57 ± 1.68%), mainly granulocytes in fresh samples (53.9 ± 19.86%) and T cells in cultured samples (84.7 ± 6.1%), confirmed with scRNA-seq. Monocytes differentiate to macrophages during 1 week incubation. Specifically arterial L-PRF membranes were found to release significant amounts of VEGF, EGF, PDGF-AB and TGF-β1.
Conclusion
We characterized L-PRF using in vitro experiments, to obtain an insight in the composition of the material including a possible mechanistic role for tissue healing. This was the first study characterizing L-PRF at a combined cellular, proteomic, and transcriptional level.
Supplementary Information
The online version contains supplementary material available at 10.1007/s11033-024-09890-y.
Keywords: Leukocyte and platelet-rich fibrin, Platelet concentrate, Autologous, Characterization
Introduction
Wound healing is a complex process vital for tissue recovery, encompassing interactions between coagulation, inflammation, cell proliferation and tissue remodeling. Platelets are important during the first phase, regulating hemostasis and fibrin clot formation by their release of cytokines and growth factors, attracting leukocytes. Those leukocytes immediately start cleaning the wound site by removing bacteria and debris, and form a barrier against pathogens. Attraction of additional leukocytes is regulated by release of growth factors such as transforming growth factor β (TGF-β) or vascular endothelial growth factor (VEGF). Monocytes transform into macrophages under the influence of growth factors and produce VEGF and platelet-derived growth factor (PDGF) themselves, initiating the formation of granulation tissue. The proliferative phase is characterized by the formation of a provisional matrix involving fibroblasts. Here, growth factors induce cellular processes resulting in reorganization of the extracellular matrix, including angiogenesis. During the remodeling phase, the tissue regains strength and stability due to collagen remodeling.
Platelet concentrates are blood products containing platelets suspended in plasma. They have regenerative properties and are gaining interest as they may have an impact on the various phases of wound healing. The first generation of platelet concentrates (platelet-rich plasma or PRP) were obtained from patient’s blood after various biochemical processing, including two blood collection steps, two distinct centrifugation steps, and addition of an anticoagulant and coagulation activator, which resulted in a long preparation protocol with inconsistent results [1]. Leukocyte- and platelet-rich fibrin (L-PRF) is a second-generation platelet concentrate and currently one of the most commonly used platelet concentrates in various surgical disciplines [2–5]. This product is made by the centrifugation of autologous blood without anticoagulant [6]. Fibrin polymerization is triggered by centrifugation, resulting in a strong three dimensional fibrin network. Leukocytes and platelets get incorporated in the fibrin matrix due to the slow polymerization of fibrin fibers upon contact with the tube walls. For second generation platelet concentrates, elaborated protocols exist, resulting in more consistent results. Furthermore, the simple procedure allows for quick preparation using only one centrifugation step. Therefore, biosafety is assured as the material is completely autologous L-PRF can be applied in the form of a gel, i.e. liquid L-PRF glue, or as a compressed membrane.
Various studies have investigated L-PRF in vitro, in order to characterize the material. The cell-rich matrix of L-PRF contains up to 50% of the leukocytes and 97% of platelets of the original blood [7]. The presence of different growth factors has been documented, concentrated within the matrix after being released by platelets [8]. The fibrin matrix is thought to act as a reservoir, providing sustained growth factor release. Additionally, antimicrobial, angiogenic, and cell migration-inducing properties of L-PRF have been demonstrated [9–11]. Analysis of the secretome of L-PRF showed that growth factors such as epidermal growth factor (EGF), platelet-derived growth factor A (PDGFA) and transforming growth factor beta 1 (TGFB1), as well as proteins related to neutrophil and platelet degranulation could explain beneficial effects of L-PRF on wound healing [12].
L-PRF has not been investigated at the combined cellular, protein and transcriptional level. Additionally, differences between venous and arterial blood samples have also not been studied. This study aims to perform an in-depth analysis of the cells, growth factors, and transcriptome of L-PRF, hypothesizing that mechanisms taking place in the L-PRF are beneficial for wound healing. In order to observe the cellular activity, differentiation, and degradation, L-PRF was investigated both immediately after generation and later after prolonged incubation to mimic the real-life situation of L-PRF implanted in a (surgical) wound bed. Single-cell RNA sequencing (scRNA-seq) was performed to identify the cellular components of L-PRF and their transcriptional profile over time.
Materials and methods
Ethics approval and informed consent
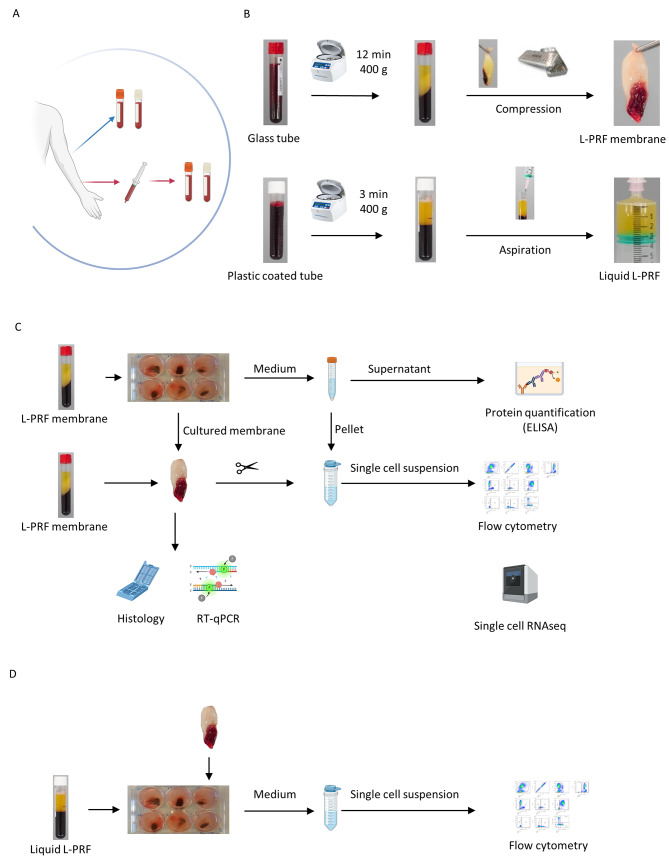
This study was approved by the local Ethical Committee of UZ Leuven (S61460 and S61636). Healthy volunteers were recruited in study S61636 for donation of venous blood. Patients at the department of neurosurgery, enrolled in study S61460, donated arterial blood during surgery (Fig. 1A). All participants signed informed consent prior to study enrollment. All procedures were in accordance with the Declaration of Helsinki and the Belgian Law relating to experiments on human persons (May 7, 2004).
Fig. 1.
Experimental design (A) Sample collection; venous and arterial blood collection in glass tubes (red-capped) and plastic-coated (white capped) collection tubes. (B) Preparation of L-PRF and liquid L-PRF glue. (C) In vitro set-up, culture (1 week and 2 weeks) of L-PRF membranes, preparation for histology and RT-qPCR, collection of medium for protein quantification of growth factors and D-dimers (ELISA), processing to single cell suspension of fresh and cultured membranes for single-cell week RNA sequencing and flow cytometry. (D) In vitro set up, culture and co- culture of liquid L-PRF glue with L-PRF membranes, processing to single cell suspension for flow cytometry
Blood collection and L-PRF preparation
L-PRF was prepared following the IntraSpin protocol (Fig. 1B). Venous blood was collected via venipuncture, directly in glass- or silica-coated tubes (A-PRF, Process for PRF, Nice, France and BVBCTP2_50, Intra-Lock, Boca Raton, FL, 455385). Arterial blood was collected in sterile syringes from the arterial line which was installed for the purpose of the surgery, in line with the methodology of our clinical study [13]. The blood was then immediately transferred to glass- or silica-coated tubes for L-PRF membrane and liquid L-PRF glue production, respectively. As soon as the blood draw was completed, the tubes were centrifuged at 2700 rpm (400 g) during 12 min for L-PRF membranes or 3 min for liquid L-PRF glue. Liquid L-PRF glue was collected in a sterile syringe after centrifugation. For L-PRF membranes, the fibrin clot was removed from the tube, separated from the red blood cells with sterile spatulas and placed in an Xpression™ box for gentle compression. After 5 min, the final product was released from the box [14].
L-PRF membrane samples were either immediately processed for flow cytometry and scRNA-seq, incubated in culture medium and further analyzed as ‘cultured samples’ or snap frozen and stored at -80 °C as ‘fresh samples’ for further analysis (Fig. 1C, D).
Incubation
Fresh L-PRF membranes were cultured in a 6 well plate for one week, two weeks or three weeks in 4 mL general enriched culture medium (RPMI 1640, Gibco, 1875-034) with added 10% fetal bovine serum (FBS) (Gibco, 10270-106), 1% L-Glutamine and 2% penicillin streptomycin 10.000 U/mL (Gibco, 15140-122). Incubation conditions were at stable 37 °C with 5% CO2 and high humidity. After incubation, the medium was collected and centrifuged for 5 min at 1400 rpm. Supernatant was stored at -80 °C for enzyme-linked immunosorbent assay (ELISA) analysis. For quantitative reverse transcription polymerase chain reaction (RT-qPCR), L-PRF samples were snap frozen and stored at -80 °C as well. For flow cytometry and sRNA-seq, L-PRF membranes were immediately processed to single-cell suspensions and the cell pellet from the centrifuged medium was added to the sample.
Haemalum and eosin staining
L-PRF membranes were embedded in paraffin, and 5 μm paraffin sections were made using a microtome. The sections were deparaffinized and rehydrated before staining with haemalum and eosin. The samples were then dehydrated and mounted. Images were taken with an Axiovert 200 M inverted microscope (Zeiss, Jena, Germany).
Protein quantification
Fibrin degradation products and growth factor release from L-PRF cultures were assessed using ELISA. More specifically, D-dimers, vascular endothelial growth factor (VEGF), platelet-derived growth factor (PDGF), fibroblast growth factor (FGF), transforming growth factor- beta 2 (TGF-ß1), IGF (insulin-like growth factor) and epidermal growth factor (EGF) from L-PRF membranes in general enriched culture medium (RPMI) were measured after 1 and 2 weeks incubation at 37 °C with 5% CO2. The analyses were performed according to the manufacturer’s guidelines (Table S1). Absorbance was measured with the Multiskan FC and processed using SkanIt software (version 7.0.2, ThermoFisher Scientific).
mRNA expression: RT-qPCR
Total RNA was isolated from L-PRF membrane samples using the Qiagen Mini RNeasy Kit (Qiagen, Germantown, MD, 74106) after disruption and homogenization in lysing matrix D tubes (MP Biomedicals) with Buffer RLT (Qiagen, Hilden, Germany). RNA concentration and purity were measured by UV spectrophotometry on NanoDrop (ThermoFisher Scientific, Massachusetts, US). Per sample, 200 ng mRNA was used to reverse transcribe into cDNA with 500U MultiScribe Reverse Transcriptase (ThermoFisher) in the presence of 1U RNAse inhibitor in a thermal cycler (10 min at 25 °C, 120 min at 37 °C, 5 min at 85 °C). RT-qPCR was performed to measure mRNA of growth factors, more specifically EGF, VEGFA, PDGFA, FGF2, IGF1, and TGFB1. First, six reference genes commonly used as internal controls in expression studies, namely glyceraldehyde-3-phosphate dehydrogenase (GAPDH), β2-microglobulin (B2M), ribosomal protein L13a (RPL13A), hypoxanthine phosphoribosyl transferase (HPRT), receptor for activated C kinase 1 (RACK1) and β-actin (ACTB) were evaluated using the RefFinder tool [15]. RACK1 and RPL13A were the most stable reference genes according to the RefFinder analyses (data not shown) [15]. Results of the measured genes were normalized to the geometric mean of the reference genes RACK1 and RPL13A.
PrimeTime® Gene Expression Master Mix (Integrated DNA Technologies) was used in combination with specific forward and reverse primers in a final concentration of 300 nM and a hydrolysis probe in final concentration of 200 nM (sequences are listed in Table S2). cDNA plasmid standards were used to quantify the amount of target gene transcripts in unknown samples. Standards were performed in triplicate and samples in duplicate. Data were captured and analyzed using the CFX connect Real-Time PCR detection System (Bio-Rad, München, Germany).
Preparation of single cell suspension
Fresh L-PRF membranes were rinsed with Dulbecco’s phosphate-buffered saline (PBS) (Gibco, 14190-094), minced into small pieces with scissors (< 1 mm³) and cells were released by mechanical dissociation, by applying gentle pressure through a 70 μm cell strainer (Greiner Bio-one, 542070) while rinsing with PBS supplemented with 0.5% bovine serum albumin (BSA).
Red blood cell lysis was performed using an ammonium-chloride-potassium (ACK) lysing solution for 10 min, followed by two washing steps with fresh PBS with 0.5% BSA. For flow cytometry, the viable cell count was determined via a Bürker Hemocytometer using Trypan Blue exclusion (BioWhittaker®, Lonza).
For scRNA-seq, the cells were resuspended in ice-cold washing buffer after red blood cell lysis. Cell viability was determined by loading 10 µL of the single cell suspension on an immunofluorescence-mediated automated cell counter (Luna FL cell counter, Logos Biosystems). A viability of at least 70% was required to proceed to the sequencing. To reduce dissociation-related artefacts because of transcriptionally active and reacting cells at room temperature, cells were kept on ice whenever possible throughout the procedure.
Flow cytometry
Cell populations in L-PRF membranes and liquid L-PRF glue samples were characterized using flow cytometric analysis. Per sample, 500 000 cells were incubated with Fixable Viability Dye eFluor™ 780 (ThermoFisher Scientific, Waltham, MA USA) at room temperature and protected from light. After washing with PBS (Gibco, 14190-094) + 0.5% BSA (Sigma-Aldrich, 9048-46-8), the cells were incubated for 30 min at 4 °C with an antibody mix containing the following markers: pan leukocyte marker CD45-V500, leukocyte progenitor CD34-BV650, T cell markers CD3-APC, CD4-PerCP-Cy5.5, CD8-BV421, monocyte markers CD14-PE and CD16-PECy5, granulocyte marker CD15-PECy7, B cell marker CD19-FITC, natural killer (NK) cell marker CD56-BV711 (Table S3). Antibodies were purchased from BD Biosciences (CD8-BV421, CD14-PE, CD16-PECy5, CD19-FITC, CD34-BV650, CD45-V500), Biolegend (CD15-PECy7, CD56-BV711) and ThermoFisher Scientific (CD4-PerCPCy5.5). After incubation, cells were washed and incubated in 1% PBS-buffered formaldehyde (PFA) (Merck, 30525-89-4) for 15 min at room temperature and afterwards washed again.
Data were acquired with an LSRFortessa SORP flow cytometer (configuration settings summarized in Table S4) running FACSDiva™ software version 8 (BD Biosciences, Erembodegem, Belgium). Data were analyzed with FlowJo™ 10.8.0 software (BD). Fluorescence minus one controls were included.
Single cell RNA sequencing
The processing of the single cell suspensions was performed by the KU Leuven Genomics Core. Single cell suspensions were loaded on a 10x Chromium microfluidics system according to the manufacturer’s guidelines (10x Genomics).
Library preparation
The 10X Genomics Chromium Single Cell 5’ kit v2 and 10X Genomics chromium controller (10X Genomics) were used to generate scRNA-seq 5’ gene expression libraries, according to the protocol guidelines (10x Single cell 5’ v2). Cells were loaded on single-cell Gel beads in EMulsion with primers containing barcodes including Illumina R2 sequence adapter, bead-unique 10X barcode, primer-unique ‘Unique molecular Identifier’ (UMI) and a poly dT primer sequence. After cell lysis, reverse transcription was performed in order to converse primed mRNA to complementary cDNA, full length and uniquely 10x barcoded. This barcoded cDNA was amplified using PCR, followed by enzymatic fragmentation, end repair, poly A-tailing, adaptor ligation and sample index PCR to construct sequencing libraries. Finally, the libraries were sequenced.
The 5’ mRNA library was sequenced with Illumina NovaSeq 500 (Illumina, San Diego, USA) aiming to produce at least 25 000 reads per cell. FastQC software [16] was used for checking the quality of the libraries.
Data acquisition and pre-processing
The raw sequencing reads were demultiplexed and aligned to the GRCh38 human reference genome using 10x Genomics Cell Ranger software and processed to a matrix representing the UMI’s per cell barcode per gene. Low-quality cells were excluded using the following criteria: If the number of expressed genes was below 300, the cells were discarded from further analysis due to low quality. Cells with more than 10% mapping to genes expressed from the mitochondrial genome, and red blood cell contaminated populations with more than 100 reads of hemoglobin genes (HBA, HBB1 or HBB2) were discarded as well. Cells with more than 1150 expressed genes were filtered out of the further analysis (Figure S1). In order to remove batch effects, a corrected expression matrix was created using the R package Harmony.
Downstream analysis of the single cell expression matrix was performed with RStudio-based pipeline Seurat (available at Satijalab). Analysis comprised data normalization (using LogNormalize function), differential expression analysis (FindVariableFeatures, FindMarkers) and visualization.
Genes with a normalized expression between 0.125 and 3, and a quartile-normalized variance of > 0.5 were selected as variable genes. Using these variably expressing genes, principal components were constructed. Principal components covering the highest variance in the dataset were selected based on elbow graphs and jackstraw plots. Clusters were calculated using the FindClusters function. Louvain clustering and dimensionality reduction using Uniform Manifold Approximation and Projection (UMAP) algorithm. t-distributed stochastic neighbor embedding (t-SNE) were generated at different resolutions in order to gain additional insight regarding cell composition. For each cluster, marker genes were identified using the FindAllMarkers function and Wilcoxon rank sum test.
Statistical analysis
Statistical analysis was performed using GraphPad Prism v.9 for Windows (La Jolla, CA, USA). Normality was determined using a Shapiro-Wilk test. Comparisons between conditions were tested using paired or unpaired t-test of Mann-Whitney U test. Data is represented as mean and standard deviation (normally distributed) or median and interquartile range (not normally distributed). Bonferroni correction was applied to account for multiple testing. A difference was considered statistically significant when p ˂0.05.
Results
Sample characteristics
Samples were collected from 18 healthy volunteers (venous L-PRF samples) and 38 neurosurgical patients (arterial L-PRF samples). Samples were analyzed fresh, after one and after two weeks (Fig. 1).
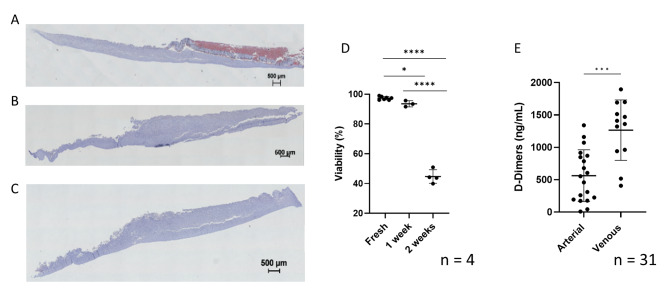
Histologic haemalum and eosin staining showed widespread white blood cells (WBCs) in a fresh L-PRF membrane, whereas WBCs were not abundant in 1- and 2-weeks cultured samples. In addition, histological artefacts indicated a less firm consistency of the fibrin network in the cultured samples (both one and two weeks) (Fig. 2A, B, C).
Fig. 2.
Viability and fibrin integrity of L-PRF membranes (A-B-C) Histologic haemalum and eosin staining of (A) fresh venous L-PRF membrane, (B) 1 week cultured venous L-PRF membrane and (C) 2 weeks cultured venous L-PRF membrane. (D) Cell viability in fresh, 1 week cultured and 2 weeks cultured venous L-PRF membrane samples. (E) D-dimers indicating fibrin degradation in arterial vs. venous blood after 1 week culture
Cell viability was measured in fresh L-PRF membranes (97.14 ± 1.09%), in one week cultured (93.57 ± 1.68%) and in two weeks cultured (44.70 ± 3.95%) samples (Fig. 2D). Fibrin integrity was determined in L-PRF membranes prepared from venous and arterial blood after one week of incubation, by measuring D-dimers in the culture medium. The concentration of D-dimers was lower in medium from arterial L-PRF membranes than in venous L-PRF membrane medium (562.7 ± 399.9 ng/mL versus 1266 ± 467.0 ng/mL), suggesting a more stable fibrin network in L-PRF membranes derived from arterial blood (Fig. 2E).
Flow cytometry
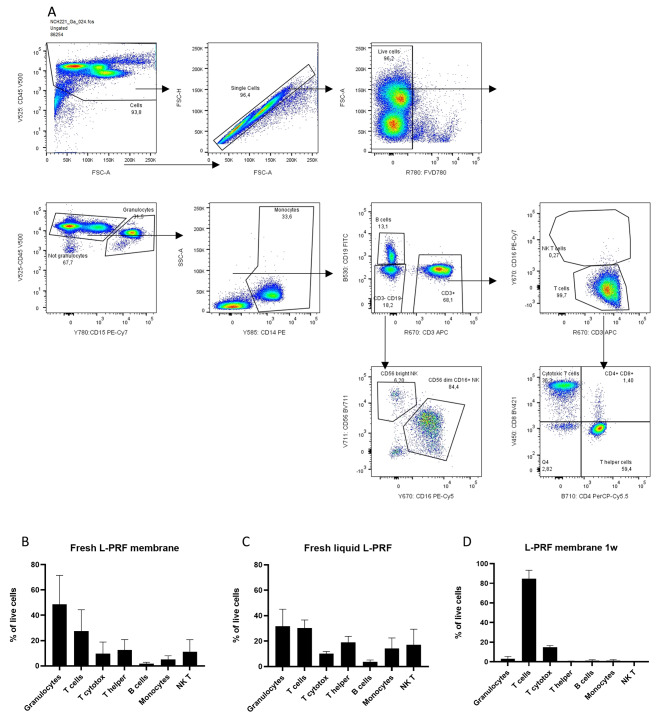
The cellular composition of venous L-PRF membranes, liquid L-PRF glue and a combination of both was determined using flow cytometry. The gating strategy is shown in Fig. 3A. In fresh L-PRF membranes (n = 6), CD15+ granulocytes were predominant (53.9 ± 19.86%) followed by CD3+ T cells (22.07 ± 10.1%). Fresh liquid L-PRF glue (n = 4) contained less cells in total compared with fresh L-PRF membranes, but with similar distribution between cell types. However, there was a significant difference in CD15+ granulocytes between fresh L-PRF membranes and fresh liquid L-PRF glue (48.66 ± 22.93 vs. 31.65 ± 13.45%, p = 0.03) (Fig. 3B, C). After one week of incubation, predominantly T cells were observed (84.7 ± 6.1%, Fig. 3D), and CD4+ or CD8+ subsets were not identified anymore, likely due to internalization or cleavage of membrane antigens.
Fig. 3.
Flow cytometric analysis of cells in a single-cell suspension extracted from L-PRF samples. (A) Gating strategy of a representative sample. (B) Main cell types present in fresh L-PRF membranes (n = 4). (C) Main cell types present in fresh liquid L-PRF glue (n = 4). (D) Main cell types present in a 1-week incubated L-PRF membrane (n = 4). Error bars represent the standard deviation
scRNA-seq
In a next step, we prepared twelve venous L-PRF membranes from six healthy volunteers for scRNA-seq, of which six fresh L-PRF membranes and six L-PRF membranes cultured for one week. Viability results showed that only five samples were of sufficient quality (viability > 70%) to proceed with the sequencing reaction, of which four fresh samples and one cultured sample (data not shown). The cultured sample (lprf12) was derived from the same donor as one of the fresh samples (lprf15).
A total of 40 704 cells were sequenced, of which 31 988 were from fresh samples and 8716 from the cultured sample. After quality control, 29 670 cells were left for further analysis, of which 21 692 derived from the four fresh samples and 7978 from the cultured sample. According to the elbow point, the optimal principal component number was determined as 11 for fresh L-PRF samples, 10 for the cultured sample, 12 for the combination of a fresh and a cultured sample (from the same donor) and 11 for all samples together. Clustering was done at a resolution of 0.4.
scRNA-seq analysis of L-PRF membranes depicts a diverse landscape of cells in the specimens. In each sample type (fresh, cultured, all, combination of one fresh and one cultured sample), cell clusters were identified based on the expression of specific marker genes.
Fresh L-PRF membranes
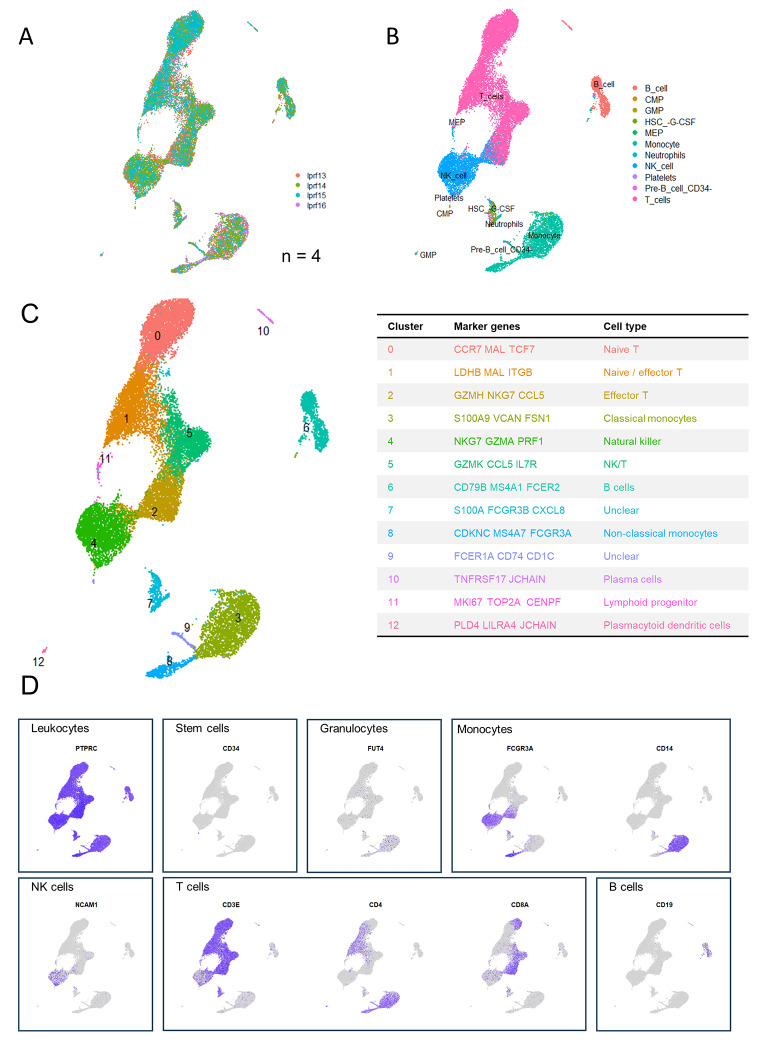
Original identity UMAP plots showed similar distribution of cells from the four donors (Fig. 4A). Supervised annotation by SingleR identified cell types (Fig. 4B), corresponding to the distribution of cell types that was identified using flow cytometry, with the exception of granulocytes. As such, the main clusters contained monocytes, T cells, B cells and NK/T cells, with the largest cluster containing T cells and two other important clusters representing B cells and myeloid cells. Subsets were further identified by scRNA-sequencing using canonical marker expression data (Fig. 4C). Monocytes were subclassified as classical (cluster 3) and non-classical (cluster 8), monocytes and a further unidentified myeloid cluster (cluster 9); T cells as naïve (cluster 0), effector (cluster 2) and intermediate naïve-effector T cells (cluster 1). Cluster 4 was characterized as NK cells. Additionally, some smaller cell clusters were found. Of these, some clusters were not recognized by SingleR, but could be identified by expression of canonical markers. As such, cluster 10 was identified as plasma cell by expression of JCHAIN and TNFRSR17 and cluster 11 as lymphoid progenitor cells (CENPF, TOP2A and MKI67). Further, a small and distant cluster (cluster 12) contained cells identified as plasmacytoid dendritic cells expressing PLD4, LILRA4 and JCHAIN. Cluster 7 contains neutrophils, megakaryotic-erythroid progenitors (MEP) and hematopoietic stem cells (HSC). Important canonical markers for visualization of main cell types are depicted in Fig. 4D.
Fig. 4.
Identification of cell types in fresh L-PRF membranes (n = 4). (A) Cells are color coded by original sample identity. (B) Cell identification based on a supervised annotation algorithm (SingleR): cells are color coded by predicted cell type. (C) Clusters identified by an unsupervised graph-based algorithm: color coded by cluster (left), with cluster identification based on highly differentially expressed genes (right). (D) Feature plots indicating main leukocyte types. Pan leukocyte marker PTPRC (CD45); stem cell marker CD34; granulocyte marker FUT4 (CD15); monocyte markers FCGR3A and CD14; NK cell marker NCAM; T cell markers CD3E, CD4 and CD8A; B cell marker CD19
Cultured L-PRF membrane
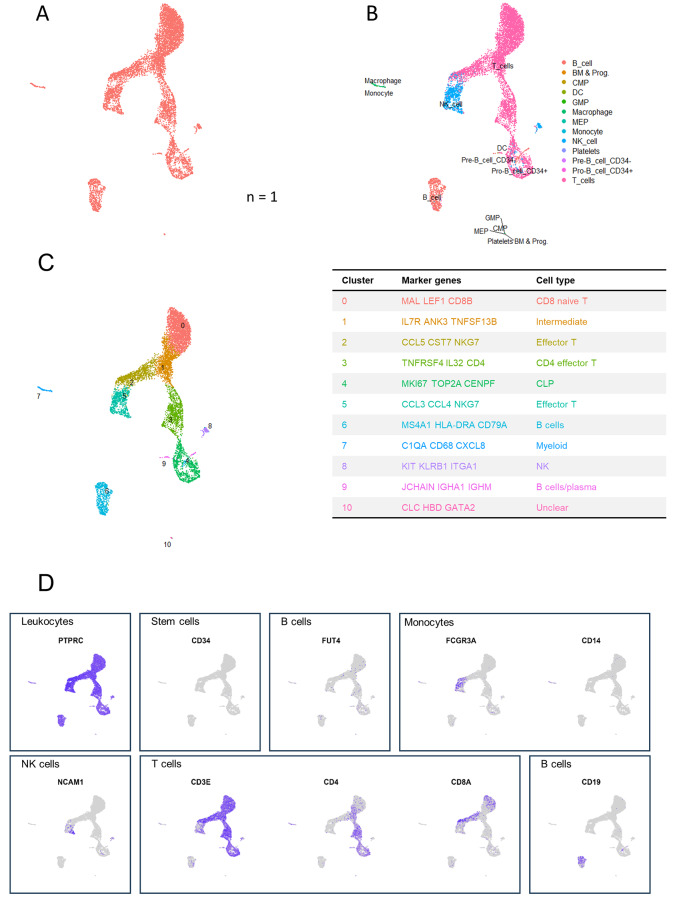
In the cultured L-PRF membrane, similar clusters were found with respect to B cells and T cells as in the fresh samples (Fig. 5A-D). However, after culture L-PRF samples lose their monocyte content. The myeloid cluster (cluster 7) mainly showed the appearance of macrophages expressing CD68, CXCL8 and C1QA. T cells still configured the main cluster, subclassified in CD8+ naïve T cells (cluster 0), effector T cells (cluster 2) and CD4+ effector T cells (cluster 3). Cluster 4 was predicted as T cells with pre-B cells and CD34+ pro-B cells but the CD34 marker was not differentially expressed in these cells. Based on canonical markers and activation markers, cluster 4 preferably corresponds to common lymphoid progenitor cells (CLP). Cluster 6 contained B cells and cluster 9 could be identified as plasma cells. Cluster 5 was characterized by effector T/NK cells. Additionally, another cluster (cluster 8) corresponded to NK cells. Cluster 10, most differentially expressing CLC, HBD and GATA2 remained unclear.
Fig. 5.
Identification of cell types in cultured L-PRF membranes (n = 4). (A) Cells are color coded by original sample identity. (B) Cell identification based on a supervised annotation algorithm (SingleR); cells are color coded by predicted cell type. (C) Clusters identified by an unsupervised graph-based algorithm, color coded by cluster (left), with cluster identification based on highly differentially expressed genes (right). (D) Feature plots indicating main leukocyte types. Pan leukocyte marker PTPRC (CD45); stem cell marker CD34; granulocyte marker FUT4 (CD15); monocyte markers FCGR3A and CD14; NK cell marker NCAM; T cell markers CD3E, CD4 and CD8A; B cell marker CD19
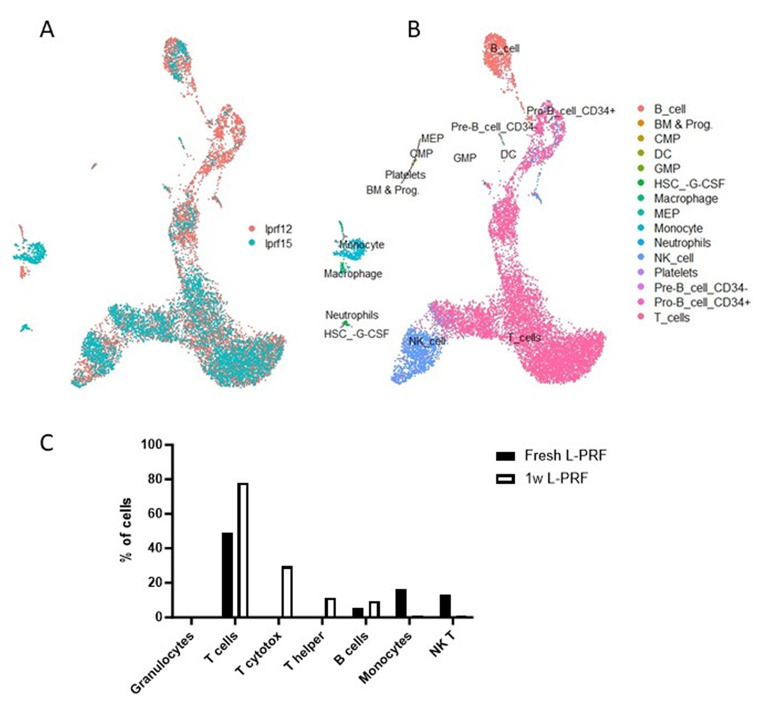
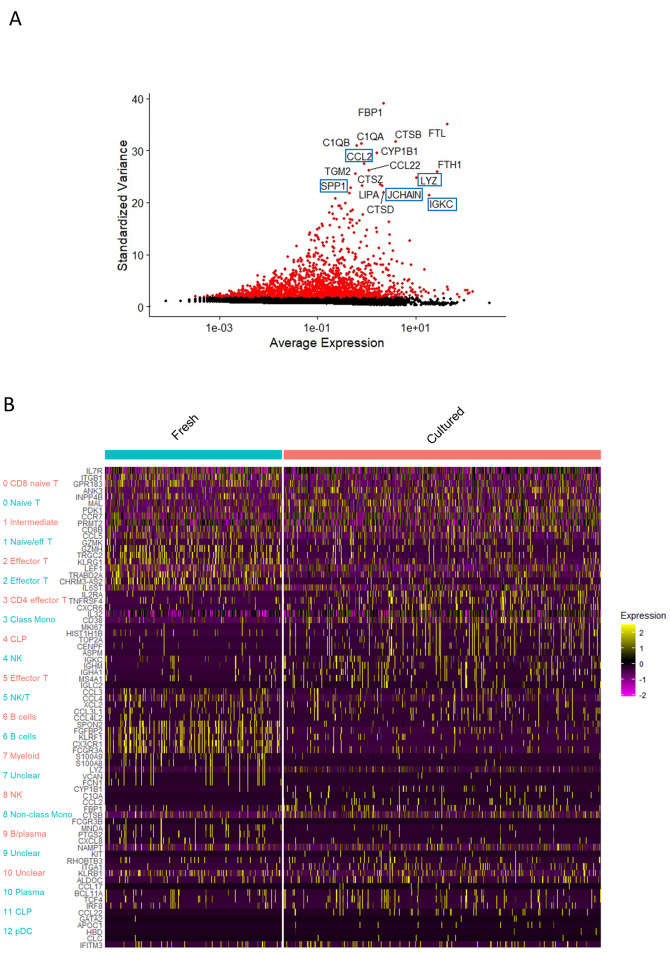
To assess the differences between fresh and cultured samples, we projected the merged data onto the UMAP embeddings of cells from both types of samples from the same donor (cultured sample lprf12 and fresh sample lprf15) (Fig. 6A). Comparison of a fresh L-PRF membrane with a 1-week cultured membrane from the same donor revealed similar profiles of T cells and B cells, but differences in the myeloid cell cluster (Fig. 6B, C). Fresh L-PRF membranes contained monocytes and few neutrophils, whereas cultured membranes contained an additional cluster identified as macrophages. Indeed, when investigating highly differentially expressed genes between the two samples, macrophage markers such as LYZ, JCHAIN, IGKG, CCL2 and SPP1 came forward (Fig. 7A, B).
Fig. 6.
Comparison of cell types in a fresh and a one-week cultured L-PRF membranes by scRNA-seq analysis. (A) Cells are color coded by original sample identity; fresh (lprf15, blue), and one week cultured (lprf12, pink). (B) Cell identification based on a supervised annotation algorithm (SingleR); cells are color coded by predicted cell type. (C) Main cell types present in fresh and 1-week incubated L-PRF, quantified using scRNA-seq
Fig. 7.
Differential expression between fresh and cultured L-PRF membranes. (A) Volcano plot indicating pairwise differential expression between fresh L-PRF (lprf15) and cultured L-PRF (lprf12). Indicated genes are specific markers for macrophages (B) Heatmap depicting top 5 marker genes for each of the clusters of both fresh (blue) and cultured L-PRF (pink)
RT-qPCR
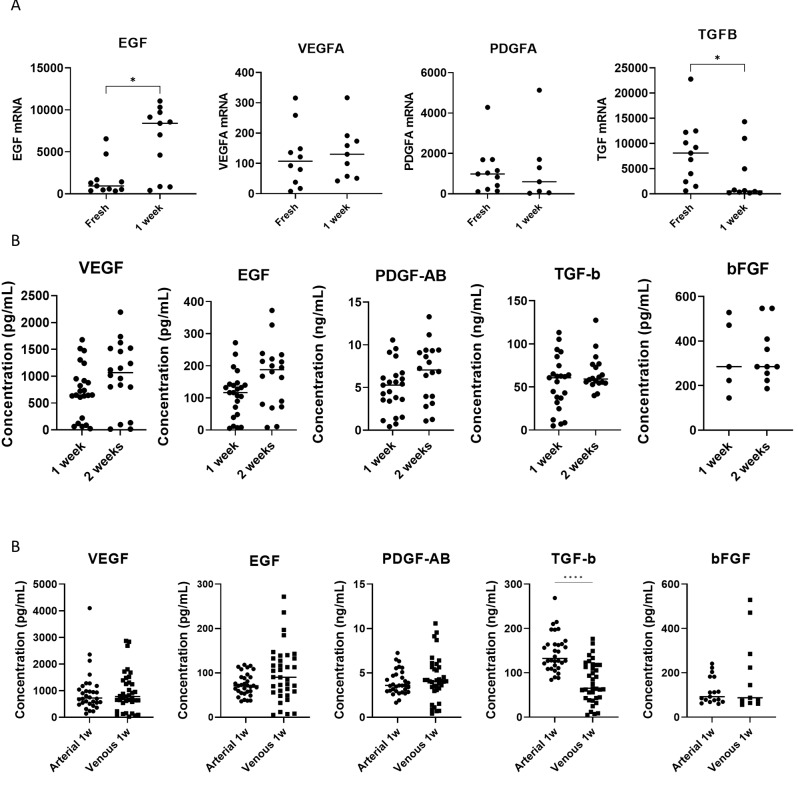
To assess the possible effect of L-PRF and the incorporated immune cells on a wound environment, including wound healing and tissue regeneration, growth factor expression was studied. VEGFA and PDGFA mRNA levels remained unchanged before and after culture (Fig. 8A, Table S5). EGF mRNA was significantly elevated in L-PRF membranes after 1 week culture (Table S5). While fresh L-PRF membranes had high transcription activity of TGFB1, transcription halted after one week of culture. FGF2andIGF1 mRNA were below the detection limit in the majority of samples (data not shown).
Fig. 8.
Growth factor expression and release from L-PRF membranes. (A) RNA quantification (RT qPCR) of growth factor mRNA (VEGFA, EGF, PDGFA, TGFB1) in fresh arterial L-PRF membranes and in arterial L-PRF membranes after 1 week culture. FGF2 was not detected. Each dot represents one sample, horizontal bar indicates mean. (B) Protein quantification of growth factors (VEGF, EGF, PDGF-AB, TGF-β1, bFGF) in venous L-PRF membranes after 1- and 2-week culture using ELISA. (C) Protein quantification of growth factors (VEGF, EGF, PDGF-AB, TGF-β1, bFGF) in arterial versus venous L-PRF membranes after 1 week culture. * indicates p ˂ 0.05, **** indicates p ˂ 0.0001
Growth factor release analysis
ELISA analysis of growth factors released in L-PRF conditioned medium showed sustained release of VEGF, EGF, PDGF-AB, TGF-β1 and bFGF after two weeks (Fig. 8B, Table S6). Mainly TGF-β1 was released and remained stable after 1 week compared to 2 weeks. Comparison between L-PRF membranes derived from arterial and venous blood resulted in significantly elevated release of TGF-β1 in arterial L-PRF after 1 week culture (Fig. 8C). Other growth factors did not statistically differ, however, EGF and bFGF release was highly variable in venous samples. IGF-I was not detected.
Discussion
The application of L-PRF, often referred to as naturally guided regeneration, has garnered substantial attention across various medical disciplines [17]. Naturally guided regeneration harnesses the innate regenerative capabilities of the body. Dentistry and dermatology have seen successful applications of this approach, with studies demonstrating improved wound healing, bone regeneration, and tissue repair using L-PRF [18–23]. For instance, in oral surgery, L-PRF has shown promising results in procedures such as socket preservation, implantology, and sinus lift augmentations, where it promotes accelerated healing, reduces post-operative complications, and enhances bone formation. Similarly, in periodontology, L-PRF has been utilized to support periodontal regeneration techniques like guided tissue regeneration and gingival recession treatments, demonstrating its ability to improve clinical parameters such as attachment gain and reduction in probing depths [24]. Nevertheless, detailed knowledge about the composition and underlying mechanisms of action of L-PRF remains elusive.
In this study, we investigated the cellular content and growth factor kinetics of L-PRF. Our methodology involved scRNA-seq of cells extracted from both fresh and one-week cultured L-PRF samples. Additionally, further characterization was done by histologic staining, cell type identification based on extracellular markers by flow cytometry, and quantification of growth factor transcription and release.
Our findings revealed that after one week of culture, L-PRF membranes exhibited a remarkably high number of viable cells, predominantly populated by T cells. Interestingly, macrophages were not present in fresh membranes but were observed in cultured membranes, suggesting differentiation from monocytes into macrophages during culture. This delayed appearance of macrophages derived from L-PRF in a wound environment could be beneficial because these cells play a pivotal role in the secretion of growth factors during later stages of healing, including TGF-β1, PDGF and VEGF [25]. These findings offer a plausible explanation for prior reports indicating that L-PRF promotes angiogenesis and stimulates tissue reconstruction [10, 26]. However, mRNA quantification of growth factors unveiled a decrease of TGF-β1 after a one-week culture, likely attributable to a significant proportion of TGF-β1 being released from platelets in an early phase. Although bFGF was not released in many of the samples, previous studies have shown that L-PRF has a beneficial long-term effect on fibroblasts [27, 28]. An in-depth investigation of the secretome of L-PRF identified similar results for growth factors, with peak releases after 3 days [12].
A remarkable finding from flow cytometry analysis was the absence of CD4+ and CD8+ T cell populations in cultured L-PRF, though these cell types were still identified in one-week cultured L-PRF samples through scRNA-seq. This discrepancy may be attributed to the internalization or cleavage of CD4 and CD8 cell surface markers during culture, rendering them inaccessible to flow cytometry antibodies. Further investigations, for example including heparinized whole blood samples as a control, could address this issue further. This way, it could become possible to elucidate the reason of the disappearance of CD4 and CD8 markers on T cells during the L-PRF preparation process or during incubation. By using a heparinized whole blood control, we can ensure that the cells remain in their native state without clotting, thereby providing a more precise reference point for evaluating the changes and enrichment of cell populations in the L-PRF matrix compared to the initial composition of the blood from which the L-PRF is derived.
Despite granulocytes representing a considerable proportion of circulating leukocytes, their presence was not prominently demonstrated in scRNA-seq analysis of L-PRF. Granulocytes, particularly neutrophils, have a short lifespan in blood circulation (ca. 6 h) and once isolated from the blood. While these cells may endure the centrifugation process, they may not withstand the subsequent preparation steps for scRNA-seq analysis. This hypothesis aligns with the results of flow cytometric CD15 staining, which indicated a substantial granulocyte population in fresh L-PRF.
Histologic staining revealed that leukocytes were primarily concentrated at the face of the L-PRF membrane, i.e., the lower portion, which was in contact with the red blood cell layer. New techniques, such as advanced PRF (A-PRF) and A-PRF+, have claimed to achieve a better leukocyte distribution throughout the membrane by employing a lower centrifugation speed, potentially resulting in higher and longer growth factor release [29].
Apart from the presence of viable and active cells, a strong scaffold is essential to provide the requisite healing capacity [30]. We found that L-PRF membranes derived from arterial blood exhibited reduced release of fibrin degradation products during a one-week culture compared to venous L-PRF membranes. This indicates a higher fibrin integrity in arterial L-PRF membranes. Additionally, arterial blood has a lower hematocrit, which allows greater space for fibrin clot formation [31]. Regarding growth factors, arterial samples provided a more coherent release, with significantly higher release of TGF-β1 after one week of culture compared to venous L-PRF membranes. It is important to note that perioperatively administered medications, for example anesthetics, corticosteroids, or low-dose antithrombotics can alter the formation and consistency of L-PRF.
A limitation of the study is the limited mimicry of the surgical wound environment. L-PRF membranes were incubated in standard medium supplemented with serum, but there was no further stimulation of cells akin to a real wound bed. In particular, adding FBS mirrors the nutrient-rich environment of a wound bed, where tissues interact with exogenous sources of nutrients and growth factors. Although using FBS introduces a non-human element, it ensures consistent and controlled culture conditions, which is essential for reliable experimental results. Our preliminary experiments without FBS showed insufficient cell viability (data not shown), reinforcing the necessity of FBS for maintaining cell health. While this introduces a variable to consider, the benefits of simulating a more physiologically relevant context outweigh this limitation. Controls confirmed that the growth factors measured originated from L-PRF rather than from the FBS. Therefore, although FBS may influence data interpretation, it provides a more accurate in vitro model of the wound environment.
Moreover, it is important to acknowledge that L-PRF exhibits variability in its composition, which may impact therapeutic efficacy. Key factors contributing to this variability encompass macroscopic and mechanical properties such as size, firmness, color, and opacity, as well as microscopic properties including platelet count, fibrin concentration, and leukocyte content. While this variability has been previously investigated [7, 32, 33], additional research is warranted to further enhance therapeutic effectiveness and assess potential risks.
Conclusion
This in-depth analysis provides invaluable insights into the cellular content and interactions of L-PRF. This contributes to the better understanding of mechanisms underlying wound healing, tissue regeneration, and antimicrobial activity in relation to L-PRF. To gain a more concise understanding of its clinical effects, further investigations will need to focus on mechanisms supporting wound healing, after L-PRF is applied in vivo.
Electronic supplementary material
Below is the link to the electronic supplementary material.
Abbreviations
- L-PRF
Leukocyte- and platelet-rich fibrin
- EGF
Epidermal growth factor
- TGFB1
Transforming growth factor beta 1
- FBS
Fetal bovine serum
- ELISA
Enzyme-linked immunosorbent assay
- RT-qPCR
Quantitative reverse transcription polymerase chain reaction
- VEGF
Vascular endothelial growth factor
- PDGF
Platelet-derived growth factor
- FGF
Fibroblast growth factor
- IGF
Insulin-like growth factor
- GAPDH
Glyceraldehyde-3-phosphate dehydrogenase
- B2M
β2-microglobulin
- RPL13A
Ribosomal protein L13a
- HPRT
Hypoxanthine phosphoribosyl transferase
- RACK1
Receptor for activated C kinase 1
- ACTB
β-actin
- PBS
Phosphate-buffered saline
- BSA
Bovine serum albumin
- ACK
Ammonium-chloride-potassium
- PFA
PBS-buffered formaldehyde
- UMAP
Uniform Manifold Approximation and Projection
- UMI
Unique molecular Identifier
- WBCs
White blood cells
- A-PRF
Advanced PRF
Author contributions
BC wrote the main manuscript text. The study was conceptualized by LVG and TT. Experiments were carried out by BC with assistance ED and JC. All authors critically reviewed the manuscript.
Funding
This projected was supported by the research Foundation Flanders (FWO) within the frame of a TBM project for applied biomedical research with a primary social finality (grant number T003018N – L-PRF in cranial surgery). Laura Van Gerven reports financial support was provided by Research Foundation Flanders.
Data availability
Data is provided within the manuscript or supplementary information files. Additional data can be obtained from the authors upon reasonable request.
Declarations
Competing interests
The authors declare no competing interests.
Footnotes
Publisher’s note
Springer Nature remains neutral with regard to jurisdictional claims in published maps and institutional affiliations.
References
- 1.Calciolari E, Dourou M, Akcali A, Donos N (2024) Differences between first- and second-generation autologous platelet concentrates. Periodontol 2000 [DOI] [PubMed]
- 2.Dohan DM, Choukroun J, Diss A et al (2006) Platelet-rich fibrin (PRF): a second-generation platelet concentrate. Part I: Technological concepts and evolution. Oral surgery, oral medicine, oral Pathology. Oral Radiol Endodontology 101. 10.1016/j.tripleo.2005.07.008 [DOI] [PubMed]
- 3.Dohan DM, Choukroun J, Diss A et al (2006) Platelet-rich fibrin (PRF): a second-generation platelet concentrate. Part II: platelet-related biologic features. Oral surgery, oral medicine, oral Pathology. Oral Radiol Endodontology 101. 10.1016/j.tripleo.2005.07.009 [DOI] [PubMed]
- 4.Dohan DM, Choukroun J, Diss A et al (2006) Platelet-rich fibrin (PRF): a second-generation platelet concentrate. Part III: leucocyte activation: a new feature for platelet concentrates? Oral surgery, oral medicine, oral Pathology. Oral Radiol Endodontology 101. 10.1016/j.tripleo.2005.07.010 [DOI] [PubMed]
- 5.Choukroun J, Diss A, Simonpieri A et al (2006) Platelet-rich fibrin (PRF): a second-generation platelet concentrate. Part IV: clinical effects on tissue healing. Oral surgery, oral medicine, oral Pathology. Oral Radiol Endodontology 101. 10.1016/j.tripleo.2005.07.011 [DOI] [PubMed]
- 6.Miron RJ, Fujioka-Kobayashi M, Sculean A, Zhang Y (2023) Optimization of platelet-rich fibrin. Periodontol 2000 [DOI] [PubMed]
- 7.Castro AB, Andrade C, Li X et al (2021) Impact of g force and timing on the characteristics of platelet-rich fibrin matrices. Sci Rep 11:1–13. 10.1038/s41598-021-85736-y 10.1038/s41598-021-85736-y [DOI] [PMC free article] [PubMed] [Google Scholar]
- 8.Pavlovic V, Ciric M, Jovanovic V et al (2021) Platelet-rich fibrin: basics of biological actions and protocol modifications. Open Med (Poland) 16:446–454. 10.1515/med-2021-0259 10.1515/med-2021-0259 [DOI] [PMC free article] [PubMed] [Google Scholar]
- 9.Castro AB, Herrero ER, Slomka V et al (2019) Antimicrobial capacity of leucocyte-and platelet Rich Fibrin against periodontal pathogens. Sci Rep 9. 10.1038/s41598-019-44755-6 [DOI] [PMC free article] [PubMed]
- 10.Miron RJ, Fujioka-Kobayashi M, Bishara M et al (2017) Platelet-Rich Fibrin and Soft tissue Wound Healing: a systematic review. Tissue Eng Part B Rev 23:83–99. 10.1089/ten.teb.2016.0233 10.1089/ten.teb.2016.0233 [DOI] [PubMed] [Google Scholar]
- 11.Miron RJ, Pikos MA, Estrin NE et al (2023) Extended platelet-rich fibrin. Periodontol 2000 [DOI] [PubMed]
- 12.Hermida-Nogueira L, Barrachina MN, Morán LA et al (2020) Deciphering the secretome of leukocyte-platelet rich fibrin: towards a better understanding of its wound healing properties. Sci Rep 10:14571. 10.1038/s41598-020-71419-7 10.1038/s41598-020-71419-7 [DOI] [PMC free article] [PubMed] [Google Scholar]
- 13.Coucke B, De Vleeschouwer S, van Loon J et al (2024) Leukocyte- and platelet-rich fibrin in cranial surgery: a single-blinded, prospective, randomized controlled noninferiority trial. J Neurosurg 1–9. 10.3171/2023.12.jns232125 [DOI] [PubMed]
- 14.Quirynen M, Blanco J, Wang HL et al (2024) Instructions for the use of L-PRF in different clinical indications. Periodontol 2000 [DOI] [PubMed]
- 15.Xie F, Wang J, Zhang B (2023) RefFinder: a web-based tool for comprehensively analyzing and identifying reference genes. Funct Integr Genomics 23:125. 10.1007/s10142-023-01055-7 10.1007/s10142-023-01055-7 [DOI] [PubMed] [Google Scholar]
- 16.Andrews S (2010) FastQC: A Quality Control Tool for High Throughput Sequence Data. http://www.bioinformatics.babraham.ac.uk/projects/fastqc/
- 17.Constanzo F, Pinto J, Ledermann C, Schmidt T (2023) Leukocyte-Rich and platelet-rich fibrin for Skull Base Reconstruction after Endoscopic Endonasal Skull Base surgery. Neurosurgery 92:787–794. 10.1227/neu.0000000000002270 10.1227/neu.0000000000002270 [DOI] [PubMed] [Google Scholar]
- 18.Naik B, Karunakar P, Jayadev M, Marshal VR (2013) Role of platelet rich fibrin in wound healing: a critical review. J Conserv Dent 16:284 10.4103/0972-0707.114344 [DOI] [PMC free article] [PubMed] [Google Scholar]
- 19.Temmerman A, Cleeren GJ, Castro AB et al (2018) L-PRF for increasing the width of keratinized mucosa around implants: a split-mouth, randomized, controlled pilot clinical trial. J Periodontal Res 53:793–800. 10.1111/jre.12568 10.1111/jre.12568 [DOI] [PubMed] [Google Scholar]
- 20.Bajaj P, Pradeep AR, Agarwal E et al (2013) Comparative evaluation of autologous platelet-rich fibrin and platelet‐rich plasma in the treatment of mandibular degree II furcation defects: a randomized controlled clinical trial. J Periodontal Res 48:573–581 10.1111/jre.12040 [DOI] [PubMed] [Google Scholar]
- 21.Kartika RW, Alwi I, Suyatna FD et al (2021) Wound Healing in Diabetic Foot Ulcer patients using combined use of platelet Rich Fibrin and Hyaluronic Acid, platelet Rich Fibrin and Placebo: an open label, Randomized Controlled Trial. Acta Med Indones 53:268–275 [PubMed] [Google Scholar]
- 22.Zumstein MA, Rumian A, Lesbats V et al (2014) Increased vascularization during early healing after biologic augmentation in repair of chronic rotator cuff tears using autologous leukocyte- and platelet-rich fibrin (L-PRF): a prospective randomized controlled pilot trial. J Shoulder Elb Surg 23:3–12. 10.1016/j.jse.2013.08.017 10.1016/j.jse.2013.08.017 [DOI] [PubMed] [Google Scholar]
- 23.Lektemur Alpan A, Torumtay Cin G (2020) PRF improves wound healing and postoperative discomfort after harvesting subepithelial connective tissue graft from palate: a randomized controlled trial. Clin Oral Investig 24:425–436. 10.1007/s00784-019-02934-9 10.1007/s00784-019-02934-9 [DOI] [PubMed] [Google Scholar]
- 24.Gerardi D, Santostasi N, Torge D et al (2023) Regenerative potential of platelet—rich fibrin in maxillary sinus floor lift techniques: a systematic review. J Biol Regul Homeost Agents 37:2357–2369 [Google Scholar]
- 25.Crisci A, Minniti CA, Conte A et al (2020) Second Generation Platelet Concentrates - L-PRF (Fibrin Rich in Platelets and Leukocytes) and Its Derivatives (A-PRF, i-PRF)-: Morphological Characteristics to be Used in Modern Regenerative Surgery. Experimental Research
- 26.Ratajczak J, Vangansewinkel T, Gervois P et al (2018) Angiogenic properties of ‘Leukocyte- and Platelet-Rich Fibrin. 10.1038/s41598-018-32936-8. ’ Sci Rep 8: [DOI] [PMC free article] [PubMed]
- 27.Pitzurra L, Jansen IDC, de Vries TJ et al (2020) Effects of L-PRF and A-PRF + on periodontal fibroblasts in in vitro wound healing experiments. J Periodontal Res 55:287–295. 10.1111/jre.12714 10.1111/jre.12714 [DOI] [PMC free article] [PubMed] [Google Scholar]
- 28.Mudalal M, Wang Z, Mustafa S et al (2021) Effect of leukocyte-platelet Rich Fibrin (L-PRF) on tissue regeneration and proliferation of human gingival fibroblast cells cultured using a modified method. Tissue Eng Regen Med 18:895–904. 10.1007/S13770-021-00360-1 10.1007/S13770-021-00360-1 [DOI] [PMC free article] [PubMed] [Google Scholar]
- 29.Coucke B, Ockerman A, Politis C, Jacobs R (2019) Bloed- en speekselanalyse voor de beoordeling van diagnostische en therapeutische interventies in orale en maxillofaciale heelkunde. KU Leuven, Faculteit Geneeskunde [Google Scholar]
- 30.Chaudhari AA, Vig K, Baganizi DR et al (2016) Future prospects for scaffolding methods and biomaterials in skin tissue engineering: a review. Int J Mol Sci 17 [DOI] [PMC free article] [PubMed]
- 31.Yang ZW, Yang SH, Chen L et al (2001) Comparison of blood counts in venous, fingertip and arterial blood and their measurement variation. Clin Lab Haematol 23:155–159. 10.1046/j.1365-2257.2001.00388.x 10.1046/j.1365-2257.2001.00388.x [DOI] [PubMed] [Google Scholar]
- 32.Ockerman A, Braem A, EzEldeen M et al (2020) Mechanical and structural properties of leukocyte- and platelet-rich fibrin membranes: an in vitro study on the impact of anticoagulant therapy. J Periodontal Res. 10.1111/jre.12755 10.1111/jre.12755 [DOI] [PubMed] [Google Scholar]
- 33.Castro A, Cortellini S, Temmerman A et al (2019) Characterization of the leukocyte- and platelet-Rich Fibrin Block: release of growth factors, Cellular Content, and structure. Int J Oral Maxillofac Implants 34:855–864. 10.11607/jomi.7275 10.11607/jomi.7275 [DOI] [PubMed] [Google Scholar]
Associated Data
This section collects any data citations, data availability statements, or supplementary materials included in this article.
Supplementary Materials
Data Availability Statement
Data is provided within the manuscript or supplementary information files. Additional data can be obtained from the authors upon reasonable request.


