Abstract
Herbs have been used as medicines since antiquity, and it has been discovered that the human body responds well to herbal remedies. Research on the effect of butin was conducted in the current study in the alloxan-induced diabetic rat paradigm. A total of 30 Wistar rats were randomly assigned into the following groups (n = 6): I-Normal; II-Alloxan-induced (50 mg/kg); III-Alloxan + butin 25 mg/kg; IV-Alloxan + butin 50 mg/kg; V-Butin per se 50 mg/kg. Various diabetic parameters (blood glucose, insulin, HbA1c), lipid profile, inflammatory (TNF-α, IL-1β, IL-6 and NF-κB), antioxidant enzymes (CAT, SOD and GSH), oxidative stress indicators (MDA), apoptosis marker (caspase-3), hepatic markers (ALT and AST), and histopathological changes were assessed. Additionally, molecular docking and dynamics were performed to evaluate the interaction of butin with target proteins. Butin treatment, at both doses, significantly restored biochemical parameters and preserved pancreatic histopathology in diabetic rats. It effectively modulated blood parameters, lipid profiles, inflammatory markers, apoptosis, antioxidant enzyme activity, oxidative stress, and hepatic markers. Molecular docking revealed that butin binds to proteins such as caspase-3 (1NME), NF-κB (1SVC), and serum insulin (4IBM) with binding affinities of − 7.4, − 6.5, and − 8.2 kcal/mol, respectively. Molecular dynamics simulations further suggested that butin induces significant conformational changes in these proteins. Butin exhibits potential effects against alloxan-induced diabetic rats by restoring biochemical balance, reducing inflammation, and protecting pancreatic tissue. Its binding to key proteins involved in apoptosis and inflammation highlights its therapeutic potential in diabetes management.
Keywords: Alloxan, Butin, Diabetes, In silico study
Subject terms: Biomarkers, Endocrinology
Introduction
Diabetes mainly causes persistent hyperglycemia, affecting millions of populations in the world1–3. Diabetes mellitus (DM) is characterized by a chronic endocrine dysfunction and sustained elevations in blood glucose (hyperglycemia) consequent to impaired carbohydrate, protein, and lipid metabolism4–6. Alteration in these metabolic activities can induce a state of oxidative stress characterized by an imbalance between reactive oxygen species (ROS) production and antioxidant defenses. ROS, such as hydrogen peroxide and superoxide anions, can directly damage pancreatic β cells, leading to impaired insulin secretion and causing hyperglycemia7,8. Additionally, ROS can activate various cellular signaling pathways, including nuclear factor kappa-light-chain-enhancer of activated B cells (NF-κB) and protein kinase C (PKC). This activation disrupts normal insulin signaling cascades, ultimately resulting in the development of insulin resistance (IR)8.
Animal models are essential tools for understanding disease pathophysiology and optimizing therapeutic strategies. They provide a safe and ethical alternative to human studies, allowing for the exploration of various treatment options and potential complications. In this study, alloxan-induced diabetes in rats was utilized. Alloxan impairs insulin-induced glucose secretion and damages insulin-producing β cells, making it a cost-effective and accessible alternative to streptozotocin (STZ). The alloxan model is particularly valuable due to its established efficacy in replicating key pathological features of insulin-dependent DM. Chemically known as 2,4,5,6(1H,3H)-pyrimidinetetrone, alloxan is a widely used diabetogenic agent in experimental animal studies, inducing diabetes through the selective targeting and destruction of pancreatic β cells via a cascade of events leading to apoptosis9. Mechanistically, alloxan functions as a cytotoxic glucose analog, closely resembling glucose in structure and exhibiting toxicity towards pancreatic β cells10. Additionally, alloxan inhibits insulin secretion and promotes the generation of reactive oxygen species (ROS), which cause cellular damage. This cascade of effects leads to the development of insulin-dependent diabetes mellitus (DM) in experimental animals11–16.
Despite significant progress in diabetes management over the past three decades, current therapies like insulin, pharmacotherapy, and dietary interventions often present limitations, including the development of resistance, side effects, and potential toxicity14,17. These treatments have some disadvantages like medicine resistance, reduction in effectiveness, and side effects1,18,19. As a result of these side effects of allopathic drugs, the public is shifting further toward natural sources of diabetes therapy20.
Major contents of natural or herbal drugs include carotenoids, flavonoids, terpenoids, alkaloids, glycosides, and antioxidants that exhibit anti-diabetic effects. Flavonoid-containing plants have antioxidant properties. Butin is a flavonoid present in various plants such as Vernonia anthelmintica, Acacia mearnsii, and Dalbergia odorifera. It has strong antioxidant properties and can be used in diabetes. Previously butin was reported to have a positive effect on STZ-induced memory loss, complete Freund’s adjuvant-induced arthritic, 3-nitropropionic acid-induced Huntington’s disease, and brain edema in intracerebral hemorrhage in rats15,16,21,22. In this research, the evidence points towards the influence of butin in an STZ-induced diabetes model. Still, no evidence indicates the influence of butin against the alloxan-induced hypoglycemic activity in rat models with in silico molecular docking and dynamic simulation (MDS) approaches. These approaches provide valuable insights into the binding mechanisms between butin and its putative target proteins. By identifying specific target proteins, the research aims to pave the way for developing targeted therapies for treating diabetes.
This study investigates the protective effects of butin in an alloxan-induced diabetic rat model and assesses its molecular selectivity for caspase-3, NF-κB, and serum insulin through molecular docking and MDS.
Results and discussion
Diabetes is a growing global public health concern, with its prevalence expected to affect large populations in the future. Despite the availability of various treatments and therapies, optimal disease control remains elusive1,14,23. In this study, diabetes was induced in rats using alloxan, which mimics insulin-dependent type 1 diabetes by inhibiting insulin-induced glucose secretion and causing pancreatic cell destruction24. Alloxan-induced diabetes can lead to damage in the pancreas and other organs. However, butin, with its anti-inflammatory and anti-apoptotic properties, may offer protective effects on the pancreas and associated organs25,26. The findings of this study demonstrate that butin can enhance glucose metabolism, promote insulin secretion, and improve antioxidant capacity, leading to increased glycogen storage in the liver and muscles. Additionally, in diabetic rats, butin may protect the kidneys from hyperglycemia-induced oxidative stress, thereby preserving kidney function27–29.
Effect of butin on weight variation
On the 30th day of the study, both initial and final body weights were measured. The alloxan-induced diabetic rats exhibited a significant decrease in body weight (P < 0.05), while those treated with butin (25 and 50 mg/kg) showed no significant changes in body weight. Furthermore, butin administration significantly mitigated the weight loss observed in the alloxan-induced group (P < 0.0001) (Fig. 1). The weight loss in the alloxan-induced diabetic animals can be attributed to increased glucose utilization and the depletion of glycogen stores24. Additionally, uncontrolled hyperglycemia can lead to dehydration and further weight reduction. These changes in body weight may also result from alterations in food intake, physical activity, and energy expenditure30,31. However, diabetic rats treated with butin maintained their body weight, suggesting a protective effect against the catabolic consequences of diabetes32,33.
Fig. 1.
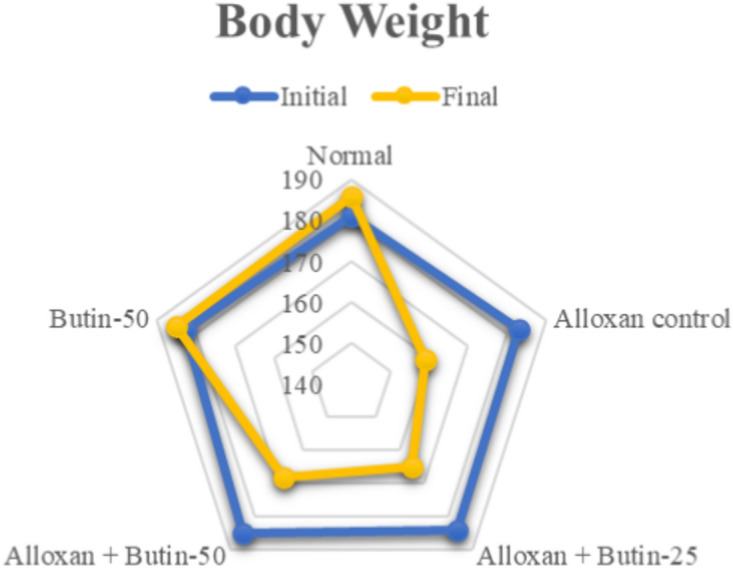
Effect of butin on body weight. Values are expressed in mean (n = 6).
Effect of butin on hemoglobin A1c (Hb1Ac)
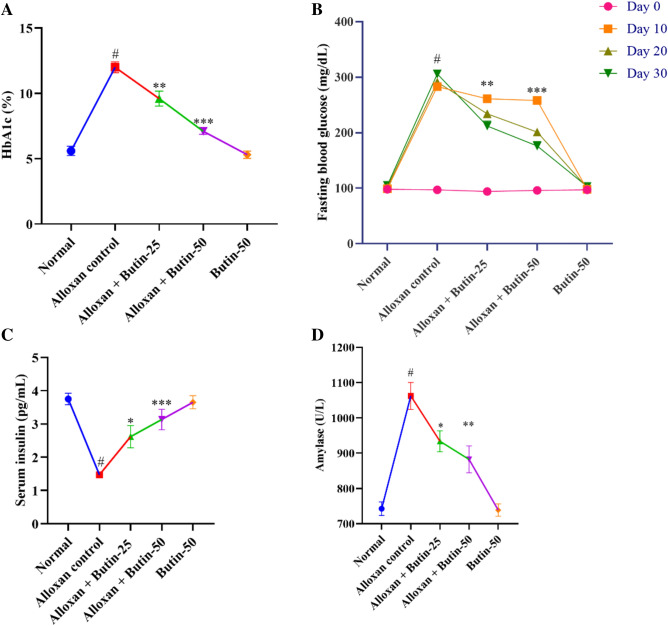
Hb1Ac level in the alloxan-induced group was higher (P < 0.01) in association with the normal group. The treatment with butin (25 and 50 mg/kg) led to a significant decrease in Hb1Ac level (F (4, 25) = 53.72, (P < 0.0001)). There was a significant effect of the butin per se group in association with the alloxan-induced group (P < 0.0001) (Fig. 2A).
Fig. 2.
(A–D) Effect of butin on (A) Hb1Ac, (B) blood glucose level, (C) serum insulin level, (D) serum amylase. Values are expressed in mean ± S.E.M. (n = 6). A one-way ANOVA followed applied to Tukey’s post hoc test, #P < 0.01 vs normal group; *P < 0.05, **P < 0.001, ***P < 0.0001 shows statistically significant results vs alloxan control group.
HbA1c is a widely used marker for long-term glucose control in diabetic individuals. A glycated HbA1c results from the non-enzymatic attachment of glucose to hemoglobin’s N-terminal valine residue. Additionally, the degree of glycation in a biosystem is related to blood glucose. In alloxan-induced diabetic rats, HbA1c levels are elevated as a result of persistent hyperglycemia29. However, treatment with butin at both tested doses significantly reduced these elevated HbA1c levels34.
Effect of butin on blood glucose
The fasting blood glucose level was observed to be elevated (P < 0.01) in an alloxan-induced group compared to the normal group. Butin at doses (25 and 50 mg/kg) showed substantial reductions in fasting blood glucose levels (F (4, 100) = 768.8, (P < 0.0001)) in association with the alloxan-induced group at Day 10, 20 and 30. Butin per se had a significant effect on blood glucose levels in the context of the alloxan-induced group (P < 0.0001) (Fig. 2B).
Blood glucose level was significantly elevated in alloxan-induced diabetic rats due to the selective targeting and destruction of pancreatic β cells by alloxan35, and the treatment with butin resulted in a reduction in glucose levels in these diabetic rats.
Effect of butin on insulin levels and amylase
Alloxan-induced rats showed reduced serum insulin and increased amylase levels (P < 0.05) in compared to the normal group. Treatment with butin at doses of 25 and 50 mg/kg significantly restored serum insulin (F (4, 25) = 15.50, (P < 0.0001)) and amylase (F (4, 25) = 155.7, (P < 0.0001)). Butin per se had a significant effect on serum insulin and amylase levels as associated with the alloxan- induced group (P < 0.0001) (Fig. 2C,D).
Insulin and amylase are synthesized by pancreatic β cells, and the destruction of these cells leads to a decrease in insulin levels, resulting in hyperglycemia. Butin, however, appears to exert protective effects on pancreatic β cells, thereby maintaining insulin levels and inhibiting the elevation of amylase, which is crucial for carbohydrate digestion25,36.
Effect of butin on lipid profile
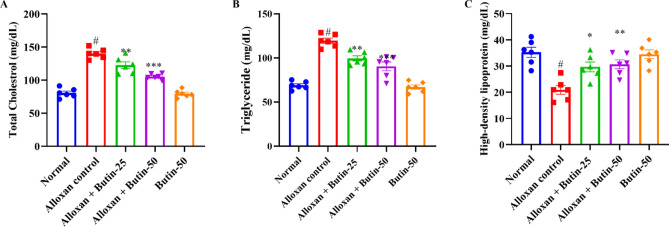
In comparison to the normal group, the alloxan-induced group exhibited a significant increase (P < 0.05) in serum lipid levels, specifically triglyceride (TG), total cholesterol (TC), and high-density lipoprotein cholesterol (HDL) levels. Both doses of butin (25 and 50 mg/kg) significantly reduced TC (F (4, 25) = 67.71, (P < 0.0001)) and TG levels (F (4, 25) = 46.77, (P < 0.0001)) in diabetic animals. In addition, butin administration significantly maintained HDL levels (F (4, 25) = 10.48, (P < 0.0001)) compared to the alloxan-induced group. Butin per se exhibited a significant effect in context to the alloxan-induced group (P < 0.0001) (Fig. 3A–C).
Fig. 3.
(A–C) Effect of butin on (A) TG, (B) TC, (C) HDL-C. Values are expressed in mean ± S.E.M. (n = 6). A one-way ANOVA followed applied to Tukey’s post hoc test, #P < 0.01 vs normal group; *P < 0.05, **P < 0.001, ***P < 0.0001 shows statistically significant results vs alloxan control group.
Lipid profile in alloxan-induced diabetic rats helps to understand the physiopathology of diabetic dyslipidaemia, and it reflects on the diabetic complication mechanism and reveals possible therapeutic targets. The lipid profile in alloxan-induced diabetic animals can provide valuable insights into the metabolic changes associated with diabetes and the risk of cardiovascular complications37,38. In diabetic conditions, there is a dysregulation of lipid metabolism, leading to alterations in lipid profiles. The lipid levels in alloxan-treated diabetic rats were higher TC, TG and lower HDL levels. However, butin treatment effectively restored a more favorable lipid profile, consistent with findings from studies30,39.
Effect of butin on liver enzymes
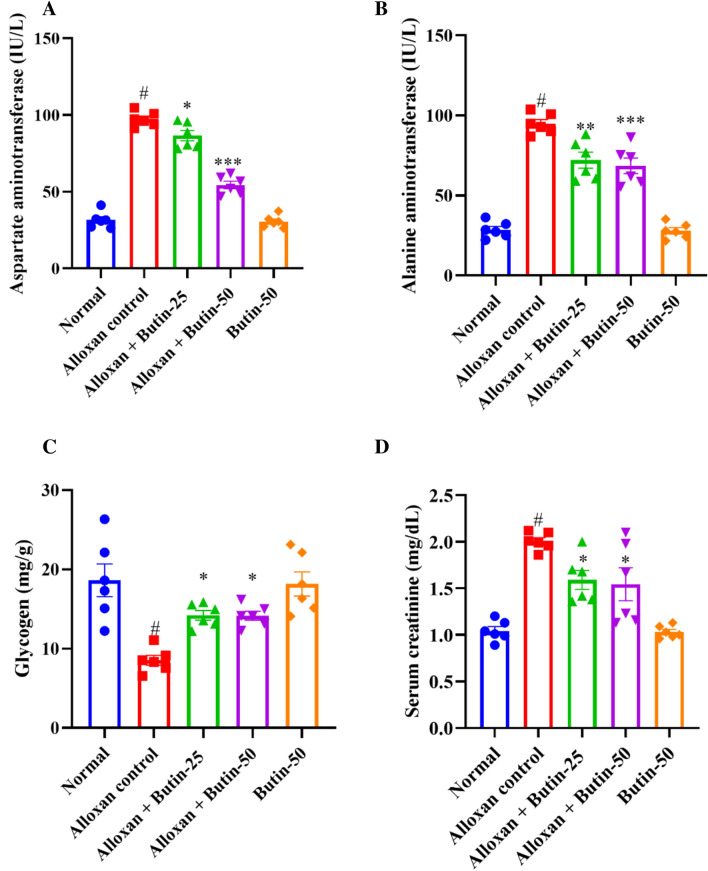
The levels of alanine transaminase (ALT) and aspartate transaminase (AST) were remarkably increased (P < 0.001) in the diabetic group compared to the normal group. Treatment with butin at doses of 25 and 50 mg/kg has significantly reduced ALT (F (4, 25) = 68.10, (P < 0.0001)) and AST levels (F (4, 25) = 166.5, (P < 0.0001)) compared to the alloxan-induced group. There was a significant effect in the butin per se group compared to the alloxan-induced group (P < 0.0001) (Fig. 4A,B).
Fig. 4.
(A–D) Effect of butin on (A) AST, (B) ALT, (C) liver glycogen level, (D) serum creatinine level. Values are expressed in mean ± S.E.M. (n = 6). A one-way ANOVA followed applied to Tukey’s post hoc test, #P < 0.01 vs normal group; *P < 0.05, **P < 0.001, ***P < 0.0001 shows statistically significant results vs alloxan control group.
Elevated ALT and AST levels in the bloodstream can indicate tissue damage, particularly in the liver. Previously reported that alloxan-induced diabetes showed an enhanced level of ALT and AST, indicating hepatic damage resulting in leakage of these hepatic enzymes in the blood, but butin both doses reduced the levels of these hepatic enzymes, providing protection against hepatic damage40.
Effect of butin on glycogen and creatinine levels
As shown in Fig. 4C shows that the concentration of liver glycogen was reduced significantly (P < 0.05) in the alloxan-induced group compared to the normal group. Treatment with butin at doses of 25 and 50 mg/kg significantly increased the liver glycogen levels (F (4, 25) = 10.82, (P < 0.0001)) compared to the alloxan-induced group. The butin per se group significantly affected the context of the alloxan-induced group (P < 0.0001). Furthermore, creatinine was observed to be increased in alloxan-induced rats (P < 0.05) compared to the normal group. The treatment with butin (25 and 50 mg/kg) has significantly reduced the concentration of creatinine (F (4, 25) = 18.53, (P < 0.0001)). The butin per se group had a significant effect in association with the alloxan-induced group (P < 0.0001) (Fig. 4D).
In alloxan-induced diabetes in rats, there were notable alterations in glycogen metabolism and creatinine levels, which are crucial for glucose regulation and kidney function, respectively. The alloxan-induced rats exhibited a decrease in glycogen levels and increased creatinine levels, leading to impaired glucose regulation and kidney damage. Butin treatment substantially restored glycogen and creatinine levels, suggesting its potential to maintain glucose homeostasis and protect against protection against kidney damage40.
Effect of butin on antioxidant enzymes
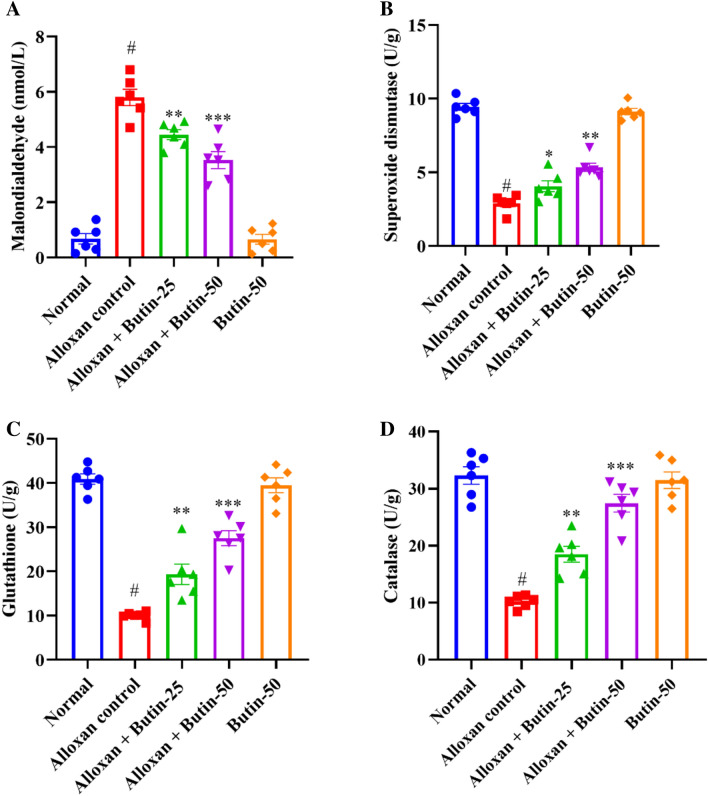
In Fig. 5A–D, alloxan-induced rats, showed a significant decrease in the levels of superoxide dismutase (SOD), glutathione (GSH), and catalase (CAT), along with a significant increase in malondialdehyde (MDA) levels compared to the normal group (P < 0.05). Butin-treated groups were substantially elevated in the activities of these enzymes i.e., SOD (F (4, 25) = 119.4, (P < 0.0001)), GSH (F (4, 25) = 69.58, (P < 0.0001)), and CAT (F (4, 25) = 49.44, (P < 0.0001)) and reduced the MDA level (F (4, 25) = 92.91, (P < 0.0001)) as compared to alloxan-induced group. The butin per se group also demonstrated a significant effect relative to the alloxan-induced group (P < 0.0001).
Fig. 5.
(A–D) Effect of butin on (A) MDA, (B) SOD, (C) GSH, (D) CAT. Values are expressed in mean ± S.E.M. (n = 6). A one-way ANOVA followed applied to Tukey’s post hoc test, #P < 0.01 vs normal group; *P < 0.05, **P < 0.001, ***P < 0.0001 shows statistically significant results vs alloxan control group.
Alloxan-induced diabetes is characterized by increased oxidative stress, driven by the generation of ROS and impaired antioxidant defence mechanisms41. Consequently, alterations in antioxidant markers are commonly observed in animals. In alloxan-induced rats, SOD, GSH, and CAT levels were markedly reduced, while MDA levels were significantly elevated compared to the normal group. Treatment with butin significantly enhanced SOD, GSH, and CAT levels and reduced MDA levels, indicating its potential to mitigate oxidative stress16.
Estimation of pro-inflammatory cytokines
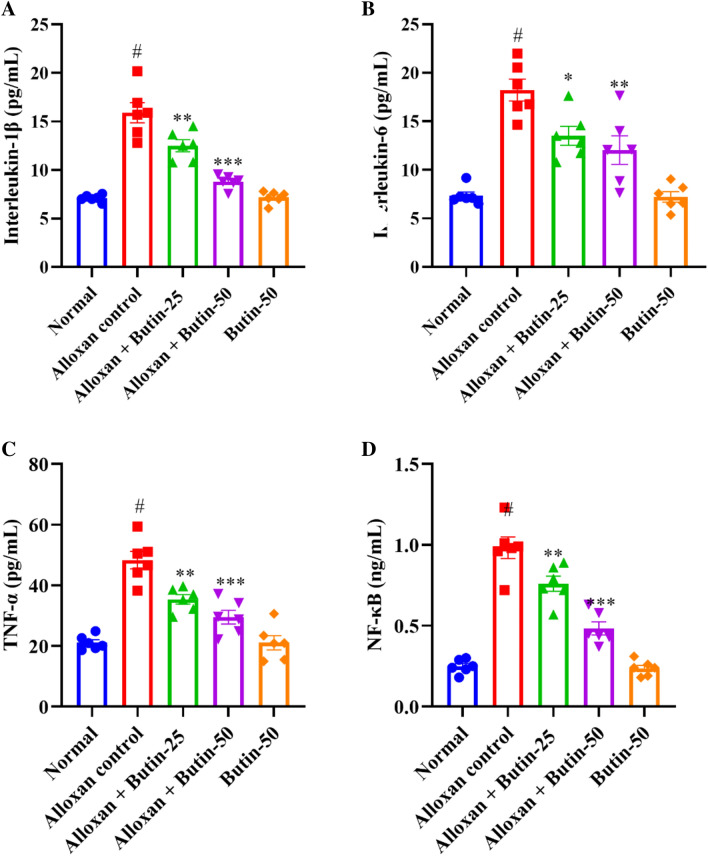
Alloxan-induced diabetes resulted in a significant increase in pro-inflammatory parameters, including tumor necrosis factor-α (TNF-α), interleukin-1β (IL-1β), IL-6, and NF-κB, as assessed by one-way ANOVA. Figure 6A–D shows that alloxan treatment markedly elevated the production of pro-inflammatory markers—TNF-α, IL-1β, IL-6, and NFκB compared to the normal group (P < 0.05). However, treatment with butin at doses of 25 and 50 mg/kg significantly restored the levels of these inflammatory mediators- TNF-α (F (4, 25) = 28.67, (P < 0.0001)), IL-1β (F (4, 25) = 44.66, (P < 0.0001)), IL-6 (F (4, 25) = 22.00, (P < 0.0001)) and NFκB (F (4, 25) = 59.24, (P < 0.0001)) compared to the alloxan-induced group. The butin per se group also demonstrated a significant effect relative to the alloxan-induced group (P < 0.0001).
Fig. 6.
(A–D) Effect of butin on, (A) IL-1β, (B) IL-6, (C) TNF-α, (D) NF-κB. Values are expressed in mean ± S.E.M. (n = 6). A one-way ANOVA followed applied to Tukey’s post hoc test, #P < 0.01 vs normal group; *P < 0.05, **P < 0.001, ***P < 0.0001 shows statistically significant results vs alloxan control group.
Alloxan-induced diabetes in rats is known to cause alterations in the immune system, leading to increased levels of pro-inflammatory cytokines. These inflammatory mediators, including cytokines and chemokines, can exacerbate the destruction of pancreatic β cells42. A significant elevation in inflammation and pro-inflammatory cytokines was observed in alloxan-induced rats43. NF-κB plays a crucial role in regulating immune responses and inflammation, and its levels are elevated in the pancreas and other organs following alloxan administration44,45. In this study, butin effectively restored TNF-α, IL-1β, IL-6, and NF-κB levels in alloxan-induced rats, suggesting that its anti-inflammatory effects may contribute to mitigating diabetes-related complications.
Effect of butin on caspase-3 activity
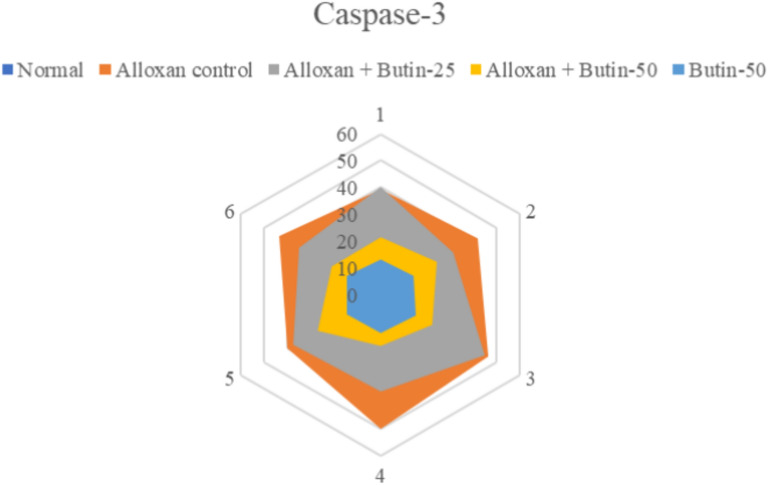
Caspase-3 activity was significantly upregulated in the alloxan-induced groups (P < 0.05); however, following 30 days of butin administration, caspase-3 activity showed a marked downregulation (F(4, 25) = 106.9, P < 0.0001) compared to the alloxan-induced rats. The butin per se group also demonstrated a significant effect in contrast to the alloxan-induced group (P < 0.0001) (Fig. 7). Caspase-3 is a cysteine protease that regulates apoptosis (programmed cell death) in the cell. In alloxan-induced diabetic rats, elevated glucose levels have been shown to induce oxidative stress, which in turn increases caspase-3 activity, leading to the apoptosis of pancreatic β cells. Previous studies have revealed that high glucose concentrations, as induced by alloxan, contribute to oxidative stress, further damaging β cells and upregulating caspase-3 activity as a marker of apoptosis45,46. This study suggests that butin treatment effectively reduces caspase-3 activity in alloxan-induced diabetic rats, indicating its potential to protect pancreatic β cells from apoptosis47.
Fig. 7.
Effect of butin on caspase-3 activity. Values are expressed in mean ± S.E.M. (n = 6).
Histopathological changes in the pancreas
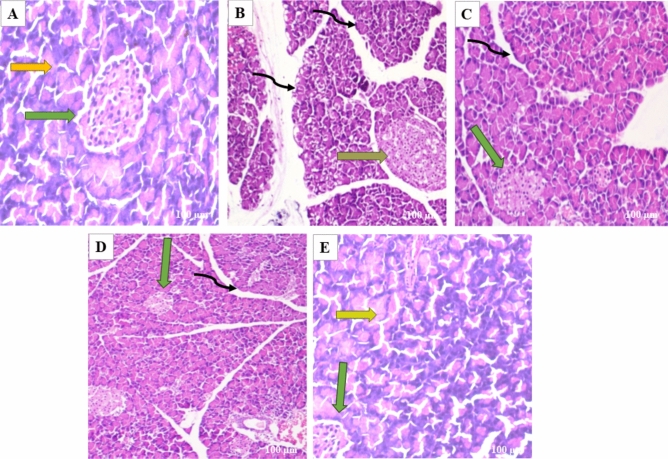
Pancreatic tissues were stained with H&E to evaluate the effects of butin on alloxan-induced pancreatic damage in diabetic rats. The pancreas from the normal and butin 50 mg/kg groups exhibited a normal appearance of the islets of Langerhans and interlobular ducts (Fig. 8A–E). In contrast, pancreas sections from alloxan control animals showed structural abnormalities in the islets of Langerhans and hyperplasia of islet cells (Fig. 8B). Rats treated with butin at 25 and 50 mg/kg for 30 days following alloxan injection demonstrated improvements in the histopathological architecture of the Langerhans islets and interlobular ducts (Fig. 8C,D).
Fig. 8.
(A–E) In the photomicrographs, the pancreatic tissue sections are stained with H & E at a magnification of × 100 as compared to various experimental groups. (A) The appearance of normal islets of Langerhans (green arrow) and normal intralobular duct (yellow arrow) in normal control rats. (B) Abnormal structure of islet of Langerhans (orange arrow), and disorganized degenerative changes in the nuclei of the acini (black curved arrow) in alloxan control rats. (C) Mild hyperplasia of the islet cells (green arrow) and interlobular duct (black curved arrow) in alloxan + butin-25. (D) Histopathological architecture improved (green arrow) and reorganized interlobular duct (black curved arrow) in alloxan + butin-50. (E) Normal islets of Langerhans (green arrow) and exocrine acini (yellow arrow) exhibited in butin-50.
Histopathological analysis of diabetic rats revealed severe necrosis and distortion of pancreatic tissue48. However, administration of butin to alloxan-induced diabetic rats resulted in the normalization of the Langerhans islets. These observations collectively suggest that butin offers protective effects on pancreatic tissues, reducing the extent of damage in alloxan-induced diabetic rats49.
Molecular docking and dynamic simulation
In the in-silico study, three proteins, i.e., caspase-3, serum insulin, and NF-κB, were selected based on empirical evidence from our in vivo studies, which demonstrated significant biological interactions between butin and these targets. To further elucidate the molecular mechanisms underlying these interactions, in silico analyses were conducted. This computational approach allowed us to explore the molecular-level interactions between butin and these specific targets, providing a deeper understanding of their binding interactions and potential therapeutic implications.
The molecular docking study revealed that butin exhibits significant binding interactions with 1NME (caspase-3), 1SVC (NF-κB), and 4IBM (serum insulin), with binding affinities of − 7.4, − 6.5, and − 8.2 kcal/mol, respectively (Fig. 9). These findings suggest that butin may be a promising therapeutic agent capable of targeting caspase-3, NF-κB, and serum insulin in alloxan-induced diabetes, offering potential benefits in the management of the disease50–52.
Fig. 9.
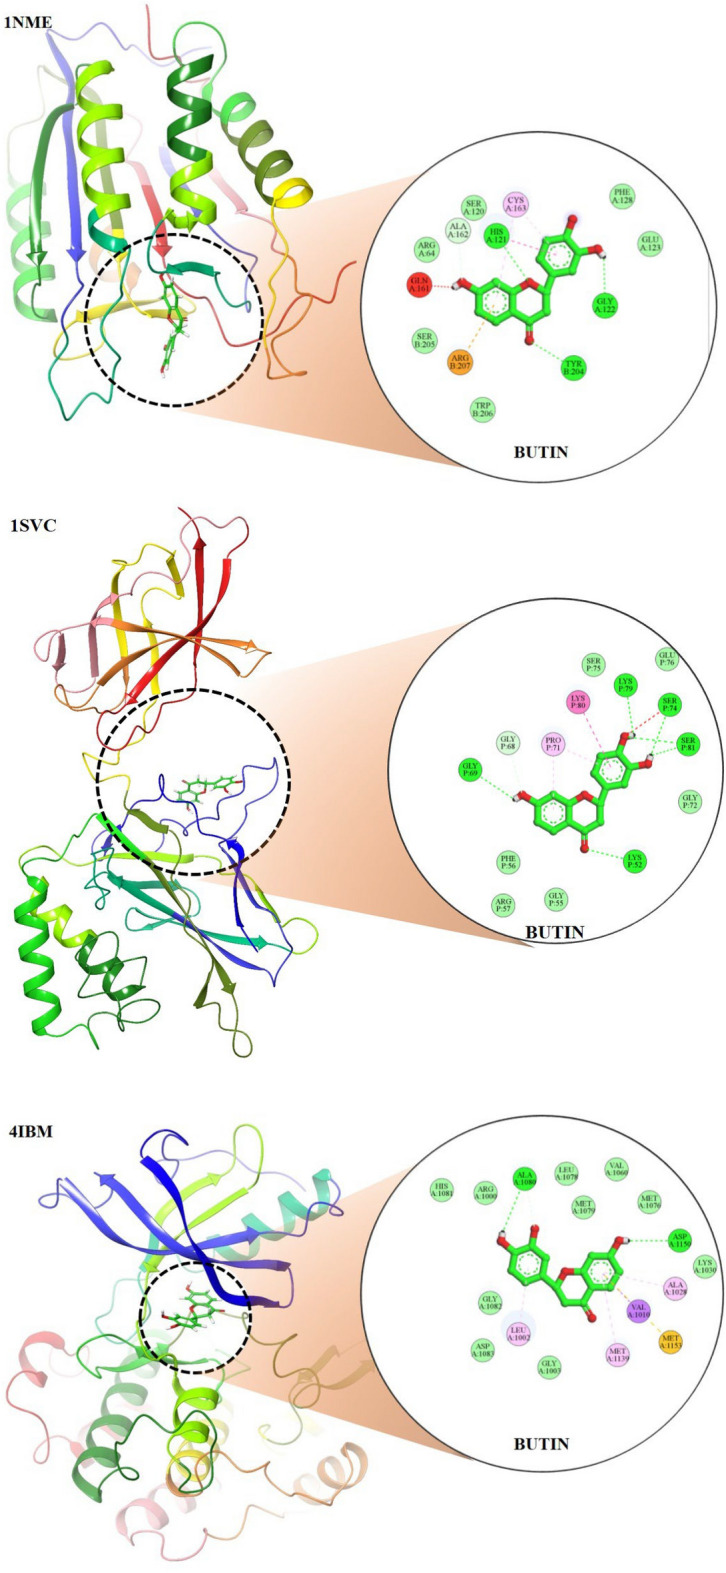
Molecular docking 2D and 3D images of the butin with proteins Caspase-3(1NME), NFKβ (1SVC) and Serum Insulin (4IBM).
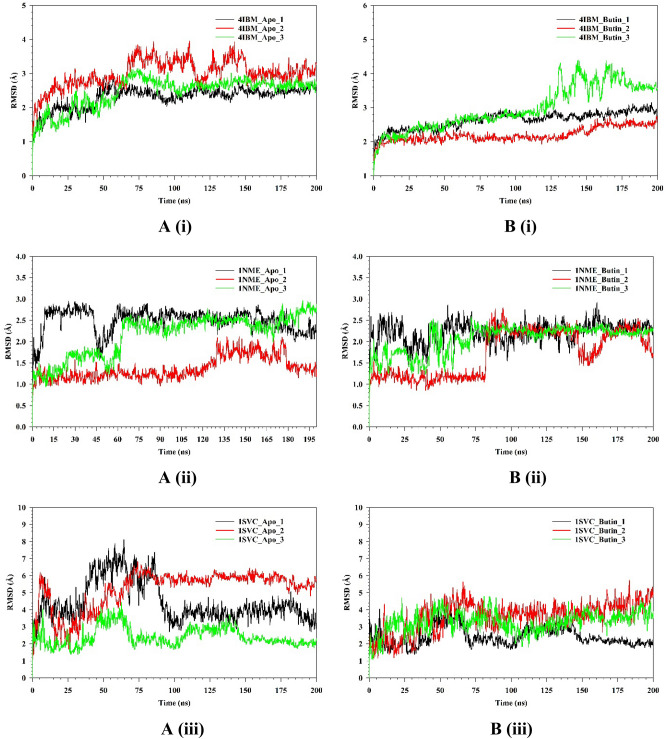
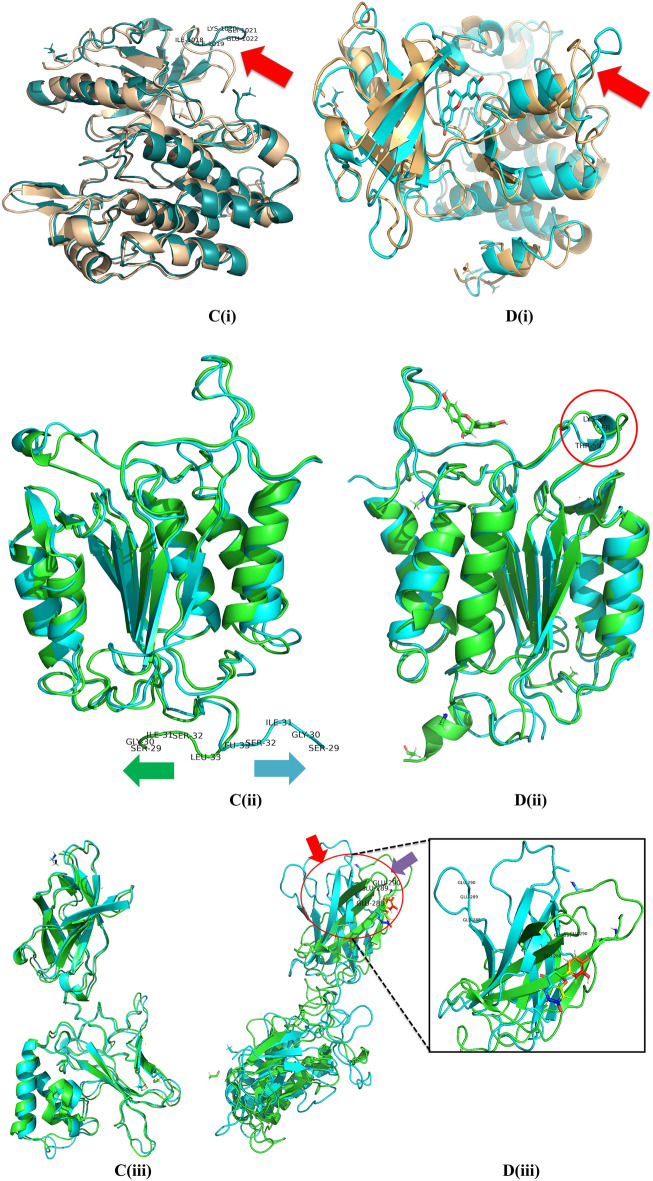
The stability and convergence of the Apo-4IBM and 4IBM + Butin complexes were investigated using molecular dynamics simulation (MDS). When comparing the root mean square deviation (RMSD) data, a simulation of 200 ns revealed stable conformation. The average RMSD of the Cα-backbone of Apo-4IBM exhibited 2.58 Å and a deviation of 0.36686 Å, which is relatively small. Moreover, the RMSD average is below 3 Å (Fig. 10A(i)). RMSD clustering matrix analysis with frequency 10 of trajectory clusters exhibited 12 distributed clusters with few overlapping sampling. 4IBM + Butin complex, on the other hand, exhibited an average RMSD of Cα-backbone from the triplicate of 2.60 Å (Fig. 10B(i)) having a standard deviation of 0.38 Å (Table 1). The best two clusters with high conformations are analyzed by superimposing their conformational structures. The best two clusters where RMS deviation was observed to be 0.81 Å (Table 1) with a small change in conformation at the extended loop region (marked arrow Fig. 10C(i)).
Fig. 10.
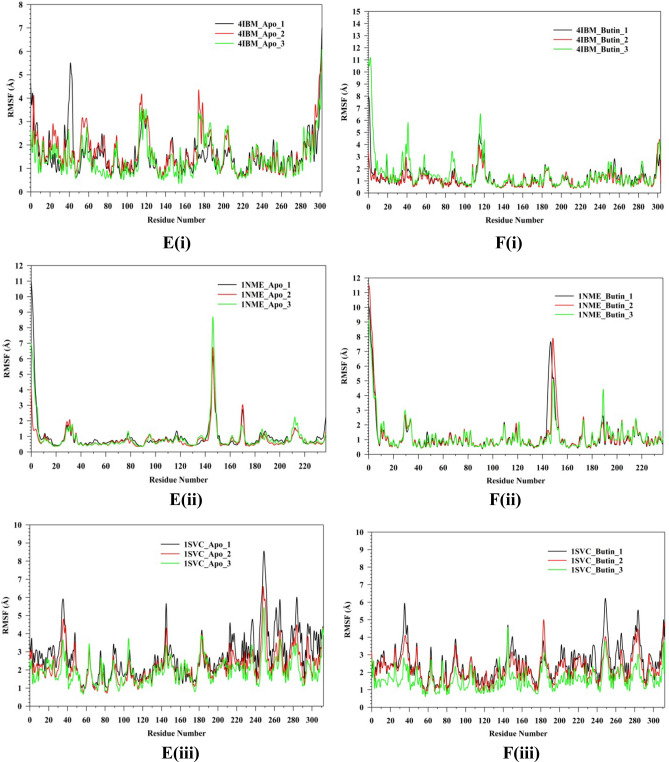
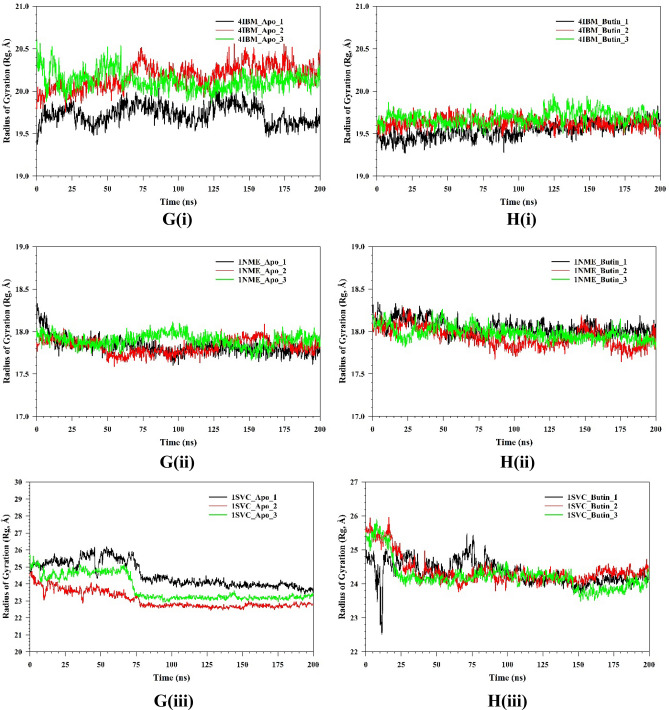
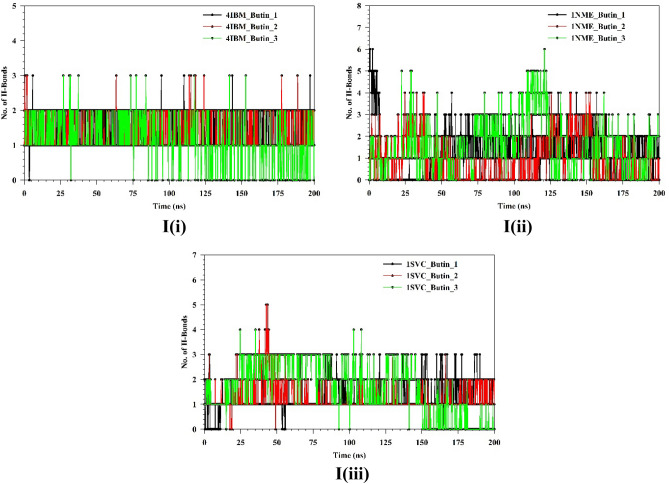
Plots of triplicate run displaying RMSD for Cα-backbone of (A(i)) 4IBM_Apo, (B(i)) 4IBM bound with Butin, (A(ii)) 1NME_apo, (B(ii)) 1NME bound with Butin, (A(iii)) 1SVC_Apo, (B(iii)) 1SVC bound with Butin, superimposed two best clusters (C(i)) 4IBM_apo, (C(ii)) 1NME_apo, (C(iii)) 1SVC_apo displaying the residues of the positions for which RMS deviation occur. Superimposed best RMSD cluster of Apo and Butin bound to (D(i)) 4IBM, (D(ii)) 1NME (displaying the loop arrangement during simulation), (D(iii)) orientation of binding cavity of best apo cluster and Butin bound cluster of 1SVC. RMSF plots of Cα-backbone of triplicate run for (E(i)) 4IBM_apo, (F(i)) 4IBM bound to butin, (E(ii)) 1NME_apo, (F(ii)) 1NME bound with butin, (E(iii)) 1SVC apo and (F(iii)) 1SVC bound to butin. Radius of gyration plots of Cα-backbone of triplicate run for (G(i)) 4IBM_apo, (H(i)) 4IBM bound to butin, (G(ii)) 1NME_apo, (H(ii)) 1NME bound with butin, (G(iii)) 1SVC apo and (H(iii)) 1SVC bound to butin. Average hydrogen bonds from triplicate simulation run for (I(i)) 4IBM, (I(ii)) 1NME and (I(iii)) 1SVC.
Table 1.
Comparative statement triplicate run for trajectory analysis for apo and butin bound to 4IBM, 1NME and 1SVC where 1NME_Apo_1, 1NME_Apo_2, 1NME_Apo_3 represent first replicate, second replicate and third replicate of protein in apo state respectively for 200 ns each, while 1NME_butin_1, 1NME_butin_2, 1NME_butin_3 represent first replicate, second replicate and third replicate of protein complexed with butin respectively for 200 ns each.
| Replicate 1 | Replicate 2 | Replicate 3 | Std deviation | |
|---|---|---|---|---|
| 4IBM-Apo | ||||
| RMSD (Å) | 2.305385 | 3.000602 | 2.449859 | 0.36686 |
| RMSF (Å) | 1.553264 | 1.661025 | 1.428202 | 0.116519 |
| Radius of gyration (Å) | 19.7299 | 20.1789 | 20.12426 | 0.244982 |
| 4IBM-butin | ||||
| RMSD (Å) | 2.631995 | 2.200847 | 2.976539 | 0.388651 |
| RMSF (Å) | 1.243319 | 1.089697 | 1.515357 | 0.215558 |
| Radius of gyration (Å) | 19.53517 | 19.62901 | 19.68836 | 0.07724 |
| 1NME-Apo | ||||
| RMSD (Å) | 2.491949 | 1.369895 | 2.152171 | 0.575385 |
| RMSF (Å) | 0.990143 | 0.803769 | 0.931853 | 0.09534 |
| Radius of gyration (Å) | 17.82484 | 17.82685 | 17.89957 | 0.042575 |
| 1NME-butin | ||||
| RMSD (Å) | 2.215868 | 1.74522 | 2.068084 | 0.240691 |
| RMSF (Å) | 1.287487 | 1.328394 | 1.252579 | 0.037947 |
| Radius of gyration (Å) | 18.04611 | 17.93427 | 17.98418 | 0.056028 |
| 1SVC-Apo | ||||
| RMSD (Å) | 4.444679 | 5.189421 | 2.425333 | 1.430185 |
| RMSF (Å) | 2.772402 | 2.208932 | 1.951047 | 0.420045 |
| Radius of gyration (Å) | 24.54131 | 23.06011 | 23.7452 | 0.741294 |
| 1SVC-butin | ||||
| RMSD (Å) | 4.444679 | 5.189421 | 2.425333 | 1.430185 |
| RMSF (Å) | 2.772402 | 2.208932 | 1.951047 | 0.420045 |
| Radius of gyration (Å) | 24.54131 | 23.06011 | 23.7452 | 0.741294 |
The conformational deviation from RMSD cluster analysis of best cluster conformation from 4IBM + Butin and Apo-4IBM exhibited a RMS Deviation of 1.9 Å (Fig. 10D(i)). No significant conformational deviation occurs at the ligand butin binding cavity, while the extended loop of the side chain exhibited a small conformational deviation (Fig. 10D(i)), arrow marked). Therefore, from the clustering analysis, RMS deviations are observed to be less, exhibiting less conformational deviation and converged structures during simulation. The average RMSD of the Cα-backbone of Apo-1NME exhibited 2.004 Å and a deviation of 0.575385 Å, which is relatively small. Moreover, the RMSD average is below 3 Å (Fig. 10A(ii)). RMSD clustering matrix analysis with frequency 10 of trajectory clusters exhibited 10 distributed clusters with few overlapping sampling. The best two clusters with high conformations are analyzed by superimposing their conformational structures. Figure 10B(ii) shows the RMSD average of 1NME bound with butin. Figure 10C(ii) exhibited the best two clusters where RMS Deviation was observed to be 0.55 Å (Table 1). It was observed that the terminal residues Ser29, Gly30, Ile31, Ser32 and Leu33 are oriented in opposite directions to achieve the structures’ convergence. Whereas 1NME bound to Butin has exhibited an average RMSD of 2.009 Å and a deviation of 0.240691 Å. The overall deviation has been reduced as compared to apo form in ligand bound state. Clustering analysis of the conformers exhibited 17 distributed clusters, and the best cluster having the highest conformers was superimposed with the best cluster of apo for exhibiting the loop formation improving flexibility (Fig. 10D(ii)) in Butin bound state where the apo form conforms a helical turn. Thus, the ligand-bound structure exhibited more flexible conformation in order to accommodate the ligand.
The average RMSD of the Cα-backbone of Apo-1SVC3 exhibited 4.01 Å and a deviation of 1.430185 Å, which is relatively small (Fig. 10A(iii)). RMSD clustering matrix analysis with frequency 10 of trajectory clusters exhibited 12 distributed clusters with few overlapping sampling. The best two clusters with high conformations are analyzed by superimposing their conformational structures (Fig. 10B(iii)). There are no marked differences observed among the best two cluster conformers (Fig. 10C(iii)), while the butin bound 1SVC3 exhibited similarly as displayed for Apo bound state 4.01 Å and a deviation 1.430185 Å (Table 1). RMSD clustering exhibited a deviation of the loop orientation at the binding pocket of butin where the pocket was much straighter in apo form while in the ligand-bound state, more pulled toward the ligand for better accommodation of butin (Fig. 10D(iii)).
The root mean square fluctuations (RMSF) plots provide insight into the flexibility of residues within a protein structure. In the case of the Apo-4IBM complex, the RMSF plot reveals notable fluctuations at specific residue positions, particularly at positions 40, and in the ranges of 110–125 and 170–190, where the fluctuation exceeds 3 Å (Fig. 10E(i)). These fluctuations suggest a degree of flexibility in the side chain residues at these positions, indicating potential regions of conformational variability within the protein structure. To quantify the overall fluctuation across the entire trajectory of the Apo-4IBM simulation, the average RMSF is computed. The average RMSF over the entire trajectory from triplicate runs is calculated to be 1.54 Å, with a standard deviation of 0.117 Å (Table 1). This value provides a measure of the typical fluctuation observed throughout the simulation, indicating the overall dynamic behavior of the protein. Upon binding of the ligand to the 4IBM complex, changes in RMSF patterns can be observed. The average RMSF in the ligand-bound 4IBM complex is recorded to be 1.28 Å, indicating a reduction in overall fluctuation compared to the Apo state. Specific residue positions exhibit higher fluctuations in the ligand-bound state, notably at positions 40 and in the range of 115–125 (Fig. 10F). However, the fluctuations observed in the range of positions 170–190, which were prominent in the Apo state, diminish in the ligand-bound state. This suggests that the binding of the ligand induces structural stabilization in the protein, leading to reduced flexibility overall, except for a few specific flexible regions influenced by the ligand binding. RMSF plot of 1NME-Apo and butin exhibiting the high fluctuating peak at residues between 140 and 150 and the rest residues are less fluctuating (Fig. 10E(ii),E(iii)). This indicates the flexible residues between 140 and 150 positions might be involved in forming the loops, and the rest of the protein is rigid in both ligand-bound and unbound states. RMSF analyses of 1SVC3-apo and 1SVC3-butin complexes exhibited a series of fluctuating residues. In 1SVC3-apo, major fluctuations are observed from 21–40, 140–155, 245–257, 259–276, and 277–290 residues (Fig. 10E(iii)) while butin bound complex exhibited the lowering of the fluctuating residues as compared to the apo form (Fig. 10F(iii)). This indicates that the flexibility of the residues in the apo form might be due to loop arrangements, which perhaps conformed in other secondary structures at ligand-bound state. In summary, the RMSF analysis provides valuable insights into the dynamic behavior of the protein structure in both the Apo and ligand-bound states. The observed fluctuations indicate regions of flexibility and rigidity within the protein, with changes in RMSF patterns upon ligand binding reflecting alterations in protein dynamics and stability. The radius of gyration (RoG) serves as a crucial metric for assessing the compactness of a protein structure. A lower RoG value indicates a more compact orientation of the protein, suggesting tighter packing of its constituent residues. In the context of this study, the RoG analysis provides insights into the structural dynamics of the Apo-4IBM and butin-bound 4IBM complexes. For the Apo-4IBM complex, the triplicate runs of trajectories spanning 200 ns demonstrate a stable RoG profile (Fig. 10G(i)). This stability indicates that the protein structure has reached a converged state and is properly folded, as evidenced by the consistent RoG values observed throughout the simulation. The average RoG value for the Apo-4IBM complex is recorded to be 20.01 Å, with a standard deviation of 0.244 Å (Table 1). This value represents the typical compactness exhibited by the protein in its unbound state. In contrast, the butin-bound 4IBM complex displays a similarly stable RoG profile across all triplicate sets (Fig. 10H(i)). The RoG values for the butin-bound complex are consistently lower compared to the Apo state, indicating a higher level of compactness induced by the binding of the ligand. The average RoG for the butin-bound 4IBM complex is calculated to be 19.61 Å, with a smaller standard deviation of 0.077 Å (Table 1). This tighter packing of the protein structure in the presence of the ligand suggests a more compact conformation adopted upon ligand binding. In the case of 1NME-apo, the RoG plot exhibited the lowering pattern in the 1st run, while the couple of runs of the triplicate exhibited the stable pattern (Fig. 10G(ii)). The average RoG value is calculated from the triplicate runs 17.84 Å with a standard deviation 0.042575 Å (Table 1). In comparison, 1NME complexed with butin exhibited small lowering patterns of all the 3 replicates (Fig. 10H(ii)). The average RoG value is calculated from the triplicate runs 17.98 Å with a standard deviation 0.056028 Å (Table 1). On the other hand, 1SVC3-Apo and butin bound structures exhibited lowering pattern (Fig. 10H(iii)) in both cases and average RoG is calculated as 23.78 Å with a standard deviation 0.741294 Å (Table 1). Comparing the RoG values between the Apo and butin-bound structures provides valuable insights into the structural changes induced by ligand binding. The significantly lower RoG values observed in the butin-bound complex indicate a more compact orientation of the protein compared to its unbound state. This finding underscores the stabilizing effect of ligand binding on the protein structure, leading to a tighter and more compact conformation. Overall, the RoG analysis highlights the structural alterations accompanying ligand binding and provides quantitative evidence of the resulting changes in protein compactness. The number of hydrogen bonds between protein and ligand suggests the significant interaction and stability of the complex. Butin bound to 4IBM, 1NME and 1SVC exhibited an average of 1.14, 1.54, and 1.59 hydrogen bonds respectively signifying butin shows stable interaction between them (Fig. 10I(i)). However, 1NME and 1SVC bound state exhibited good hydrogen bond interaction as compared to 4IBM (Fig. 10I(ii),I(iii)).
Molecular mechanics generalized born surface area (MM-GBSA) calculations
Utilizing the MD simulation trajectory, the binding free energy along with other contributing energy in form of MM-GBSA were determined for 4IBM with Butin complex. The results (Table 1) suggested that the maximum contribution to ΔGbind in the stability of the simulated complex were due to ΔGbindCoulomb, ΔGbindvdW and ΔGbindLipo, while, ΔGbindCovalent and ΔGbind SolvGB contributed to the instability of the 4IBM with Butin complex complex and the average binding energy from the triplicate run is calculated as − 37.5067 ± 4.89 kcal/mol (Table 2). However, significant contribution exhibited by ΔGbindCovalent and ΔGbindSolv imparts negative effect on butin binding with the protein (Table 2). Therefore, MMGBSA calculation supported the potential of butin ligand having high affinity of binding to the protein as well as efficiency in binding to the selected protein and the ability to form stable protein–ligand complex.
Table 2.
Binding free energy components for the 4IBM with butin complex calculated by MM-GBSA.
| Energies (kcal/mol) | 4IBM_butin | 4IBM_butin2 | 4IBM_butin3 | Average |
|---|---|---|---|---|
| ΔGbind | − 41.69 | − 38.70 | − 32.13 | − 37.5067 ± 4.89 |
| ΔGbindCoulomb | − 16.60 | − 16.56 | − 13.94 | − 15.7 ± 1.52 |
| ΔGbindCovalent | 1.50 | 1.17 | 1.46 | 1.376667 ± 0.18 |
| ΔGbindHbond | − 0.89 | − 0.88 | − 1.02 | − 0.93 ± 0.07 |
| ΔGbind Lipo | − 10.32 | − 10.42 | − 7.23 | − 9.32333 ± 1.81 |
| ΔGbindSolvGB | 20.23 | 19.82 | 15.55 | 18.53333 ± 2.59 |
| ΔGbindvdW | − 35.60 | − 31.85 | − 26.93 | − 31.46 ± 4.34 |
The average binding energy from the triplicate run is calculated as − 15.3867 ± 8.65 kcal/mol (Table 3). However, the significant contribution exhibited by ΔGbindCovalent and ΔGbindSolv negatively affects butin binding with the protein (Table 3). Therefore, from MMGBSA calculation supported the potential of butin ligand having high affinity of binding to the protein as well as efficiency in binding to the selected protein and the ability to form stable protein–ligand complex. The average binding energy from the triplicate run is calculated as − 13.5633 ± 2.85 kcal/mol (Table 4). However, the significant contribution exhibited by ΔGbindCovalent and ΔGbindSolv imparts a negative effect on butin binding with the protein (Table 4). Therefore, MMGBSA calculation supported the potential of the butin ligand having a high affinity of binding to the protein as well as efficiency in binding to the selected protein and the ability to form a stable protein–ligand complex.
Table 3.
Binding free energy components for the 1NME with butin complex calculated by MM-GBSA.
| Energies (kcal/mol) | 1NME_butin | 1NME_butin2 | 1NME_butin3 | Average |
|---|---|---|---|---|
| ΔGbind | − 36.5 | − 1.13 | − 8.53 | − 15.3867 ± 8.65 |
| ΔGbindCoulomb | − 12.08 | − 0.96 | − 1.83 | − 4.95667 ± 2.18 |
| ΔGbindCovalent | 0.33 | 0.04 | 0.11 | 0.16 ± 0.15 |
| ΔGbindHbond | − 0.86 | − 0.05 | − 0.17 | − 0.36 ± 0.43 |
| ΔGbind Lipo | − 12.85 | − 0.33 | − 2.66 | − 5.28 ± 0.66 |
| ΔGbindSolvGB | 11.21 | 1.35 | 4.14 | 5.566667 ± 0.69 |
| ΔGbindvdW | − 19.27 | − 1.18 | − 7.94 | − 9.46333 ± 3.14 |
Table 4.
Binding free energy components for the 1SVC with butin complex calculated by MM-GBSA.
| Energies (kcal/mol) | 1SVC_butin | 1SVC_butin2 | 1SVC_butin3 | Average |
|---|---|---|---|---|
| ΔGbind | − 15.12 | − 25.57 | 0.00 | − 13.5633 ± 2.85 |
| ΔGbindCoulomb | − 10.03 | − 6.17 | − 0.02 | − 5.40667 ± 0.54 |
| ΔGbindCovalent | 0.91 | 1.16 | 0.00 | 0.69 ± 0.06 |
| ΔGbindHbond | − 0.70 | − 1.06 | 0.00 | − 0.58667 ± 0.05 |
| ΔGbind Lipo | − 3.63 | − 7.04 | 0.00 | − 3.55667 ± 2.3 |
| ΔGbindSolvGB | 12.26 | 9.29 | 0.03 | 7.193333 ± 6.3 |
| ΔGbindvdW | − 13.86 | − 19.61 | − 0.01 | − 11.16 ± 1.2 |
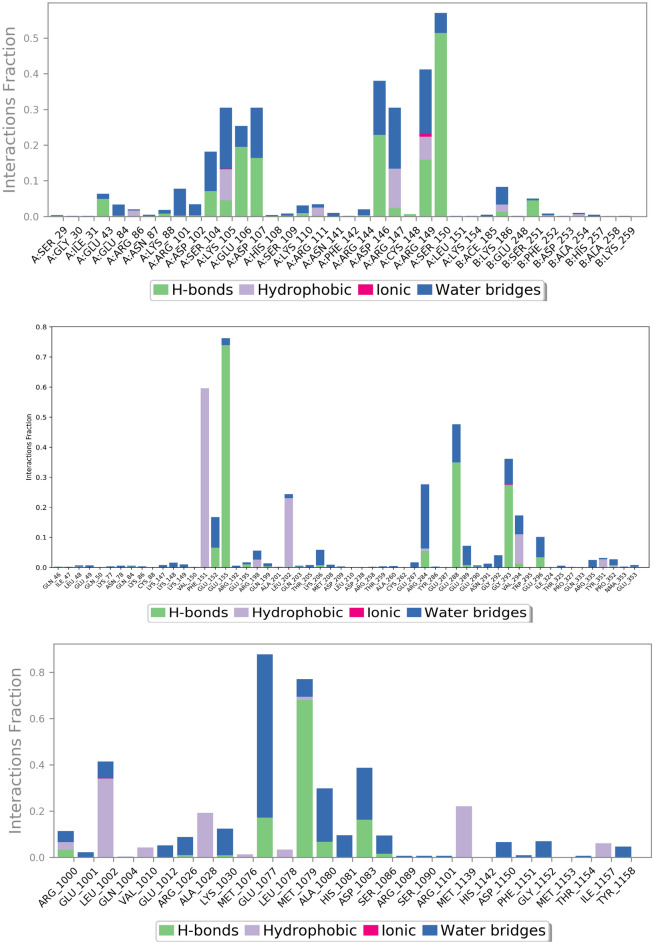
Figures 11 and 12 represent ligand interactions with residues of 1NME (Top), 1SVC (Middle), and 4IBM (Bottom) over the period of simulation and ligand atoms’ interaction with residues of proteins 1NME (Top), 1SVC (Middle), and 4IBM (Bottom) occurs more than 10% of the simulation time 200 ns. Investigation of the simulation study of butin presented water bridge, H-bonding hydrophobic interactions within stable regions of proteins. Butin interacted with 1NME at residue Ser104, Glu106, Asp107, Asp146, and Ser150 through water bridge and hydrogen bonding, while with residues Lys106, Arg147, and Arg147 through water bridge, hydrogen bonding, and hydrophobic interactions. Butin interacted with 1MNE at residue Glu106, Ser150, and Asp146 at 18%, 27%, and 17%, respectively, through hydrogen bonds, while with Arg147 at 10% through hydrophobic interactions.
Fig. 11.
The plot represents ligand interactions with residues of 1NME (Top), 1SVC (Middle), and 4IBM (Bottom) over the period of simulation.
Fig. 12.
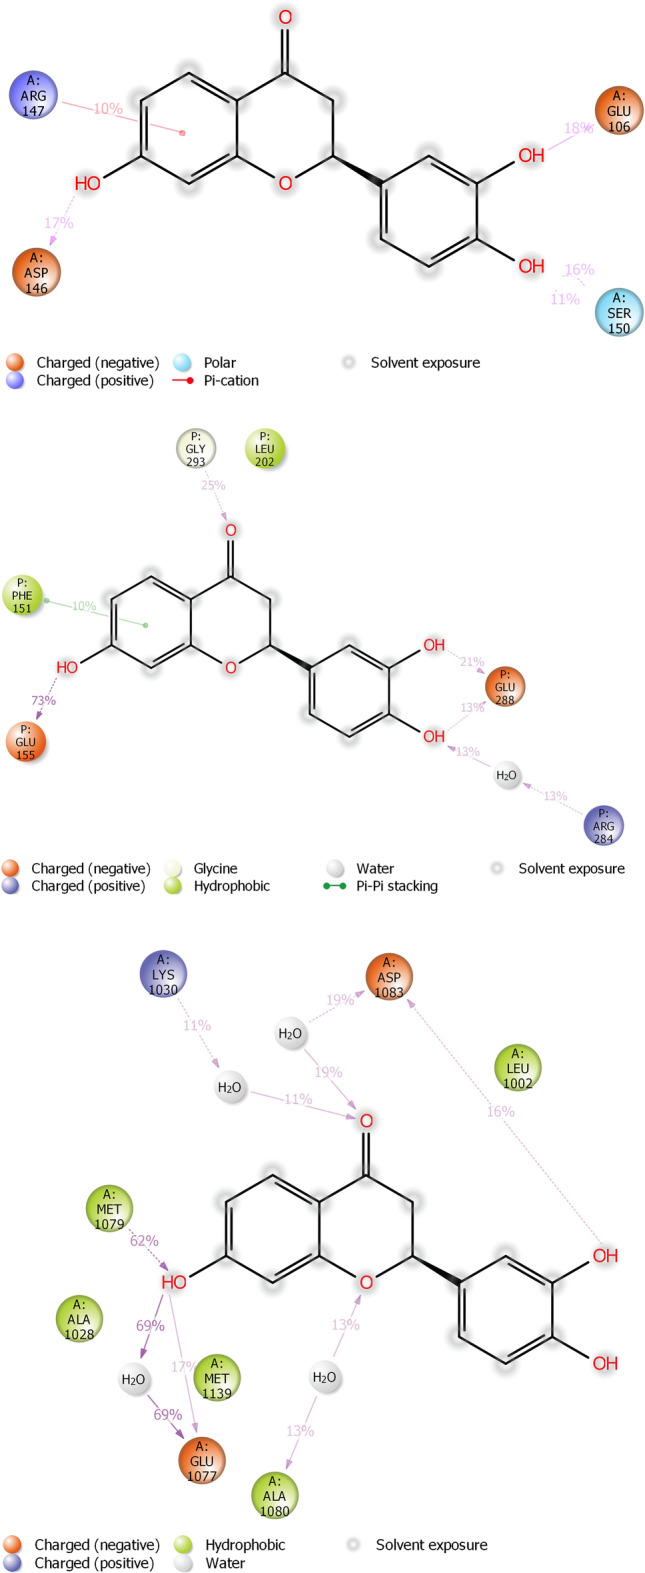
The schematic of detailed ligand atoms’ interaction with residues of proteins 1NME (Top), 1SVC (Middle), and 4IBM (Bottom) occurs more than 10% of the simulation time 200 ns.
With protein 1SVC, butin interacted at residue Glu155, Glu152, Arg284, Glu288, Gly293, and Glu296 through water bridges and H-bonding, while with Phe151 through hydrophobic interaction. Butin exhibits 25% interaction with Gly293, 34% interaction with Glu288, 73% interaction with Glu155 through hydrogen bonding, 26% interaction with Arg284 through water bridges, and 10% interaction with Phe151 through pi-pi stacking with protein 1SVC.
Butin interacted with protein 4IBM at residues Leu1002 through hydrophobic and water bridges, with Ala1028 and Met1139 through hydrophobic interaction, while with Glu1077, Met1079, Ala1080, and Asp1083 through water bridge and H-bonds. Butin exhibits 62% interaction with Met1079 through hydrogen bonding, 54% interaction with Asp1083, 150% interaction with Glu1077 through water bridges and hydrogen bonding, 22% interaction with Lys1030, and 26% interaction with Ala1080 through water bridges with 4IBM.
The mentioned amino acids that interact with ligands have a significant role in the active site and play an important role in the stability of butin with selected targets. The study suggests that butin interacts with all targets through a hydrogen bonds-water bridge network with significant frequencies. In addition, the figure shows that butin interacted better with 1SVC and 4IBM than 1NME, as concluded from the percentage interactions found between ligands and residues. This suggests that butin binds with 1NME and 1SVC mostly through hydrogen bonding, while with 4IBM through the water bridges-h-Bond network.
The comparison between the protein–ligand contacts during the course of simulation and initial docking studies of 1NME with butin and 1SVC with butin reveals a notable disparity in interaction persistence and type of interaction (Fig. 13). Trajectory analysis shows diverse and dynamic interaction profiles across the simulation period with a significant number of interactions. This dynamic nature shows the ability of the simulation study to capture transient and stable interactions that are relevant over the simulation period. However, docking studies demonstrate a more constrained interaction landscape, initially dominated by few interactions, which shows that docking provides initial insight into potential binding modes50. When we compare the MD study protein–ligand interaction of the 4IBM_butin complex with its initial docking study, it has been found that the docking study provides a foundational propensity for hydrogen bonding and hydrophobic interactions, often underrepresented statically51. However, in the MD simulations, a more nuanced interaction landscape emerges, characterized by an enhanced prevalence of hydrophobic interactions and the critical role of water bridges in stabilizing the complex53. This not only supports the transient nature of molecular interactions but also highlights the importance of considering solvent effects and dynamic changes over the period of simulation time. Such findings support the integration of MD simulations to achieve a more comprehensive understanding of protein–ligand interaction54–56.
Fig. 13.
Timeline representation of the interaction of butin with residues of proteins 1NME (First), 1SVC (Middle), and 4IBM (Last) in each trajectory frame over the period of simulation.
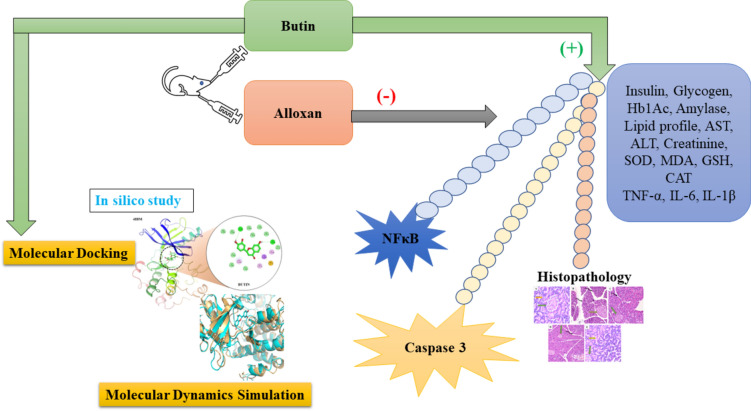
The results of this study suggest that butin treatment may influence additional pathways to control blood glucose and modulate diabetes pathogenesis in rats (Fig. 14). However, further research is required to establish whether butin is a viable therapeutic agent for diabetes and to elucidate its effects on insulin and glucose regulation in alloxan-induced diabetic rats.
Fig. 14.
Proposed mechanism of butin against alloxan-induced diabetic rats.
The study also has several limitations that could affect the interpretation and reliability of the findings. These include constraints related to the use of small animal models, variability in Western blot results, and challenges associated with immunohistochemistry.
Conclusion
This research suggests that flavonoids containing active constituents, such as butin, hold significant potential in the treatment of diabetes. In alloxan-induced diabetic rats, butin demonstrated favorable effects in managing diabetes and its associated complications. This indicates that butin may be a promising candidate for developing new formulations, offering valuable opportunities for researchers and potentially expanding the scope of diabetes treatment options available to the public.
Materials and methods
Chemicals
Alloxan (Sigma-Aldrich, USA) was used in the study. Butin (> 97% purity), serum insulin (MSW07), ALT (ALT-MSW-01), AST (AST-MSW-02), creatinine (Cr-MSW-01), MDA (MSW-MDA), SOD (MSW-SOD), GSH (MSW-GSH), CAT (MSW-CAT) were obtained from MSW Pharma M.S., India. The enzyme-linked immunosorbent assay (ELISA) kit for rats was utilized to determine NF-κB (MSW-NF-κB), TNF-α (MSW-TNF-α), IL-1β (MSW-IL-1β), IL-6 (MSW-IL-6), caspase-3 activity (MSW-Cap-3) (MSW Pharma, M.S., India).
Animals
Healthy male Wistar rats (Males 9–10 weeks old) were included in the study. The weight of animals between 180 ± 20 g and maintained in an animal house under standard conditions 12:12 h light: dark cycle module with 24 °C of temperature and 50–60% controlled humidity. Diet and water were given to rats ad libitum. Rats were acclimated to standard laboratory conditions over a period of 7 days. The Institutional Animal Ethical Committee approved (TRS/PT/023/039) study protocol and research conducted as per the ARRIVE (Animal Research: Reporting in Vivo Experiments) guidelines57.
Induction of diabetes in experimental animals
A 50 mg/kg dose of alloxan monohydrate was injected into overnight fasted rats, followed by 5% glucose solution bottles in their cages to prevent hypoglycemia58. After 72 h, the glucose level was measured to evaluate diabetes progression, followed by 30 days of treatment59,60.
Study protocol
A total of 30 rats were divided at randomly as follows (n = 6)
Blood glucose levels were measured 72 h after alloxan administration. Rats with blood glucose levels exceeding 250 mg/dL were classified as diabetic and selected for the study. All animals underwent weight measurements before and after treatment. On the final day of the study, the rats were anesthetized with ketamine (75 mg/kg, i.p.) and xylazine (10 mg/kg, i.p.). Biochemical analyses were performed using ~ 4–6 mL of blood collected from each rat via orbital sampling on day 3061. Histopathological examination was conducted prior to the separation of tissue for biochemical analysis.
Estimation of Hb1Ac (glycated hemoglobin)
The blood was withdrawn (~ 0.5–0.8 mL of blood withdrawn) from the retroorbital plexus and mixed with 10 mL of a saline solution containing 0.2% disodium EDTA. It was centrifuged at 1500 × g for 20 min. at 40 °C. High-performance liquid chromatography was used to evaluate Hb1Ac levels62,48.
Estimation of blood glucose
Blood samples were obtained from rats by tail vein puncture on a single-timed glucose strip. The glucose level was measured by ACCU-CHECK glucometer (Roche Products Pvt. Ltd., India) periodically at Day 0, 10th, 20th and 30th63.
Measurement of insulin levels
We used a commercial Rat ELISA insulin kit (sensitivity: 23.5 pg/mL) as per the standard reported in the assay protocol (~ 0.2–0.5 mL of blood withdrawn). We were directed by the manufacturer’s instructions to determine the insulin concentration.
Glycogen estimation
Homogenate of the liver was prepared using 1 mL of 5% potassium hydroxide, and 5 mL of ethyl alcohol was poured to precipitate glycogen followed by centrifugation. The supernatant was isolated and anthrone reagent was added to produce a green color at a wavelength of 620 nm64.
Estimation of creatinine
The estimation of creatinine(~ 0.5 mL of blood withdrawn from each rat) was performed by using modified Jaffe’s method the basis of the evaluation was a colored compound produced by the reaction of creatinine with picric acid (for safety precaution, a diluted solution of picric acid was used), measured at 520 nm in mg/dL as the color intensity65.
Estimation of lipid profile, AST and ALT
A sample of blood was withdrawn (~ 1 mL) from each rat for lipid profile analysis and was taken and subjected to centrifugation at 2000×g for 20 min. The investigation was conducted using separated supernatants. HDL, TG, and TC (Modern Lab, M.S., India) were assessed.
ALT and AST (~ 0.3–0.5 mL of blood withdrawn from each rat) were used as biomarkers for liver function tests assayed by using standard kits. These enzymes act as an indication of hepatic damage. The manufacturer’s protocol was followed during the procedure (Modern Lab, M.S., India).
Estimation of biochemical parameters
The liver was isolated, rinsed with ice-cold saline, and homogenized in a buffer containing 0.1 M Tris–HCl at pH 7.4 to measure antioxidant enzyme activity.
Assay of antioxidant enzymes
The activities of antioxidant enzymes, SOD, GSH and CAT were measured in all experimental sets by using following the method.
SOD
After centrifuging the sample containing 0.5 mL of the previously prepared homogenate sample as mentioned in 2.12, 2 mL of ethanol, and 1 mL of chloroform, additional ingredients were added. These included 1 mL of sodium pyrophosphate buffer, 0.1 mL of N-methyl dibenzo pyrazine methyl sulphate, 0.3 mL of nitobluetetrazonium, and 0.2 mL of reduced nicotinamide adenine dinucleotide. A spectroscopic approach was used to measure the chromogen at 560 nm. The amount of NBT reduction that is inhibited by 50% in a minute is referred to as an enzyme unit. The enzyme’s estimated activity was U/g66.
GSH estimation
The Ellman method was used for this study; 1 mL of homogenate and 2 mL of trichloro acetic acid were centrifuged, and the supernatant was isolated. 1 mL of Ellman’s reagent was added to the supernatant, followed by the addition of 4 mL disodium hydrogen phosphate. This mixture was mixed properly, and the intensity was measured at 412 nm using a UV spectrophotometer. The concentration of GSH was estimated as U/g and one unit of GSH (U/g) = enzyme unit per gram of initial solid substrate (w/w)67,68.
CAT measurement
A 0.5 mL sample solution was mixed with potassium phosphate (50 mM) and 0.1 mL of hydrogen peroxide (H2O2) in phosphate buffer. The degradation of H2O2 was analyzed at 240 nm at 15-s intervals. The basis of the assay was the degradation of hydrogen peroxide by catalase enzyme, which was measured as U/g tissue and one unit of CAT (U/g) = enzyme unit per gram of initial solid substrate (w/w)69.
MDA estimation
The supernatant obtained in the above process was added with 0.2 mL of sodium lauryl sulphate (SLS), 1.5 mL acetic acid, and 1 mL thiobarbituric acid (TBAR) followed by heating up to 1 h. The mixture was cooled, followed by the addition of 5 mL n-butanol and pyridine. The mixture was centrifuged at 4000 rpm for 15 min, the organic phase was separated and measured at 532 nm by spectrophotometer. The MDA was expressed as nmol/L tissue70,71.
Pro-inflammatory cytokine determination
The ELISA kit uses the sandwich-ELISA method, which involves a microwell plate and a pre-coated antibody. Spectrophotometric analysis was used to measure the optical density. By using an immunoassay kit, the amounts of NF-κB (sensitivity: < 0.119 ng/mL), IL-6 (sensitivity: < 3.3 pg/mL), IL-1β (sensitivity: < 5.4 pg/mL), and TNF-α (sensitivity: < 1 pg/mL) in serum (~ 1 mL blood sample of each rat) were calculated72. The standards were prepared by the manufacturer of the ELISA kit and provided with the kit. In order to determine optical density (OD), the ELISA Reader (Meril Pvt. Ltd. India) was used at a wavelength of 450 nm. In this experiment, the OD value was proportional to the concentration of rat cytokine. OD was used to compare samples with the standard curve to calculate rat cytokine concentration. The marker concentrations were determined using standard curves, and IL-1β, TNF-α, and IL-6 levels were expressed in picograms per millilitre. NFκB level was expressed as nanograms per millilitre.
Estimation of caspase-3
Caspase-3 activity in rat serum samples was measured utilizing a biochemical test in accordance with the ELISA kit (sensitivity: Up to 0.5 ng/mL)73. Caspase-3 concentration was calculated in ng/mL.
Histopathological study
At the end of the experiment, the animals were sacrificed. The pancreatic tissues were immediately immobilized in a 10% buffered neutral formalin solution. Cover the tissues with plastic moulds after gently dipping them in hot paraffin using metallic blocks. The fixed tissues were divided into 5 mm-thick transverse sections. To analyse the pancreas microscopically, these sections were stained with hematoxylin and eosin at a magnification of × 100. The histological expert did not know the therapy allocation or biochemical outcome.
Docking study
Utilizing proprietary Bash scripts built on AUTODOCKTools 1.5.6, the structures of ligands and proteins were transformed to the pdbqt format. We used AutoDock Vina 1.2.5 for docking investigations, with grid points spaced 0.375 Å apart. The grid box was centred on the active site of the target. NF-Kβ 1SVC (34.401, 9.319, 37.650 and 20, 20, 20), Serum Insulin 4IBM (4.31, − 9.36, 6.92 and 20, 20, 20), and Caspase-3 1NME (42.09, 96.34, 24.13 and 30, 30, 30) were the grid parameters that were followed. To enable 2D and 3D images, the corresponding protein–ligand complexes were exposed to Biovia Discovery Studio Visualizer, LigPlot v1.4.5, and Maestro 12.7 following the completion of the docking operations. Using the PLIP server, detailed interactions between the protein and ligand were found. The table contains details.
MDS
MDS was conducted using the Desmond software Vs 2020.1 from Schrodinger, focusing on apo and docked complex involving 4IBM, 1NME and 1SVC with butin. Triplicate sampling was carried out under identical conditions for each MD run to enhance result reliability. The simulations utilized the OPLS-2005 force field74,75 and an explicit solvent model with simple point charger (SPC) water molecules. Sodium ions (Na+) were introduced to neutralize the charge, while a NaCl solution (0.15 M) was employed to mimic physiological conditions. The system underwent equilibration using the NVT ensemble for 200 ps, followed by a 12 ps equilibration and minimization run using the NPT ensemble, constructed using the Nose–Hoover chain coupling method76. All simulations were conducted at a temperature of 27 °C, with a relaxation time of 1.0 ps and a pressure of 1 bar, utilizing a time step of 2 fs. Pressure regulation employed the Martyna–Tuckerman Klein chain coupling scheme with a relaxation duration of 2 ps. The particle mesh Ewald method was utilized for determining long-range electrostatic interaction, with a Coulomb interaction radius set at 9 cm. Bonded forces were estimated using the RESPA integrator with a time step of 2 fs. The stability of MD simulations was assessed through parameters including root mean square deviation (RMSD), radius of gyration (Rg), root mean square fluctuation (RMSF), solvent accessible surface area (SASA), and hydrogen bond count. Clustering analysis was performed on RMSD trajectories spanning 200 ns for Apo-4IBM and 4IBM + Butin complex using the Desmond trajectory clustering module, with a frequency of 20 and 10 possible clusters considered in the RMSD matrix construction. The most populated clusters from the apo, butin-bound, proteins (4IBM) were compared to investigate conformational changes, followed by a comparison of the top two most populated clusters to assess conformational variations at the ligand binding cavities74,75,77.
Binding free energy analysis
The molecular mechanics combined with generalized Born surface area (MM-GBSA) approach was used to compute the binding free energies of the ligand–protein complexes. The MM-GBSA binding free energy was calculated using the Python script thermal mmgbsa.py in the simulation trajectory with the VSGB solvation model and the OPLS5 force field over last 50 frames with a 1 step sampling size. The binding free energy of MM-GBSA (kcal/mol) was estimated using the principle of additivity, in which individual energy modules such as columbic, covalent, hydrogen bond, van der Waals, self-contact, lipophilic and solvation of ligand and protein were collectively added. The equation used to calculate ΔGbind is the following77:
where ΔGbind designates the binding free energy, ΔGMM designates difference between the free energies of ligand–protein complexes and the total energies of protein and ligand in isolated form, ΔGSolv designates difference in the GSA solvation energies of the ligand-receptor complex and the sum of the solvation energies of the receptor and the ligand in the unbound state, ΔGSA designates the difference in the surface area energies for the protein and the ligand.
Statistical analysis
One-way ANOVA was used for data analysis, followed by Tukey’s post hoc test with significance set at P < 0.05. Graph pad prism version 8.0.2 was used for statistical analysis.
Acknowledgements
Authors are thankful for Researchers Supporting Project number (RSPD2024R552), King Saud University, Riyadh, Saudi Arabia.
Author contributions
Conceptualization: Imran Kazmi; methodology: Nadeem Sayyed; original draft: Hussam A. Bukhari; critical revision of manuscript: Muhammad Afzal, Fahad A. Al-Abbasi, Ryan A. Sheikh, May M. Alqurashi, Azizah Salim Bawadood, and Sami I. Alzarea; fund acquisition: Abdulaziz Alamri.
Data availability
The datasets generated during and/or analysed during the current study are available from the corresponding author on reasonable request.
Competing interests
The authors declare no competing interests.
Ethical approval
Animal experiments were approved by the Institutional Animal Ethical Committee, Trans-Genica Ethical Committee, M.S., India (approval number TRS/PT/023/039). In addition, all procedures for animal experiments described in this study were performed in accordance with the IAEC guidelines for the care and use of laboratory animals and ARRIVE guidelines.
Footnotes
Publisher's note
Springer Nature remains neutral with regard to jurisdictional claims in published maps and institutional affiliations.
References
- 1.Zheng, Y., Ley, S. H. & Hu, F. B. Global aetiology and epidemiology of type 2 diabetes mellitus and its complications. Nat. Rev. Endocrinol.14(2), 88–98 (2018). 10.1038/nrendo.2017.151 [DOI] [PubMed] [Google Scholar]
- 2.Zhao, X., Zhang, Y., Yang, Y. & Pan, J. Diabetes-related avoidable hospitalisations and its relationship with primary healthcare resourcing in China: A cross-sectional study from Sichuan Province. Health Soc. Care Community30(4), e1143–e1156 (2022). 10.1111/hsc.13522 [DOI] [PubMed] [Google Scholar]
- 3.Yu, T. et al. Identification of potential biomarkers and pathways associated with carotid atherosclerotic plaques in type 2 diabetes mellitus: A transcriptomics study. Front. Endocrinol.13, 981100 (2022). 10.3389/fendo.2022.981100 [DOI] [PMC free article] [PubMed] [Google Scholar]
- 4.Kumari, S., Kamboj, A., Wanjari, M. & Sharma, A. K. Nephroprotective effect of Vanillic acid in STZ-induced diabetic rats. J. Diabetes Metab. Disord.20(1), 571–582 (2021). 10.1007/s40200-021-00782-7 [DOI] [PMC free article] [PubMed] [Google Scholar]
- 5.ElSayed, N. A. 2. Diagnosis and classification of diabetes: Standards of care in diabetes—2024. Diabetes Care47, S20–S42 (2024). 10.2337/dc24-S002 [DOI] [PMC free article] [PubMed] [Google Scholar]
- 6.Chen, J. et al. Bone marrow stromal cell-derived exosomal circular RNA improves diabetic foot ulcer wound healing by activating the nuclear factor erythroid 2-related factor 2 pathway and inhibiting ferroptosis. Diabet. Med.40(7), e15031 (2023). 10.1111/dme.15031 [DOI] [PubMed] [Google Scholar]
- 7.Banday, M. Z., Sameer, A. S. & Nissar, S. Pathophysiology of diabetes: An overview. Avicenna J. Med.10(04), 174–188 (2020). 10.4103/ajm.ajm_53_20 [DOI] [PMC free article] [PubMed] [Google Scholar]
- 8.Ma, X. et al. The pathogenesis of diabetes mellitus by oxidative stress and inflammation: Its inhibition by berberine. Front. Pharmacol.9, 782 (2018). 10.3389/fphar.2018.00782 [DOI] [PMC free article] [PubMed] [Google Scholar]
- 9.Sheriff, O. L. et al. A new model for alloxan-induced diabetes mellitus in rats. J. Bangl. Soc. Physiol.14(2), 56–62 (2020). 10.3329/jbsp.v14i2.44785 [DOI] [Google Scholar]
- 10.Dra, L. A. et al. Antidiabetic potential of Caralluma europaea against alloxan-induced diabetes in mice. Saudi J. Biol. Sci.26(6), 1171–1178 (2019). 10.1016/j.sjbs.2018.05.028 [DOI] [PMC free article] [PubMed] [Google Scholar]
- 11.Ighodaro, O. M., Adeosun, A. M. & Akinloye, O. A. Alloxan-induced diabetes, a common model for evaluating the glycemic-control potential of therapeutic compounds and plants extracts in experimental studies. Medicina53(6), 365–374 (2017). 10.1016/j.medici.2018.02.001 [DOI] [PubMed] [Google Scholar]
- 12.Iqbal, S., Khan, S. & Naseem, I. Antioxidant role of vitamin D in mice with alloxan-induced diabetes. Can. J. Diabetes42(4), 412–418 (2018). 10.1016/j.jcjd.2017.10.032 [DOI] [PubMed] [Google Scholar]
- 13.Karle, P. P., Dhawale, S. C. & Navghare, V. V. Amelioration of diabetes and its complications by Manilkara zapota (L.) P Royen fruit peel extract and its fractions in alloxan and STZ-NA induced diabetes in Wistar rats. J. Diabetes Metab. Disord.21(1), 493–510 (2022). 10.1007/s40200-022-01000-8 [DOI] [PMC free article] [PubMed] [Google Scholar]
- 14.Kumar, S., Mittal, A., Babu, D. & Mittal, A. Herbal medicines for diabetes management and its secondary complications. Curr. Diabetes Rev.17(4), 437–456 (2021). 10.2174/18756417MTExfMTQ1z [DOI] [PubMed] [Google Scholar]
- 15.Li, P. & Jiwu, C. Butin attenuates brain edema in a rat model of intracerebral hemorrhage by anti inflammatory pathway. Transl. Neurosci.9, 7–12 (2018). 10.1515/tnsci-2018-0002 [DOI] [PMC free article] [PubMed] [Google Scholar]
- 16.Omer, A. B. et al. Butin mitigates memory impairment in streptozotocin-induced diabetic rats by inhibiting oxidative stress and inflammatory responses. Metabolites12, 11 (2022). 10.3390/metabo12111050 [DOI] [PMC free article] [PubMed] [Google Scholar]
- 17.Liang, X. et al. Comparative study of microvascular structural changes in the gestational diabetic placenta. Diab. Vasc. Dis. Res.20(3), 14791641231173628 (2023). 10.1177/14791641231173627 [DOI] [PMC free article] [PubMed] [Google Scholar]
- 18.Stewart, M. An overview of the oral medicines used in the management of type 2 diabetes. Nurs. Stand.37(1), 54–60 (2022). 10.7748/ns.2021.e11804 [DOI] [PubMed] [Google Scholar]
- 19.Sun, Q. et al. Berberine is a suppressor of Hedgehog signaling cascade in colorectal cancer. Phytomedicine114, 154792 (2023). 10.1016/j.phymed.2023.154792 [DOI] [PubMed] [Google Scholar]
- 20.Kumar, S., Shachi, K. & Prasad, N. Diabetes mellitus and allopathic medication increase the risk of cancer malignancy, but no side effect associated with the use of antidiabetic herbal medicine. Curr. Res. Diabetes Obes. J.13, 555868 (2020). [Google Scholar]
- 21.Alzarea, S. I. et al. Butin attenuates arthritis in complete Freund’s adjuvant-treated arthritic rats: Possibly mediated by its antioxidant and anti-inflammatory actions. Front. Pharmacol.13, 810052 (2022). 10.3389/fphar.2022.810052 [DOI] [PMC free article] [PubMed] [Google Scholar]
- 22.Alshehri, S. et al. Anti-Huntington’s effect of butin in 3-nitropropionic acid-treated rats: Possible mechanism of action. Neurotoxicol. Res.40(1), 66–77 (2022). 10.1007/s12640-021-00462-7 [DOI] [PubMed] [Google Scholar]
- 23.Cloete, L. Diabetes mellitus: An overview of the types, symptoms, complications and management. Nurs. Stand.37(1), 61–66 (2022). 10.7748/ns.2021.e11709 [DOI] [PubMed] [Google Scholar]
- 24.Bansode, T. S., Salalkar, B. K., Dighe, P., Nirmal, S. & Dighe, S. Comparative evaluation of antidiabetic potential of partially purified bioactive fractions from four medicinal plants in alloxan-induced diabetic rats. Ayu38(3–4), 165–170 (2017). 10.4103/ayu.AYU_18_17 [DOI] [PMC free article] [PubMed] [Google Scholar]
- 25.Al-Ishaq, R. K., Abotaleb, M., Kubatka, P., Kajo, K. & Büsselberg, D. Flavonoids and their anti-diabetic effects: Cellular mechanisms and effects to improve blood sugar levels. Biomolecules9, 9 (2019). 10.3390/biom9090430 [DOI] [PMC free article] [PubMed] [Google Scholar]
- 26.Shang, A. et al. Bioactive compounds and biological functions of garlic (Allium sativum L.). Foods2019(8), 7 (2019). [DOI] [PMC free article] [PubMed] [Google Scholar]
- 27.Sekiou, O. et al. Nephroprotective effect of Artemisia herba alba aqueous extract in alloxan-induced diabetic rats. J. Tradit. Complement. Med.11(1), 53–61 (2021). 10.1016/j.jtcme.2020.01.001 [DOI] [PMC free article] [PubMed] [Google Scholar]
- 28.Sharma, B. et al. Rejuvenating of kidney tissues on alloxan induced diabetic mice under the effect of Momordica charantia. Adv. Pharm.2014, 439158 (2014). [Google Scholar]
- 29.Tiss, M. & Hamden, K. Globularia alypum extracts attenuate hyperglycemia and protect against various organ toxicities in alloxan-induced experimental diabetic rats. Evid.-Based Complement. Altern. Med.2022, 6816942 (2022). 10.1155/2022/6816942 [DOI] [PMC free article] [PubMed] [Google Scholar]
- 30.Kim, M. J. & Ha, B. J. Antihyperglycemic and antihyperlipidemic effects of fermented Rhynchosia nulubilis in alloxan-induced diabetic rats. Toxicol. Res.29(1), 15–19 (2013). 10.5487/TR.2013.29.1.015 [DOI] [PMC free article] [PubMed] [Google Scholar]
- 31.Belhadj, S. et al. Metabolic impairments and tissue disorders in alloxan-induced diabetic rats are alleviated by Salvia officinalis L. essential oil. Biomed. Pharmacother.108, 985–995 (2018). 10.1016/j.biopha.2018.09.108 [DOI] [PubMed] [Google Scholar]
- 32.Shah, N. A. & Khan, M. R. Antidiabetic effect of Sida cordata in alloxan induced diabetic rats. Biomed. Res. Int.2014, 671294 (2014). 10.1155/2014/671294 [DOI] [PMC free article] [PubMed] [Google Scholar]
- 33.Oza, M. J. & Kulkarni, Y. A. Formononetin treatment in type 2 diabetic rats reduces insulin resistance and hyperglycemia. Front. Pharmacol.9, 1 (2018). 10.3389/fphar.2018.00739 [DOI] [PMC free article] [PubMed] [Google Scholar]
- 34.Sherwani, S. I., Khan, H. A., Ekhzaimy, A., Masood, A. & Sakharkar, M. K. Significance of HbA1c test in diagnosis and prognosis of diabetic patients. Biomark. Insights11, 95–104 (2016). 10.4137/BMI.S38440 [DOI] [PMC free article] [PubMed] [Google Scholar]
- 35.Yin, P., Wang, Y., Yang, L., Sui, J. & Liu, Y. Hypoglycemic effects in alloxan-induced diabetic rats of the phenolic extract from mongolian oak cups enriched in ellagic acid, kaempferol and their derivatives. Molecules23, 5 (2018). 10.3390/molecules23051046 [DOI] [PMC free article] [PubMed] [Google Scholar]
- 36.Aloulou, A. et al. Hypoglycemic and antilipidemic properties of kombucha tea in alloxan-induced diabetic rats. BMC Complement. Altern. Med.12(1), 1–9 (2012). 10.1186/1472-6882-12-63 [DOI] [PMC free article] [PubMed] [Google Scholar]
- 37.Wang, C. et al. Andrographolide regulates H3 histone lactylation by interfering with p300 to alleviate aortic valve calcification. Br. J. Pharmacol.181(12), 1843–1856 (2024). 10.1111/bph.16332 [DOI] [PubMed] [Google Scholar]
- 38.Chen, L. et al. HPDA/Zn as a CREB inhibitor for ultrasound imaging and stabilization of atherosclerosis plaque. Chin. J. Chem.41(2), 199–206 (2023). 10.1002/cjoc.202200406 [DOI] [Google Scholar]
- 39.Banda, M., Nyirenda, J., Muzandu, K., Sijumbila, G. & Mudenda, S. Antihyperglycemic and antihyperlipidemic effects of aqueous extracts of Lannea edulis in alloxan-induced diabetic rats. Front. Pharmacol.9, 1099 (2018). 10.3389/fphar.2018.01099 [DOI] [PMC free article] [PubMed] [Google Scholar]
- 40.Zhang, Y., Wang, M., Dong, H., Yu, X. & Zhang, J. Anti-hypoglycemic and hepatocyte-protective effects of hyperoside from Zanthoxylum bungeanum leaves in mice with high-carbohydrate/high-fat diet and alloxan-induced diabetes. Int. J. Mol. Med.41(1), 77–86 (2018). [DOI] [PMC free article] [PubMed] [Google Scholar]
- 41.Bagheri, S. et al. The effects of pomegranate peel extract on the gene expressions of antioxidant enzymes in a rat model of alloxan-induced diabetes. Arch. Physiol. Biochem.129(4), 870–878 (2023). 10.1080/13813455.2021.1877308 [DOI] [PubMed] [Google Scholar]
- 42.Tsalamandris, S. et al. The role of inflammation in diabetes: Current concepts and future perspectives. Eur. Cardiol.14(1), 50–59 (2019). 10.15420/ecr.2018.33.1 [DOI] [PMC free article] [PubMed] [Google Scholar]
- 43.Malik, M. et al. Amelioration of hyperglycaemia and modulation of pro-inflammatory cytokines by Tamarix gallica fractions in alloxan induced diabetic rats. Arch. Physiol. Biochem.128(6), 1666–1675 (2022). 10.1080/13813455.2020.1788099 [DOI] [PubMed] [Google Scholar]
- 44.Suryavanshi, S. V. & Kulkarni, Y. A. NF-κβ: A potential target in the management of vascular complications of diabetes. Front. Pharmacol.8, 1 (2017). 10.3389/fphar.2017.00798 [DOI] [PMC free article] [PubMed] [Google Scholar]
- 45.Novoselova, E. G. et al. Peroxiredoxin 6 attenuates alloxan-induced type 1 diabetes mellitus in mice and cytokine-induced cytotoxicity in RIN-m5F beta cells. J. Diabetes Res.2020, 7523892 (2020). 10.1155/2020/7523892 [DOI] [PMC free article] [PubMed] [Google Scholar]
- 46.Kim, H. J. et al. Prevention of oxidative stress-induced pancreatic beta cell damage by Broussonetia Kazinoki siebold fruit extract via the ERK-Nox4 pathway. Antioxidants9, 5 (2020). [DOI] [PMC free article] [PubMed] [Google Scholar]
- 47.Simó-Servat, O., Hernández, C. & Simó, R. Diabetic retinopathy in the context of patients with diabetes. Ophthalmic Res.62(4), 211–217 (2019). 10.1159/000499541 [DOI] [PubMed] [Google Scholar]
- 48.Ramadan, B. K., Schaalan, M. F. & Tolba, A. M. Hypoglycemic and pancreatic protective effects of Portulaca oleracea extract in alloxan induced diabetic rats. BMC Complement. Altern. Med.17(1), 37 (2017). 10.1186/s12906-016-1530-1 [DOI] [PMC free article] [PubMed] [Google Scholar]
- 49.Lenzen, S. The mechanisms of alloxan- and streptozotocin-induced diabetes. Diabetologia51(2), 216–226 (2008). 10.1007/s00125-007-0886-7 [DOI] [PubMed] [Google Scholar]
- 50.Omer, A. B. et al. Acemannan ameliorates STZ-activated diabetes by attenuating high glucose via inhibiting inflammatory cytokines and apoptosis pathway. Int. J. Biol. Macromol.253, 127127 (2023). 10.1016/j.ijbiomac.2023.127127 [DOI] [PubMed] [Google Scholar]
- 51.Kazmi, I. et al. Influence of rosiridin on streptozotocin-induced diabetes in rodents through endogenous antioxidants-inflammatory cytokines pathway and molecular docking study. J. Biomol. Struct. Dyn.1, 1–16 (2023). 10.1080/07391102.2023.2282738 [DOI] [PubMed] [Google Scholar]
- 52.Altayb, H. N., Yassin, N. F., Hosawi, S. & Kazmi, I. In-vitro and in-silico antibacterial activity of Azadirachta indica (Neem), methanolic extract, and identification of Beta.d-Mannofuranoside as a promising antibacterial agent. BMC Plant Biol.22(1), 262 (2022). 10.1186/s12870-022-03650-5 [DOI] [PMC free article] [PubMed] [Google Scholar]
- 53.Amrhein, S., Oelmeier, S. A., Dismer, F. & Hubbuch, J. Molecular dynamics simulations approach for the characterization of peptides with respect to hydrophobicity. J. Phys. Chem. B118(7), 1707–1714 (2014). 10.1021/jp407390f [DOI] [PubMed] [Google Scholar]
- 54.Fu, Y., Zhao, J. & Chen, Z. Insights into the molecular mechanisms of protein-ligand interactions by molecular docking and molecular dynamics simulation: A case of oligopeptide binding protein. Comput. Math. Methods Med.2018, 3502514 (2018). 10.1155/2018/3502514 [DOI] [PMC free article] [PubMed] [Google Scholar]
- 55.Wu, N. et al. Elucidation of protein–ligand interactions by multiple trajectory analysis methods. Phys. Chem. Chem. Phys.26(8), 6903–6915 (2024). 10.1039/D3CP03492E [DOI] [PubMed] [Google Scholar]
- 56.Paşayeva, L. et al. Evaluation of the chemical composition, antioxidant and antidiabetic activity of rhaponticoides iconiensis flowers: Effects on key enzymes linked to type 2 diabetes in vitro, in silico and on alloxan-induced diabetic rats in vivo. Antioxidants11(11), 2284 (2022). 10.3390/antiox11112284 [DOI] [PMC free article] [PubMed] [Google Scholar]
- 57.Percie du Sert, N. et al. Reporting animal research: Explanation and elaboration for the ARRIVE guidelines 2.0. PLoS Biol.18(7), e3000411 (2020). 10.1371/journal.pbio.3000411 [DOI] [PMC free article] [PubMed] [Google Scholar]
- 58.Matsuura, Y. et al. Altered glucose metabolism and hypoxic response in alloxan-induced diabetic atherosclerosis in rabbits. PLoS ONE12(4), e0175976 (2017). 10.1371/journal.pone.0175976 [DOI] [PMC free article] [PubMed] [Google Scholar]
- 59.Das, K. K. et al. Hypoglycemic activity of curcumin synthetic analogues in alloxan-induced diabetic rats. J. Enzyme Inhib. Med. Chem.31(1), 99–105 (2016). 10.3109/14756366.2015.1004061 [DOI] [PubMed] [Google Scholar]
- 60.Ahrén, B. & Sundkvist, G. Long-term effects of alloxan in mice. Int. J. Pancreatol.17(2), 197–201 (1995). 10.1007/BF02788539 [DOI] [PubMed] [Google Scholar]
- 61.Singh, H. et al. Protective role of Phyllanthus fraternus in alloxan-induced diabetes in rats. J. Ayurveda Integr. Med.11(4), 391–398 (2020). 10.1016/j.jaim.2019.09.008 [DOI] [PMC free article] [PubMed] [Google Scholar]
- 62.Kondo, N. et al. Simple method for determination of A1c-type glycated hemoglobin(s) in rats using high performance liquid chromatography. J. Pharmacol. Methods21(3), 211–221 (1989). 10.1016/0160-5402(89)90055-7 [DOI] [PubMed] [Google Scholar]
- 63.Gupta, R. K. et al. Hypoglycemic and antidiabetic effect of ethanolic extract of leaves of Annona squamosa L. in experimental animals. J. Ethnopharmacol.99(1), 75–81 (2005). 10.1016/j.jep.2005.01.048 [DOI] [PubMed] [Google Scholar]
- 64.Soni, L. K. et al. In vitro and in vivo antidiabetic activity of isolated fraction of Prosopis cineraria against streptozotocin-induced experimental diabetes: A mechanistic study. Biomed. Pharmacother.108, 1015–1021 (2018). 10.1016/j.biopha.2018.09.099 [DOI] [PubMed] [Google Scholar]
- 65.Parvin, R., Pande, S. V. & Venkitasubramanian, T. A. On the colorimetric biuret method of protein determination. Anal. Biochem.12, 219–229 (1965). 10.1016/0003-2697(65)90085-0 [DOI] [PubMed] [Google Scholar]
- 66.Sun, Y., Oberley, L. W. & Li, Y. A simple method for clinical assay of superoxide dismutase. Clin. Chem.34(3), 497–500 (1988). 10.1093/clinchem/34.3.497 [DOI] [PubMed] [Google Scholar]
- 67.Pari, L. & Murugan, P. Tetrahydrocurcumin prevents brain lipid peroxidation in streptozotocin-induced diabetic rats. J. Med. Food10(2), 323–329 (2007). 10.1089/jmf.2006.058 [DOI] [PubMed] [Google Scholar]
- 68.Jiang, Z., Han, X., Zhao, C., Wang, S. & Tang, X. Recent advance in biological responsive nanomaterials for biosensing and molecular imaging application. Int. J. Mol. Sci.23(3), 1923 (2022). 10.3390/ijms23031923 [DOI] [PMC free article] [PubMed] [Google Scholar]
- 69.Bera, T. K., De, D., Chatterjee, K., Ali, K. M. & Ghosh, D. Effect of Diashis, a polyherbal formulation, in streptozotocin-induced diabetic male albino rats. Int. J. Ayurveda Res.1(1), 18–24 (2010). 10.4103/0974-7788.59939 [DOI] [PMC free article] [PubMed] [Google Scholar]
- 70.Oyenihi, O. R., Cerf, M. E., Matsabisa, M. G., Brooks, N. L. & Oguntibeju, O. O. Effect of kolaviron on islet dynamics in diabetic rats. Saudi J. Biol. Sci.29(1), 324–330 (2022). 10.1016/j.sjbs.2021.08.095 [DOI] [PMC free article] [PubMed] [Google Scholar]
- 71.Oyenihi, O. R. et al. Reactive oxygen species: Key players in the anticancer effects of apigenin? J. Food Biochem.46(2), e14060 (2022). 10.1111/jfbc.14060 [DOI] [PubMed] [Google Scholar]
- 72.Madiraju, C. et al. A unique multiplex ELISA to profile growth factors and cytokines in cerebrospinal fluid. Methods Mol. Biol.2612, 157–168 (2023). 10.1007/978-1-0716-2903-1_12 [DOI] [PubMed] [Google Scholar]
- 73.Jafari Anarkooli, I., Sankian, M., Ahmadpour, S., Varasteh, A. R. & Haghir, H. Evaluation of Bcl-2 family gene expression and Caspase-3 activity in hippocampus STZ-induced diabetic rats. Exp. Diabetes Res.2008, 638467 (2008). 10.1155/2008/638467 [DOI] [PMC free article] [PubMed] [Google Scholar]
- 74.Bowers, K. J. et al. Scalable algorithms for molecular dynamics simulations on commodity clusters. In Proc. 2006 ACM/IEEE Conference on Supercomputing (2006).
- 75.Chow, E. et al. Desmond performance on a cluster of multicore processors. In DE Shaw Research Technical Report DESRES/TR—2008-01 (2008).
- 76.Martyna, G. J., Tobias, D. J. & Klein, M. L. Constant pressure molecular dynamics algorithms. J. Chem. Phys.101(5), 4177–4189 (1994). 10.1063/1.467468 [DOI] [Google Scholar]
- 77.Mukund, V., Behera, S. K., Alam, A. & Nagaraju, G. P. Molecular docking analysis of nuclear factor-κB and genistein interaction in the context of breast cancer. Bioinformation15(1), 11–17 (2019). 10.6026/97320630015011 [DOI] [PMC free article] [PubMed] [Google Scholar]
Associated Data
This section collects any data citations, data availability statements, or supplementary materials included in this article.
Data Availability Statement
The datasets generated during and/or analysed during the current study are available from the corresponding author on reasonable request.


