Abstract
With the exponential progress in the field of cheminformatics, the conventional modeling approaches have so far been to employ supervised and unsupervised machine learning (ML) and deep learning models, utilizing the standard molecular descriptors, which represent the structural, physicochemical, and electronic properties of a particular compound. Deviating from the conventional approach, in this investigation, we have employed the classification Read-Across Structure-Activity Relationship (c-RASAR), which involves the amalgamation of the concepts of classification-based quantitative structure-activity relationship (QSAR) and Read-Across to incorporate Read-Across-derived similarity and error-based descriptors into a statistical and machine learning modeling framework. ML models developed from these RASAR descriptors use similarity-based information from the close source neighbors of a particular query compound. We have employed different classification modeling algorithms on the selected QSAR and RASAR descriptors to develop predictive models for efficient prediction of query compounds’ hepatotoxicity. The predictivity of each of these models was evaluated on a large number of test set compounds. The best-performing model was also used to screen a true external data set. The concepts of explainable AI (XAI) coupled with Read-Across were used to interpret the contributions of the RASAR descriptors in the best c-RASAR model and to explain the chemical diversity in the dataset. The application of various unsupervised dimensionality reduction techniques like t-SNE and UMAP and the supervised ARKA framework showed the usefulness of the RASAR descriptors over the selected QSAR descriptors in their ability to group similar compounds, enhancing the modelability of the dataset and efficiently identifying activity cliffs. Furthermore, the activity cliffs were also identified from Read-Across by observing the nature of compounds constituting the nearest neighbors for a particular query compound. On comparing our simple linear c-RASAR model with the previously reported models developed using the same dataset derived from the US FDA Orange Book (https://www.accessdata.fda.gov/scripts/cder/ob/index.cfm), it was observed that our model is simple, reproducible, transferable, and highly predictive. The performance of the LDA c-RASAR model on the true external set supersedes that of the previously reported work. Therefore, the present simple LDA c-RASAR model can efficiently be used to predict the hepatotoxicity of query chemicals.
Keywords: Hepatotoxicity, c-RASAR, ARKA, Banerjee–Roy coefficient, Activity cliffs, Dimensionality reduction
Subject terms: Computational biology and bioinformatics, Risk factors
Introduction
The liver is the junction for a wide array of biochemical pathways responsible for the normal functioning of the human body. It is the major organ that helps to detoxify harmful substances present in the human body. Thus, it is essential to maintain proper health and functioning of this vital organ inside the living system. However, with the change in human lifestyle and the accumulation of various harmful chemicals in and around us that invariably affect our well-being, the liver is constantly being exposed to these harmful chemicals resulting in damage. It is estimated that the liver is exposed to more than 1100 such chemicals daily1–3. One of the primary causes of liver injuries is the use and over-use of certain drugs leading to Drug-Induced Liver Injury (DILI). These drug molecules alter the level of hepatic enzymes, causing serious liver injuries like cirrhosis1. Additionally, some drugs may indirectly affect the liver by altering the lipid metabolism, leading to steatosis. A common mechanism of DILI involves the histamine-mediated pathway, which is most commonly observed in the case of antitubercular drugs directly or indirectly (via the metabolites), leading to hepatic cell injury. Another common mechanism involving non-steroidal anti-inflammatory drugs (NSAIDs) is the hepatotoxic activity of the metabolites from the CYP450 enzyme that degrades protein structure, enhances lipid peroxidation, and inhibits ATP and bile acid synthesis. When combined with liver-specific proteins, a third mechanism is attributed to the drugs and their metabolites exhibiting antigenic properties. This triggers a variety of immune responses that ultimately lead to damage to hepatocytes4. In general, two types of DILI are observed: intrinsic DILI and idiosyncratic DILI, where the former is dose-dependent and can be predicted, while the latter develops even at therapeutic doses and affects only a limited number of people. Experimental evaluation of the hepatotoxic potential of drugs and drug-like molecules is tedious, involves ethical considerations, and is typically expensive. Therefore, this work has reported how the hepatotoxic potential of drugs and drug-like molecules can be predicted using computational models. Although such evaluation has already been done previously by different research groups1,5, and their models have been trained using a considerably large number of compounds, their performance on an external validation set (compounds unseen to the model) has been evaluated in most of the cases using a limited number of compounds that do not sufficiently justify the predictivity, universality, and reliability of their models.
In silico prediction approaches are a fast-growing domain due to their advantages in terms of time and economic considerations since they are fast, reliable, reproducible, and economically viable6. Due to these associated factors, the Organisation for Economic Co-operation and Development (OECD) (https://www.oecd.org/chemicalsafety/risk-assessment/validationofqsarmodels.htm), United States Food and Drug Administration (US FDA) (https://www.fda.gov/) and the United States Environmental Protection Agency (US EPA) (https://www.epa.gov/) encourage the use of in silico approaches for the efficient predictions of activity and/or toxicity profile of compounds. Additionally, chemical regulations like the European Union Registration, Evaluation, Authorisation, and Restriction of Chemicals (EU REACH) accept data generated from computational models7. One of the basic and most commonly used forms of in silico approaches is the Quantitative Structure–Activity Relationship (QSAR). This approach uses compounds’ inherent structural and physicochemical properties and correlates them with the experimental endpoint values already available to train a mathematical model8. This model is used for the endpoint prediction of external compounds that have not been involved in the model development process9–11. Typically, QSAR analysis can be of two broad categories: a regression-based approach, where the endpoint values and the model-derived predictions are in the quantitative scale, and a classification-based approach, where the endpoint values and the model-derived predictions are in the graded scale (i.e., active or inactive). Although this approach is technically and statistically sound, with provisions for efficiently identifying the relative contributions of the structural features to the endpoint of concern, this can be rather inefficient when experimental data are scarce. This is because, to build a statistically reliable model, a traditional QSAR approach should have sufficient data points with known experimental response values for the training phase12. However, this is not always possible since there is a lack of sufficient experimental data in various fields like nanotoxicology and ecotoxicity. Therefore, QSAR is often unsuitable for data gap-filling13,14. This calls for adherence to alternative in silico approaches that either eliminate statistical considerations or resolve statistical problems by enhancing the degree of freedom of mathematical models. While the former can be achieved by adopting non-statistical quantitative Read-Across (q-RA) approaches12, the latter can also be achieved by employing dimensionality reduction techniques like the ARKA framework15. Read-Across is a rather simple approach that takes a particular query compound and identifies its close congeners, in terms of similarity, from a set of source compounds16–18. Predictions are derived by a consensus-based approach using the experimental response values of the close source compounds. Read-Across is based on the principle of similarity, which infers that compounds with similar structural and physicochemical characteristics are most likely to have similar activity values. Since there is no model development involved in Read-Across, it can be efficiently used on small datasets and generate reliable results, thus can be considered as a powerful data-gap filling tool. However, the only drawback that it possesses is that it is very tough to identify the relative quantitative contribution of the features towards the response values. To mitigate the challenges faced by the QSAR and Read-Across approaches, Banerjee and Roy developed a modeling strategy using quantitative and classification-based models employing Read-Across-derived similarity and error-based descriptors and termed this novel approach quantitative/classification Read-Across Structure–Activity Relationship (q-RASAR/c-RASAR)19–21. This approach ensures to encapsulate the concepts of Read-Across into a mathematical modeling framework, which is simple, reproducible, transferable, and interpretable. This not only aids in the explainability of the Read-Across hypothesis but also reduces the problems associated with small dataset modeling since, in most of the cases, the q-RASAR/c-RASAR models possess a lower number of modeling descriptors as compared to the corresponding QSAR models. Luechtefeld et al.22 were the first to develop classification RASAR models using only the similarity values to the closest positive and negative source compounds, while Banerjee and Roy19–21,23,24 were the first to develop regression-based RASAR models computing a larger number of similarity and error-based descriptors. Furthermore, as evident from the previous studies20,23–27, there has been an enhancement in the external predictivity of the q-RASAR/c-RASAR models as compared to their corresponding conventional QSAR models. It is to be noted that this q-RASAR/c-RASAR approach is independent of the type of QSAR descriptors selected and the modeling algorithm employed since the basic theory behind this approach is the computation of the Read-Across-derived similarity and error-based descriptors from the available set of chemical information, which can be subjected to a variety of modeling algorithms. Previous studies20,23–27 have shown that q-RASAR/c-RASAR models have better predictive ability than the corresponding QSAR models. Additionally, it has been observed, in most cases, that a linear q-RASAR/c-RASAR model provides better prediction performance than other ML q-RASAR/c-RASAR models. The current study presents the application of c-RASAR modeling of hepatoxicity and compares these models with the corresponding QSAR and previously reported hepatotoxicity models. The quality of the final RASAR models depends on the initially chosen set of molecule descriptors. In the present work, we have used 2D structural and physicochemical descriptors to demonstrate the enhancement of external predictivity by using the similarity descriptors in the c-RASAR models with the possible explanation of the similarity issues by giving specific examples. Using other sets of descriptors and/or fingerprints will generate RASAR models of different quality, which is out of the scope of the present study.
Materials and methods
Collection of hepatotoxicity data
A curated dataset of 1274 data points, containing categorical experimental data (active = 1 and inactive = 0) collected from the work of Liew et al.1, is provided in Supplementary Material SI-1. This dataset was prepared from the US FDA Orange Book (https://www.accessdata.fda.gov/scripts/cder/ob/index.cfm) containing a list of available drugs in the market. The data for adverse hepatic effects was obtained from Micromedex Healthcare Series (https://onesearch.library.utoronto.ca/micromedex-healthcare-series). The level of adverse effects were grouped into different classes. Level 1 includes the transient and asymptomatic abnormalities of the functioning liver. Level 2 includes hyperbilirubinaemia and liver function abnormalities. Level 3 includes cholestasis, jaundice, and hepatitis. Level 4 includes fulminant hepatitis and liver failure. Lastly, level 5 includes death. If a drug molecule exhibited any level of hepatic adverse effects, it was flagged as positive (or 1). Similarly, the drug molecules that do not associate themselves with any level of hepatic adverse effects were marked as negative (or 0).
Structural representation, descriptor computation, and data pre-treatment
SMILES is a unique representation of a molecular structure that enables human readability using ASCII strings28,29. These strings were used to represent the chemical structures in Marvin (https://chemaxon.com/marvin). Explicit hydrogens were added to all the structures, relevant rings were aromatized, the structures were cleaned, and the structures were saved as a single .sdf file. This file was considered for the 0-2D descriptor computation using alvaDesc30. Various classes of descriptors like constitutional indices, ring descriptors, molecular properties, functional group counts, atom-centered fragments, atom-type E-state, 2D atom pairs, connectivity indices, and ETA indices were computed, making a total count of 2400 descriptors. These classes of descriptors were selected for their easy interpretability and good performance in modeling various endpoints, as evidenced by our previous studies31,32. Data pre-treatment—a process of removing descriptors of low variance, high intercorrelation, and missing data—was performed to reduce the descriptor pool. It is essential to note that we have deliberately incorporated global descriptors like LOGP99 (Wildmann-Crippen octanol–water partition coefficient) and MW (Molecular weight) in the final descriptor pool. However, the Pre-treatment analysis initially removed them. This is associated with a couple of reasons; firstly, these global descriptors can capture the overall lipophilicity and size of the target compounds, which may be a limiting factor for a particular biological process, and secondly, they can influence the pharmacokinetic and pharmacodynamic properties of drugs that result in hepatotoxicity.
Dataset splitting
While developing mathematical models, we must consider the predictive performance of the developed model on an external set of data. We have, therefore, divided the dataset into training and test sets. The training set was used to build the model, while the test set was used to evaluate the predictive power of the developed model on unseen data. Initially, the actives and inactives of the dataset were separated, depicting two different classes. To each class of data, k-medoid clustering was applied to divide the dataset into training and test data points. The training data points of each class were merged to generate the complete training set. Similarly, the test data points of each class were merged to generate the complete test set. The resultant training dataset had 643 data points (382 actives and 261 inactives), while the test set had 631 data points (377 actives and 254 inactives). We did not opt for class balancing steps because the training and test sets are not highly imbalanced.
Feature selection
Feature selection is one of the key aspects of developing meaningful QSAR models. This process involves the efficient identification of the features that are found to contribute significantly to the endpoint being modeled. In this investigation, we have employed the most discriminating feature selection algorithm (using a molecular spectrum analysis) on the training set to identify the essential features33,34. The training set descriptor matrix was normalized to the uniform range from 0 to 1. The mean values of a particular descriptor in the active and inactive classes were computed to observe the difference in the mean values of a descriptor in two different classes. The absolute difference of the mean values of a descriptor in the active and inactive classes was computed. The descriptors having large absolute difference values can be termed as important descriptors. In this work, we have identified 29 such QSAR descriptors that significantly contribute to the hepatotoxicity endpoint. This process of feature selection using the most discriminating feature selection approach was carried out by the tool MDF_Identifier-v1.0 available from https://sites.google.com/jadavpuruniversity.in/dtc-lab-software/home#h.obtkiouqoqut.
Development of machine learning (ML) QSAR models
After the selection of the essential features, the descriptor matrices of the training and test sets were standardized using the tool Scale_v1.0 available from https://sites.google.com/jadavpuruniversity.in/dtc-lab-software/home#h.yjgrgvblsskr. These standardized training and test sets were used for the development of various Machine Learning models like Linear Discriminant Analysis (LDA)35, Random Forest classifier (RF)36, Support Vector Machine classifier (SVM)37, and Logistic Regression (LR)38. A Python-based tool Machine Learning Classification-v1.0 (available from https://sites.google.com/jadavpuruniversity.in/dtc-lab-software/home/machine-learning-model-development-guis) was used for the development of ML models. A grid search based on a five-fold cross-validation approach was adhered to for the optimization of the hyperparameters associated with the different ML models. The models were internally and externally validated to estimate their robustness and performance on unseen data.
Selection of the best similarity measure and computation of RASAR descriptors
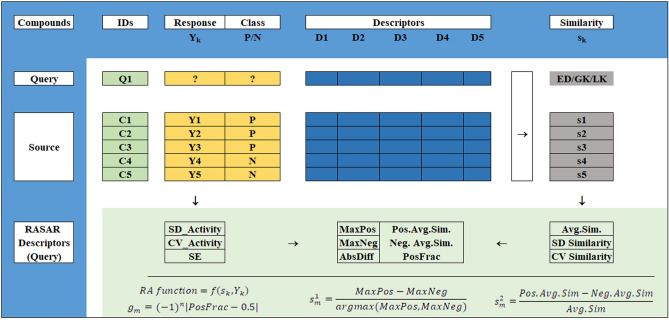
Unlike QSAR descriptors, RASAR descriptors of a query compound (from either the training set or the test set) are computed considering its close congeners in the source set (training set). For the RASAR descriptors of the training set compounds, a “leave-same-out” approach is used to avoid consideration of identical compounds in the list of close source congeners and to obviate any bias in the RASAR descriptor computation23–27. One of the prerequisites for the computation of RASAR descriptors is to identify the best similarity measure and their associated optimized hyperparameters settings. Since the dataset is not “small”, we decided to proceed with the default hyperparameter setting (i.e., σ = 1, γ = 1, no. of close source compounds = 10) as we can expect that the source set is sufficiently large enough to identify ten close source neighbors for a particular query compound. However, the best similarity measure selection was based on the Read-Across predictions of validation sets, obtained from the training set’s division. Among the three different similarity measures (i.e., Euclidean distance-based similarity, Gaussian Kernel similarity, and Laplacian Kernel similarity) provided by Read-Across-v4.2.1 (https://sites.google.com/jadavpuruniversity.in/dtc-lab-software/home#h.cork96bbi7bt), the similarity measure generating the highest Matthews Correlation Coefficient (MCC) and Cohen’s kappa (Ckappa) values for the validation sets (which are a part of the training set and different from the test set) was chosen as the best similarity measure. This similarity measure, along with the corresponding default setting of the associated hyperparameters, was used to compute the RASAR descriptors for the training and test sets using the tool RASAR-Desc-Calc-v3.0.3, available from https://sites.google.com/jadavpuruniversity.in/dtc-lab-software/home#h.x3k58bv4frb9. This involved the training and test set files, along with the selected QSAR descriptors as inputs, and generated 18 different similarity and error-based RASAR descriptors (Table S1 of the Supplementary Material SI-2). It is to be kept in mind that we have not considered the descriptors SD_Activity, CVact, and SE since they use quantitative response values of the close source compounds that are not applicable for modeling graded data20. Therefore, our final RASAR descriptor pool consists of 15 different similarity and error-based descriptors. An overall scheme for the genesis and calculation of the RASAR descriptors has been provided in Fig. 1.
Fig. 1.
Scheme for the genesis and computation of the RASAR descriptors.
Feature selection of the RASAR descriptors
After the computation of the 15 different RASAR descriptors for the training and test sets, a feature selection algorithm was employed to select the essential features and develop meaningful models. In most of the previous studies14,19,23–26, data fusion was performed to merge the initially selected QSAR descriptors and the computed RASAR descriptors to obtain a complete descriptor pool, on which feature selection algorithms were employed. This step is essential for modeling quantitative endpoints generating regression-based models as explained by Banerjee and Roy23. However, for graded endpoint values, this step is not required, and feature selection and model development should be done exclusively using the RASAR descriptors20. Selection of the essential RASAR descriptors was based on the most discriminating feature selection algorithm, whose algorithm has already been mentioned previously, and the authors selected eight different RASAR descriptors to develop mathematical models. Additionally, a univariate model was also developed to show the predictive potential and efficacy of the RASAR descriptors, whereby a single RASAR descriptor could generate a model for a considerably large dataset.
Development of ML-based c-RASAR models
Similar to the development of ML-QSAR models, the selected RASAR descriptors from the training and test sets underwent standardization using the tool Scale_v1.0 available from https://sites.google.com/jadavpuruniversity.in/dtc-lab-software/home#h.yjgrgvblsskr. These standardized RASAR descriptor matrices for the training and test sets were taken as inputs in the Python-based tool Machine Learning Classification-v1.0 (available from https://sites.google.com/jadavpuruniversity.in/dtc-lab-software/home/machine-learning-model-development-guis), that uses Scikit-learn libraries to generate ML models. Linear Discriminant Analysis (LDA)35, Random Forest classifier (RF)36, Support Vector Machine classifier (SVM)37, and Logistic Regression (LR)38 c-RASAR models were developed, which were validated internally and externally using different types of classification-based validation metrics. A univariate LDA c-RASAR model was also developed, and the descriptor had the highest discrimination among the active and inactive classes. The performance of all the ML c-RASAR models was compared with the ML QSAR models in terms of their external predictive abilities.
External set prediction—a step towards testing the generalizability of our model
Applying the developed model to a true external set greatly enhances the model’s generalizability. In the present study, we have collected a true external set from the works of He et al.39. This external set is a compilation of three smaller datasets from Ai et al.40, Zhang et al.41, and Kotsampasakou et al.42. We have performed a duplicate analysis of the external set with our training set compounds and removed the duplicates from our external set. The final external set consists of 184 external data points with known experimental actives and inactives. The structures were drawn, explicit hydrogens were added, relevant rings were aromatized and the structures were cleaned. The previously selected QSAR descriptors were calculated using alvaDesc30. The RASAR descriptors were calculated using RASAR-Desc-Calc-v3.0.3, taking the training set file of the present study as the source compounds and the external set file as the query compounds. After the calculation of the RASAR descriptors, only the selected RASAR descriptors that appeared in our models were taken. The predictions were performed using the best ML algorithm for the c-RASAR models, and the predictions were compared with the models of He et al. to diagnose the model most efficiently identifying hepatotoxic compounds.
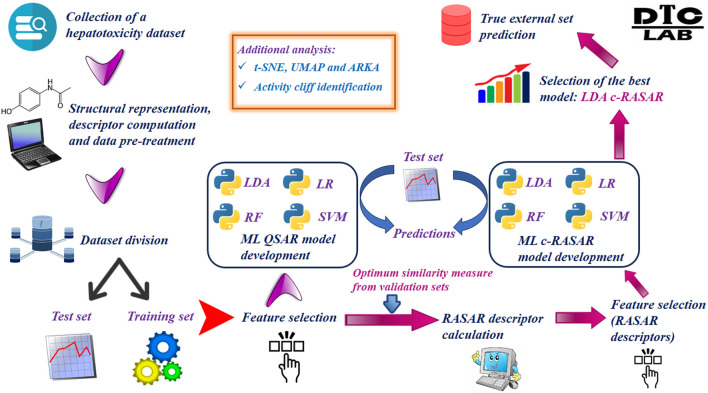
The entire workflow of this modeling work has been represented pictorially in Fig. 2.
Fig. 2.
Workflow representing the development and validation of the c-RASAR models.
Results and discussion
Analysis of the chemical diversity of the data set
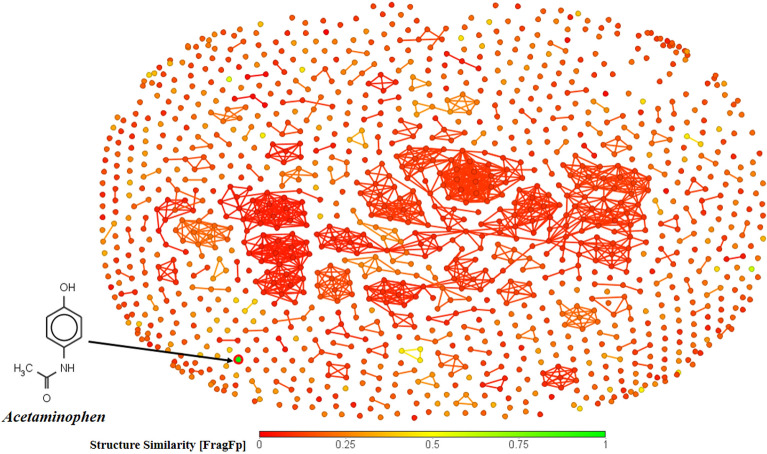
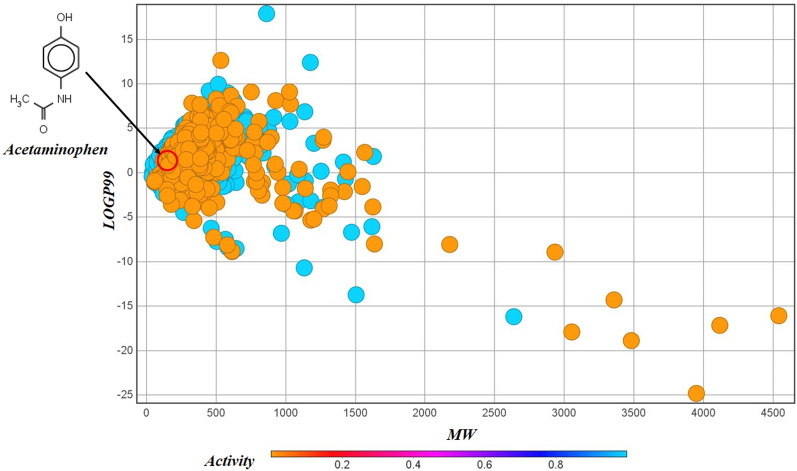
The chemical diversity plot presents an analysis to explore the structural nature and similarity of the compounds constituting our dataset. We have used the software DataWarrior (https://openmolecules.org/datawarrior/) to generate this plot for the chemical diversity analysis. The plot (Fig. 3) represents the structural similarity (based on substructure fragment dictionary-based binary fingerprint FragFp) of the dataset compounds with a well-known hepatotoxic compound—acetaminophen (paracetamol) as the reference43. The color coding of the data points reflects the similarity levels, i.e., green for highly similar compounds, yellow for moderately similar compounds, and red for highly dissimilar compounds (with respect to the reference compound selected). From this plot, it is evident that the similarity levels of most of the data points are quite low, which makes this dataset highly diverse, and this poses a challenge to developing mathematical models. A later section in this paper infers that the low levels of similarity are the reason for the incorrect prediction for acetaminophen, which is supported by the chemical diversity analysis in Fig. 3. Additionally, we have developed a scatter plot of the o/w partition coefficient (LOGP99) and molecular weight (MW) (Fig. 4) that also demonstrates chemical diversity based on physicochemical properties and observed that the active and inactive compounds appear in the same chemical space, which adds to another reason why modeling of such a dataset can pose a lot of challenges.
Fig. 3.
Chemical Diversity analysis representing the diversity of the compounds in our dataset (the structure of a reference compound acetaminophen is shown).
Fig. 4.
A chemical diversity plot of LOGP99 vs MW.
Selection of the important QSAR descriptors
From the most discriminating feature selection algorithm, we identified 27 different QSAR descriptors with absolute mean difference values > 0.03. On analyzing the chemical information these features encode, we observed that all of them were structural descriptors, and there was a clear absence of physicochemical and global descriptors. However, MW and LOGP99 are some of the most common and widely used physicochemical features, but our initial model-independent feature selection process only identified structural features in this study. We have, therefore, deliberately incorporated the descriptors LOGP99 and MW that represent the o/w partition coefficient and the molecular weights of compounds. The revised number of features was now 29, which was subjected to various ML-based classification QSAR modeling. All 29 descriptors and their significance have been represented in Table S2 and Fig. S1 of the Supplementary Material SI-2.
Results of the classification-based QSAR models
The different validation metrics computed from the models developed using a variety of ML algorithms have been shown in Table 1, and the corresponding optimized hyperparameter settings have been reported in Table S3 of the Supplementary Material SI-2. It is evident that the linear modeling framework LDA and the non-linear LR have moderate classifiability of the training and test set compounds, while other non-linear models like RF and SVM exhibit poor performance, especially when we observe the MCC and Ckappa values of the training and test sets. This poses the challenging question of whether the promising c-RASAR approach can develop models with better quality and efficient classifiability than these traditional QSAR models. The validation metrics suggest that ML models based on conventional QSAR descriptors cannot provide sufficient classifiability.
Table 1.
Results of the different ML-based QSAR and c-RASAR models.
| Set | Models | Accuracy | Precision | Recall | F1 score | MCC | Ckappa | AUC |
|---|---|---|---|---|---|---|---|---|
| QSAR models | ||||||||
| Training | LDA | 0.68 | 0.70 | 0.80 | 0.75 | 0.32 | 0.32 | 0.73 |
| RF | 0.60 | 0.60 | 1.00 | 0.75 | 0.05 | 0.01 | 0.72 | |
| SVM | 0.59 | 0.59 | 1.00 | 0.75 | 0.00 | 0.00 | 0.82 | |
| LR | 0.68 | 0.68 | 0.88 | 0.76 | 0.30 | 0.28 | 0.73 | |
| Test | LDA | 0.62 | 0.66 | 0.78 | 0.71 | 0.19 | 0.18 | 0.65 |
| RF | 0.60 | 0.60 | 1.00 | 0.75 | 0.00 | 0.00 | 0.66 | |
| SVM | 0.60 | 0.60 | 1.00 | 0.75 | 0.00 | 0.00 | 0.68 | |
| LR | 0.64 | 0.65 | 0.85 | 0.74 | 0.22 | 0.20 | 0.66 | |
| c-RASAR models | ||||||||
| Training | LDA | 0.67 | 0.69 | 0.84 | 0.75 | 0.30 | 0.29 | 0.71 |
| RF | 0.69 | 0.67 | 0.93 | 0.78 | 0.34 | 0.29 | 0.73 | |
| SVM | 0.66 | 0.69 | 0.76 | 0.73 | 0.28 | 0.27 | 0.71 | |
| LR | 0.67 | 0.68 | 0.84 | 0.75 | 0.28 | 0.27 | 0.71 | |
| Test | LDA | 0.67 | 0.70 | 0.78 | 0.74 | 0.29 | 0.29 | 0.7 |
| RF | 0.66 | 0.66 | 0.87 | 0.75 | 0.25 | 0.23 | 0.7 | |
| SVM | 0.64 | 0.69 | 0.73 | 0.71 | 0.25 | 0.25 | 0.69 | |
| LR | 0.66 | 0.69 | 0.79 | 0.73 | 0.27 | 0.27 | 0.71 | |
| Univariate c-RASAR model (gm_class) | ||||||||
| Training | LDA | 0.64 | 0.70 | 0.69 | 0.69 | 0.25 | 0.25 | 0.62 |
| Test | 0.63 | 0.69 | 0.69 | 0.69 | 0.22 | 0.22 | 0.61 | |
We have performed a SHAP analysis of the training set for the best QSAR models (LDA and LR). As evident from Figure S2 in Supplementary Materials SI-2, MW is an essential descriptor in both cases.
Selection of the important c-RASAR descriptors
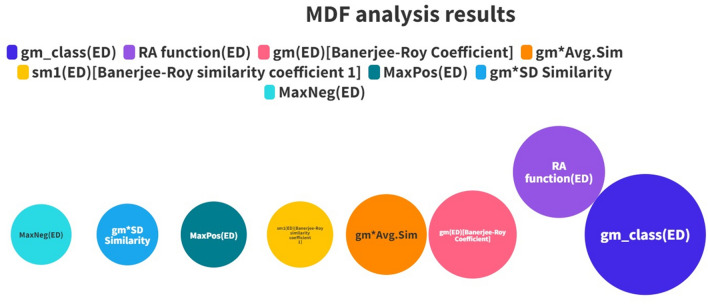
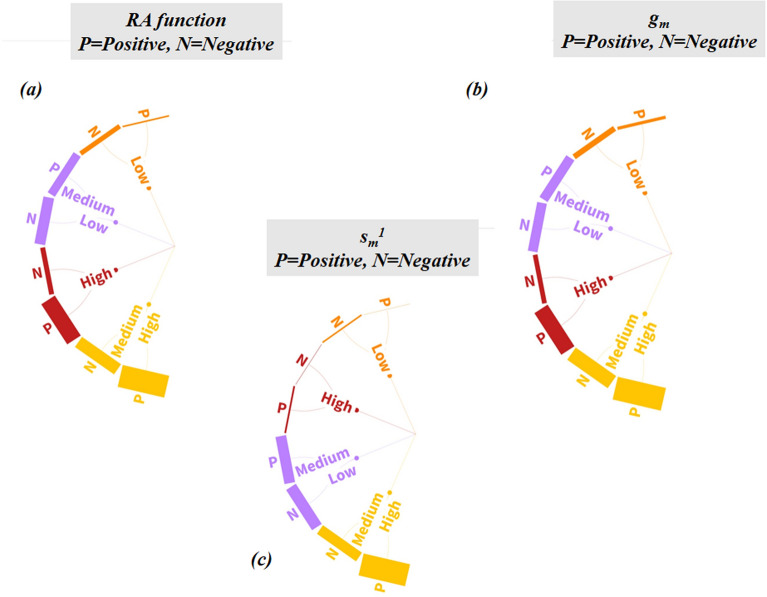
The most discriminating feature selection analysis on the RASAR descriptor matrix helped us to identify the set of essential RASAR descriptors. The descriptors having an absolute difference in the mean values > 0.06 were considered important descriptors. Such descriptors were 8 in number, which included descriptors like RA function, gm, gm_class, gm*Avg.Sim, gm*SD_Similarity, and sm1, the majority of which are represented by the Banerjee-Roy concordance and similarity coefficients and their derived descriptors. It is essential to note that the QSAR models were developed using 29 descriptors, while the c-RASAR models were developed using only eight descriptors. The most discriminating RASAR descriptor, having the highest absolute mean difference value (gm_class), was also used to develop a simple univariate model. The selected RASAR descriptors have been shown pictorially in Fig. 5, and the variations in their values for the first and the last 20 compounds in the training and test sets have been represented in the form of a heat map in Fig. S3 in Supplementary Materials SI-2.
Fig. 5.
List of RASAR descriptors used to develop the c-RASAR models. The bubble diameters represent the importance of the descriptors in terms of discriminating power between the positives and negatives.
Results of the classification-based RASAR (c-RASAR) models
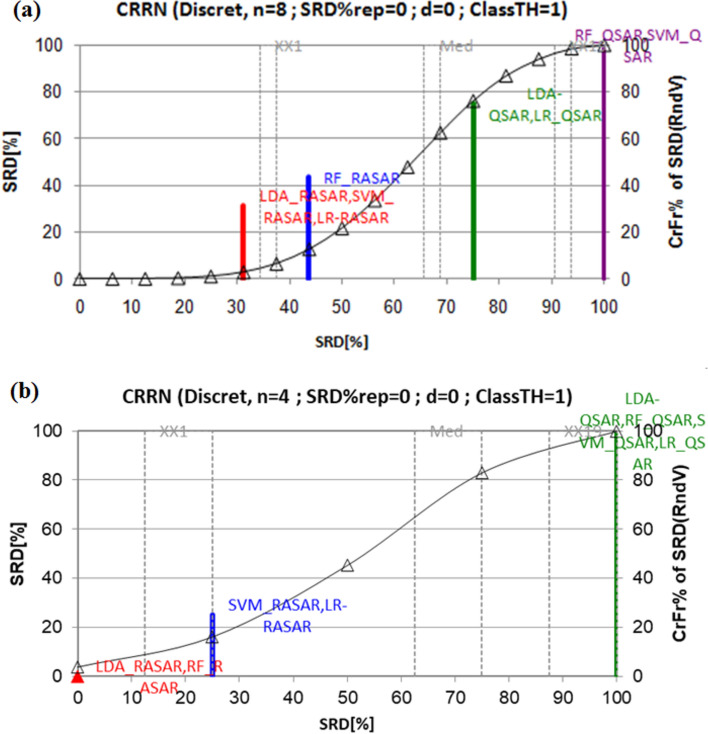
Using the same set of ML modeling algorithms, various c-RASAR models have been developed. The list of various classification-based validation metrics computed for all the different ML c-RASAR models has been reported in Table 1, and the corresponding optimized hyperparameter settings have been reported in Table S3 of Supplementary Material SI-2. As the results show, the LDA and LR models also perform better than the non-linear RF and SVM. Observing the validation metrics values, we can infer that the simplest LDA c-RASAR model provides the best predictivity. Moreover, the performance of all the different ML c-RASAR models on the test set supersedes the predictive performance of even the best ML QSAR model (i.e., LR QSAR). We have additionally shown the enhancement of the external predictive performance of the c-RASAR models using a t-test of the means of different selected metrics of different models (like Accuracy, MCC, Cohen’s kappa, and AUC-ROC for the test set predictions) (Table S4 in Supplementary Materials SI-2) and the Sum of Ranking Differences (SRD) of the competing models44–47 (Fig. 6).
Fig. 6.
Normalized SRD values of different models compared to random ranking based on metrics Accuracy, MCC, Cohen’s kappa, and AUC for LDA, RF, SVM and LR models using the SRD approach for (a) training and test set data, (b) test set data.
The sum of ranking differences (SRD) approach of Prof. Heberger44–47 is an effective method to compare different metrics, processes, models, analytical techniques, etc. in a general manner. We have used this method here to compare the performance of various QSAR and RASAR models considering selected metrics (Accuracy, MCC, Cohen’s kappa, and AUC) of the training and test sets and also separately for the test set. Here, the models to be ranked are placed in the rows, and the metrics are in the columns of an input matrix. The columns are scaled to unit length. Then, the transposed matrix is used for the SRD analysis, taking the maximum row values as the reference. Then, the results of each model are ranked in the order of increasing magnitude. The difference between the rank of the model results and the rank of the standard results (here, row maximum) is then computed. Calculating the sum of absolute values of the differences for all models follows this. A lower value of SRD (close to 0) indicates a better model. The closeness of SRD values indicates the similarity of the models, whereas large variation indicates dissimilarity. A permutation test is used to validate the SRD method, which uses a recursive algorithm to compute the discrete distribution for a small number of objects (n < 14, as in this case) or the normal distribution if the number of objects is large. The theoretical distribution is visualized for random numbers and can be used to identify SRD values for models that are far from being random. The SRD runs were made using the program available from http://aki.ttk.hu/srd/.
The normalized SRD values of different models compared to random ranking based on metrics Accuracy, MCC, Cohen’s kappa, and AUC for LDA, RF, SVM and LR models based on the SRD approach are shown based on training and test set data (Fig. 6a) and based on only test set data (Fig. 6b). Based on Fig. 6a, the order of performance of the models in comparison to the reference (maximum values of the metrics) is (LDA-RASAR, SVM-RASAR, LR-RASAR), RF-RASAR, (LDA-QSAR, LR-QSAR), (RF-QSAR, SVM-QSAR) confirming the superiority of the RASAR models over QSAR models statistically. Based on Fig. 6b, the order is (LDA-RASAR, RF-RASAR), (SVM-RASAR, LR-RASAR), (LDA-QSAR, RF-QSAR, SVM-QSAR, LR-QSAR).
From the above SRD plots, it is evident that the c-RASAR models are much better-performing models than the corresponding QSAR models. Additionally, it should be noted that the QSAR models were developed using 29 descriptors, while the c-RASAR models were developed with just eight descriptors. So, our RASAR models are also statistically more meaningful when enhancing the degree of freedom.
On comparison among the different ML-based c-RASAR models, it can be confirmed that the LDA c-RASAR model was the best performing model for external set predictions, taking the MCC, Ckappa, and AUC as the objective functions. Additionally, a univariate LDA c-RASAR model was also developed using gm_class as the only descriptor (Table 1). This model also proved to be sufficiently predictive, especially in modeling a very diverse dataset and a considerably large number of compounds for a simple univariate model. This reiterates the potential and the predictive power of the similarity and error-based RASAR descriptors even in the case of diverse and less-modelable data points.
Statistics for cross-validation—a measure of the robustness of the developed c-RASAR models
One of the fundamentals for developing statistically reliable models is to perform rigorous cross-validation. This ensures that the inherent quality of the model does not change significantly on the omission of a selected number of data points. In this study, we have rigorously cross-validated all our ML-based c-RASAR models to show their robustness. We have employed 20 times fivefold cross-validation and 1000 times shuffle-split cross-validation to observe the robustness of the models. From the results in Table 2, it can be concluded that all our ML c-RASAR models were statistically very robust, with the LDA c-RASAR model (the model that generates the best predictivity as per Table 1) having the highest degree of robustness as observed from the highest cross-validated accuracy values among all the reported c-RASAR models. Also, the difference in the accuracy and cross-validated accuracy values were the lowest in the case of the LDA c-RASAR model.
Table 2.
Results from the 20 times fivefold cross-validation and 1000 times shuffle-split cross-validation (Training set).
| Models | Accuracy | AccuracyCV (20 times fivefold CV) | AccuracyCV (1000 times shuffle-split CV) |
|---|---|---|---|
| LDA c-RASAR | 0.673 | 0.667 ± 0.004 | 0.665 ± 0.001 |
| RF c-RASAR | 0.689 | 0.660 ± 0.004 | 0.658 ± 0.001 |
| SVM c-RASAR | 0.658 | 0.656 ± 0.004 | 0.655 ± 0.001 |
| LR c-RASAR | 0.667 | 0.661 ± 0.004 | 0.658 ± 0.001 |
± indicates the standard error values.
Analysis of the feature importance in the LDA c-RASAR model
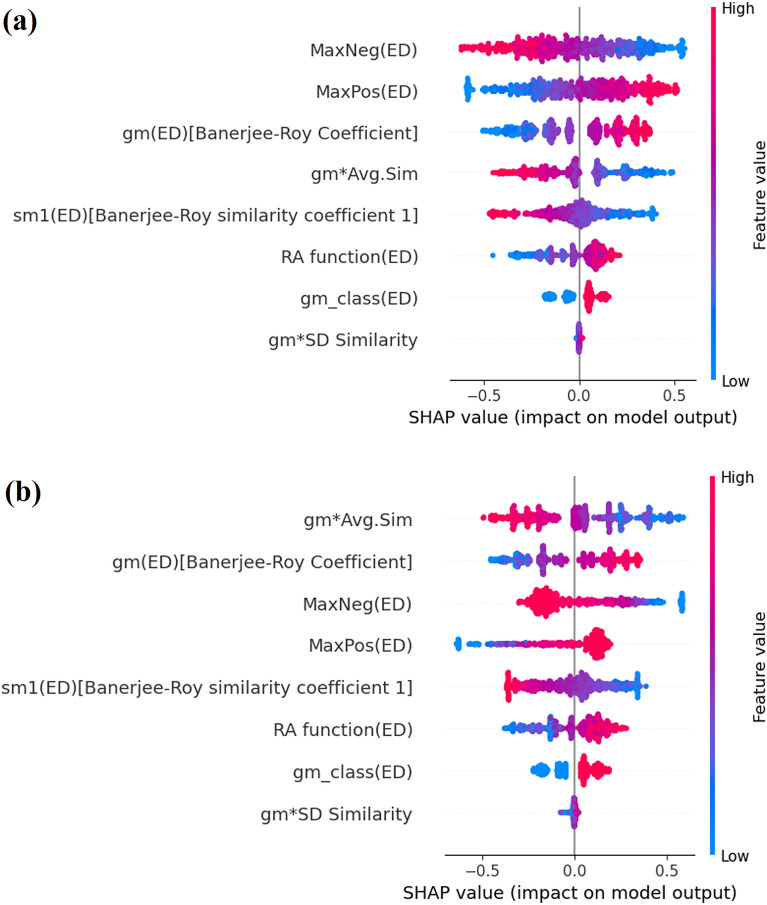
Estimating the relative importance of the modeling features in a modeling framework is essential to understanding the contribution of specific features. Although ML models have been referred to as “black box” many times, the application of explainable AI (XAI)48,49 has enhanced the interpretability of the different ML models. In this context, researchers are now using the SHapley Additive explanation (SHAP) concept to derive feature importance for complex ML models. This is based on the game theory and is an extension of the Local Interpretable Model-agnostic Explanations (LIME) approach. In this work, we have developed SHAP analysis50 plots for the training and test sets (Fig. 7) in the case of the LDA c-RASAR modeling framework to understand the importance of the various RASAR descriptors in the model that encompasses the entire dataset. It should be noted that the first four variables (in the SHAP plots) of the training and test sets are the same; only their order of importance has been altered. This is a common phenomenon where the test set may not exactly replicate the order of importance of the features from the training set. The biggest difference between Figs. 7 and 5 (Bubble plot of the most discriminating features) is that the former is specific for a particular modeling algorithm, while the latter is a feature selection process (based on the discriminatory power of different descriptors) that is model-independent33. Further details on the contributions of these descriptors to the endpoint are given below. Please note that the contributions of the modeling features have been derived as per the LDA c-RASAR model coefficients (Table S5 in Supplementary Materials SI-2).
Fig. 7.
SHAP analysis plots demonstrating the feature importance for (a) training set and (b) test set.
The descriptor RA function is a Read-Across-derived function that ensembles chemical information from the selected QSAR (structural and physicochemical) descriptors. This is similar to a latent variable encoding information of a wide array of descriptors into a single variable. The RA function acts as a resultant vector, being a function of the feature space defined by the selected structural and physicochemical QSAR descriptors. This descriptor contributes positively towards hepatotoxicity, which is obvious since this represents the collective information of all the selected QSAR descriptors. It can be observed that Oxaprozin (520) has a high RA function value, and the experimental response value suggests that it is hepatotoxic. Conversely, compounds like Alclometasone (767) have a low RA function value, and the experimental response value suggests that it is non-hepatotoxic. The descriptor MaxPos represents the similarity value of a query compound to its closest positive/hepatotoxic source compound, and this descriptor contributes positively towards hepatotoxicity. This is because when a query compound has a high level of similarity to a hepatotoxic compound, it is more likely that the query compound has the propensity to show hepatotoxicity. This can be exemplified by a compound Alitretinoin (30) that has a high MaxPos value (the closest neighbor of 30 being Isotretinoin, which is also a retinoic acid derivative and is also hepatotoxic), and the experimental data shows that it is hepatotoxic, while compounds like Mometasone (1084) possess a low MaxPos value and are non-hepatotoxic. The descriptor MaxNeg represents the similarity value of a query compound to its closest negative/non-hepatotoxic source compound. This descriptor exerts a negative contribution since the propensity of a query compound is non-hepatotoxic when it has a high similarity level to a non-hepatotoxic source compound. In the case of Oxamniquine (518), the MaxNeg value is zero (since there is the absence of any non-hepatotoxic compounds among the close source neighbors) and the experimental data infers that it is hepatotoxic, while in the case of Dextrothyroxine (879), the MaxNeg value is high and it is observed to be a non-hepatotoxic compound. The descriptor gm (a.k.a. Banerjee–Roy concordance coefficient) is a concordance measure that indicates the propensity of a query compound to be positive (hepatotoxic) or negative (non-hepatotoxic). This descriptor encodes two different information, firstly is the fraction of the positive compounds among the list of close source neighbors (PosFrac), and the second is considering the similarity levels to the closest positive (MaxPos) and closest negative (MaxNeg) compounds, whichever is higher. In this LDA c-RASAR model, it was observed that gm had a positive contribution towards hepatotoxicity since higher values of MaxPos and PosFrac reflect the propensity of a query compound to be positive. This can be observed in the case of Tetrachloroethylene (682) where the value of gm is high, and it is reported to be a hepatotoxic compound, while Isoproterenol (1010) has a low value of gm, and it is observed to be a non-hepatotoxic compound. The descriptor gm*Avg.Sim is a derived descriptor obtained from the product of the values of gm and Avg.Sim, and this descriptor contributes negatively towards hepatotoxicity. This can be observed in Halazepam (979) for which the value of gm*Avg.Sim is high and the compound is reported to be non-hepatotoxic, while Ethylene dichloride (276) has a low value of gm*Avg.Sim and it is reported that Ethylene dichloride is hepatotoxic. The descriptor gm*SD_Similarity is a derived descriptor obtained from the product of the values of gm and SD_Similarity, and this descriptor contributes positively towards hepatotoxicity. As evident from Cefonicid (122), it is observed that the value of gm*SD_Similarity is high and the compound is observed to be hepatotoxic, while Pramlintide (1153) has a low value of gm*SD_Similarity and it is observed to be non-hepatotoxic. The descriptor sm1 is the Banerjee-Roy similarity coefficient 1 which is computed based on the information of the closest positive and negative compounds. This descriptor contributes negatively towards hepatotoxicity, possibly to penalize gm_class (see below) based on its quantitative values since this descriptor ideally should have a positive contribution (Fig. S4 of Supplementary Material SI-2), and can also be used as a diagnostic measure to estimate the modelability of a dataset. The compound Levoleucovorin (1024) has a high value of sm1 and the experimental data indicate that this compound is non-hepatotoxic. Similarly, Teniposide (675) has a low value of sm1 and it is observed that this compound is hepatotoxic. The descriptor gm_class is a form of gm that excludes the uncertainty in cases where gm is close to or equal to zero, to provide a more deterministic propensity of a query compound to be positive or negative. This descriptor is binary in nature with 0 and 1 as the only possible values. Like gm, gm_class also contributes positively towards hepatotoxicity. The compound Acebutolol (14) has gm_class value of 1 and it has been observed that this compound is hepatotoxic. Similarly, Methscopolamine (1062) has gm_class value of 0 and it has been observed that this compound is non-hepatotoxic.
Analysis of the c-RASAR derived predictions—a local approach using explainable AI with an example of acetaminophen
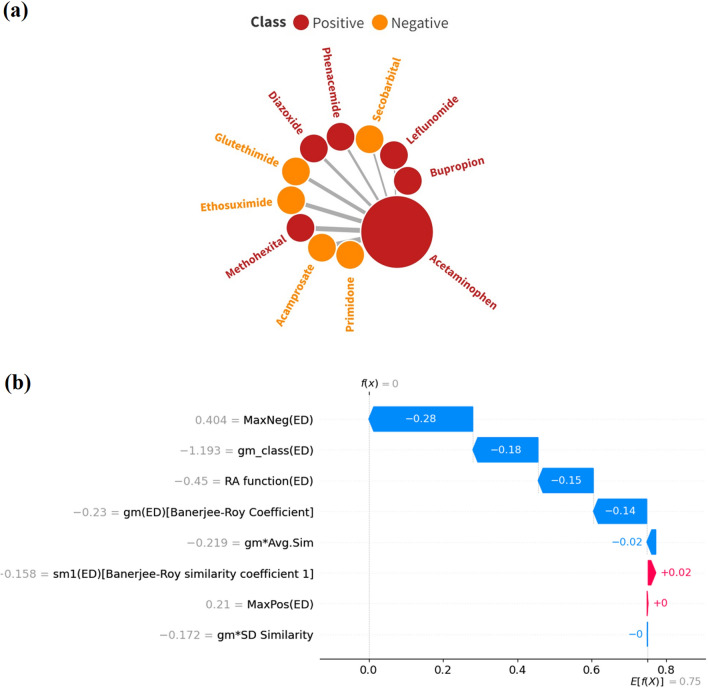
The underlying expectation of statistical modeling approaches is that they should efficiently predict the active and inactive compounds. However, often these predictions are erroneous due to some of the limitations that involve the machine learning algorithm employed, the selected descriptor space defining the applicability domain, and the data structure of the training set, using which a model is trained. It is worth noting that acetaminophen (a training set data point in the present analysis) is a well-known hepatotoxic compound, which is also evident from our dataset. However, our LDA c-RASAR model misclassifies this compound. This is an example of a false negative, where the experimental data says that it is hepatotoxic, but the model-derived prediction infers that it is non-hepatotoxic. In this section, we have analyzed this ambiguity using the concept of similarity coupled with explainable AI. It is worth noting that RASAR is a similarity-driven approach, which is dependent on the nearest neighbors of a particular query compound. Initially, as evident from the chemical diversity plot (Fig. 3), we find that acetaminophen has very low levels of structural similarity among other compounds in the entire dataset. Additionally, we have identified 10 nearest neighboring source compounds of acetaminophen using the concepts of Read-Across and observed that only five of those compounds were hepatotoxic (PosFrac = 0.5). Moreover, the analysis of the top 5 nearest neighbors suggests that four out of the five source compounds were non-hepatotoxic. This shows that although there is an equal fraction of hepatotoxic and non-hepatotoxic compounds among the close source neighbors, most of the non-hepatotoxic compounds had higher similarities with the query compound acetaminophen. This information drives the model towards predicting that acetaminophen is a non-hepatotoxic compound. Additionally, in Fig. 8a, it is observed that Primidone is the nearest neighbor for Acetaminophen (nearest neighbors are arranged in a clockwise direction according to the decreasing similarity levels), although they are structurally very dissimilar. To understand the effect of the RASAR descriptors on this particular compound, a local SHAP plot was developed (Fig. 8b), which depicts that the expected predicted value should have been positive (hepatotoxic) instead of negative (non-hepatotoxic). Like our expectations, most of the RASAR descriptors contributed negatively (except sm1 and MaxPos, which had marginal positive contributions). They led to the prediction, which wrongly states that acetaminophen is non-hepatotoxic. Although RASAR descriptors are entirely similarity-driven, some of these descriptors help the modeler to understand the reliability of the negatively predicted compound, which conventional QSAR descriptors fail to provide. Considering the descriptor gm (Banerjee-Roy coefficient), whose value ranges from − 1 to + 1, a gm value towards either of the extremities infers that the prediction is reliable. Unfortunately, the value of gm is 0 in the case of acetaminophen, which infers that the negative prediction of acetaminophen is unreliable. Additionally, the values of sm1 and sm2 are not in the expected range, where both these values should have been positive for an active compound. According to the definition of Banerjee and Roy20, a positive compound having negative values of sm1 and sm2 can be considered an activity cliff. The collective information from the above-mentioned theories and observations is the reason why acetaminophen has been misclassified as a non-hepatotoxic compound.
Fig. 8.
(a) Nearest neighbors of acetaminophen and (b) local SHAP plot of acetaminophen demonstrating the contribution of features leading to misclassification.
Variation in the values of the RASAR descriptors across the dataset
This is an additional analysis where we tried to explore the variation of the descriptor values with the positive and negative compounds. The dataset was divided into four parts according to a particular descriptor value. These four parts contain a particular descriptor’s high, medium–high, medium–low, and low values. We have now taken the number of positive and negative compounds in each part. This process was done for three important RASAR descriptors, namely RA function, gm, and sm1. On analyzing the variations of RA function (Fig. 9a), it was observed that a high value of RA function is present in most of the positive compounds, while a low value of RA function is present in most negative compounds. This is expected since the RA function acts as a composite function encoding information of the entire chemical space of the QSAR descriptors. In the medium–high value region of RA function, there is a near-equal balance of the positive and negative compounds, suggesting that the number of positive and negative compounds are nearly equal in this region. This is attributed to the reduced discriminatory power of the descriptor in this region. On analyzing gm (Fig. 9b), the high-value region of gm has a higher number of positive compounds and the low-value region of gm has a higher number of negative compounds. This is also expected since gm reflects the propensity of a query compound to become positive or negative. The descriptor sm1 is designed to identify the modelability of a given dataset. As evident from Fig. 9c, the high-value and the low-value regions of sm1 contain a remarkably low number of positive and negative compounds, and most of the compounds lie in the medium–high and medium–low regions. This reiterates the fact that this dataset has poor modelability, which further enhances the potential of RASAR descriptors since the c-RASAR models had relatively good statistical validation metrics.
Fig. 9.
Variation in the values of selected RASAR descriptors across the dataset.
Importance of RASAR descriptors – a statistical analysis using different dimensionality reduction methods
This is a section that deals with how the RASAR descriptors and the c-RASAR models provide superior performance as compared to the traditional QSAR models developed using various structural and physicochemical descriptors. Apart from the fact that the c-RASAR models are developed using a significantly lower number of descriptors (eight) as compared to the conventional QSAR model (twenty-nine), this section shows the discriminatory power of the RASAR descriptors. To assess this, we have employed three different dimensionality reduction techniques: the t-distributed Stochastic Neighbor Embedding (t-SNE)51, Uniform Manifold Approximation and Projection (UMAP)52, and Arithmetic Residuals in k-groups Analysis (ARKA) framework15. While the former two methods consider only the descriptor space, the recently developed ARKA framework not only considers the descriptor space but also considers the observed response values of the training compounds. In this section, we will analyze the different observations using the three different dimensionality reduction techniques and derive certain key information that is useful in modeling terms.
t-distributed Stochastic Neighbor Embedding (t-SNE) analysis
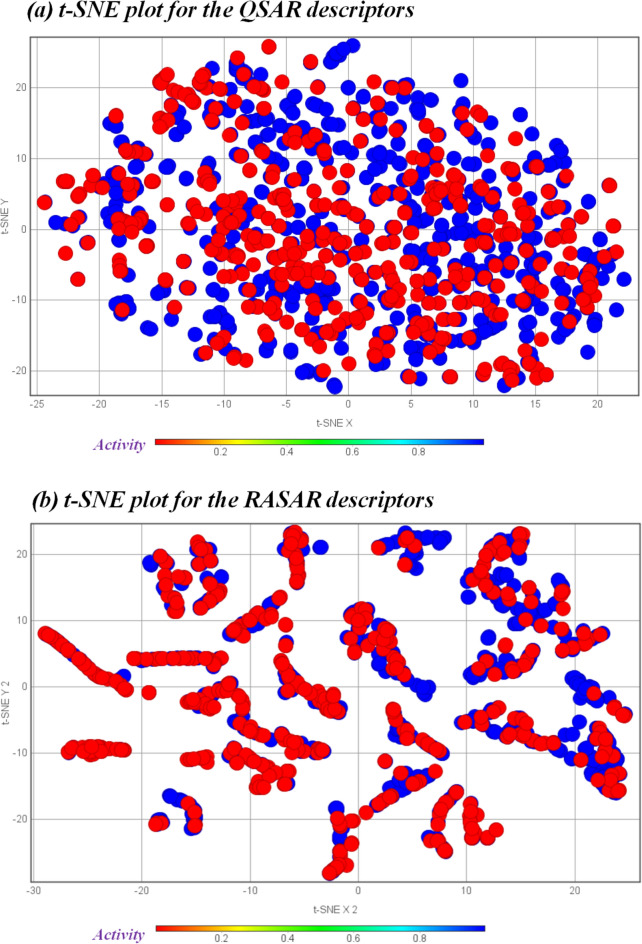
The t-SNE plots utilize a non-linear algorithm to reduce dimensionality and cluster similar data points. This uses an Euclidean distance-based approach to compute the similarity among data points and cluster similar data points. The basic understanding is that the set of descriptors (QSAR and c-RASAR) that better express the similarities among compounds should generate better clustering of the data points. As evident from Fig. 10, one can observe that the t-SNE plot developed using the eight different c-RASAR modeling descriptors shows better clustering as compared to the t-SNE plot developed using the 29 different QSAR modeling descriptors. Therefore, this analysis infers that the RASAR descriptors are better at representing similar data points.
Fig. 10.
t-SNE plots of the (a) QSAR modeling descriptors and (b) RASAR modeling descriptors.
Uniform manifold approximation and projection (UMAP) analysis
The UMAP plots also adhere to a non-linear dimensionality reduction technique similar to t-SNE. An Euclidean distance-based approach is used to define the similarity among data points. Again, the basic concept is that the descriptor matrix with a better clustering ability is more efficient in properly representing similar data points. Identical to the previous case, we developed UMAP plots for 29 QSAR and 8 RASAR modeling descriptors. The observation was similar since the RASAR descriptors have a better clustering ability (Fig. 11).
Fig. 11.
UMAP plots of the (a) QSAR modeling descriptors and (b) RASAR modeling descriptors.
Arithmetic Residuals in k-groups Analysis (ARKA) framework
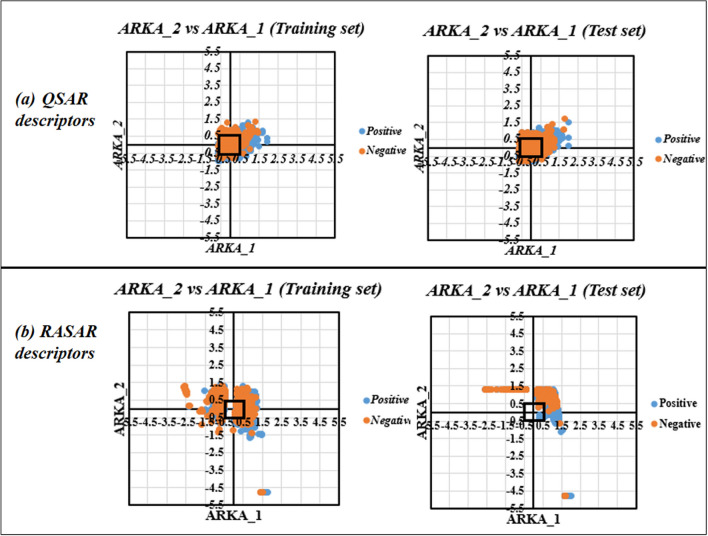
So far, we have discussed the potential of the RASAR descriptors using various dimensionality reduction techniques that utilize only the descriptor space. However, these dimensionality reduction techniques cannot identify potential activity cliffs since their algorithm does not involve information from the training set response values. This is how the ARKA framework differs from the conventional dimensionality reduction methods since it utilizes information from the training set response to derive a mathematical weightage value. It would be interesting to see the clustering ability of the 29 QSAR descriptors and the 8 RASAR descriptors in this particular framework and analyze some of the activity cliffs identified by the ARKA plot generated from the RASAR descriptor. Figure 12 represents the plots for ARKA_2 vs. ARKA_1 for the training and test sets of the 29 QSAR modeling descriptors and the 8 RASAR descriptors. The ARKA descriptor plots generated using the QSAR descriptors showed that most of the data points lie in the less modelable and borderline zone, as defined by Banerjee and Roy15, and this infers that the QSAR descriptors, after the dimensionality reduction, cannot sufficiently describe the complete chemical information required for the model to generate efficient predictions. On the other hand, the ARKA descriptor plots generated using the 8 RASAR descriptors (after the dimensionality reduction) showed enhanced modelability and had a lower number of compounds in the borderline and less-modelable zone. In Fig. 12, the rectangle near the origin denotes the region of less-modelable data points, and the number of data points inside this rectangle reflects a lower reliability and modelability of the data. As evident, the ARKA plots for the QSAR descriptors have a large number of data points in this zone, while the ARKA plots for the RASAR descriptors have a lower number of such data points, again implying the importance of RASAR descriptors in enhancing the modelability of a dataset.
Fig. 12.
ARKA_1 versus ARKA_2 plots of the training and test sets using (a) QSAR modeling descriptors and (b) RASAR modeling descriptors.
In ideal cases, the positive compounds should lie in the fourth quadrant of the ARKA plot (where ARKA_1 is positive and ARKA_2 is negative), and the negative compound should lie in the second quadrant of the ARKA plot (where ARKA_1 is negative and ARKA_2 is positive). However, the occurrence of positive compounds in the second quadrant or negative compounds in the fourth quadrant is the instance where we can term such compounds as activity cliffs (provided that they do not lie in the less-modelable or borderline zone for a comprehensive evaluation). From the ARKA plots developed using the RASAR descriptors, we have identified five compounds from the training set and four compounds from the test set as activity cliffs. An analysis of two such activity cliffs has been performed and their structural and activity representation have been provided in Table 3.
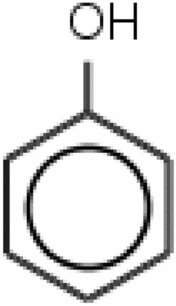
Table 3.
Structural representation of the activity cliffs, their closest source neighbors from the ARKA plots and the similarity values.
| Set | Activity cliff | Closest neighbor | Similarity value using QSAR descriptors (Normalized Euclidean distance-based) |
|---|---|---|---|
| Training set |
Bupivacaine (94) (Active) |
Mepivacaine (1048) (Inactive) |
0.889 |
| Test set |
Dienestrol (885) (Inactive) |
Phenol (561) (Active) |
0.857 |
As evident from Table 3, the training set compounds Bupivacaine (94) and Mepivacaine (1048) have a high level of similarity, and Mepivacaine is the closest neighbor of Bupivacaine, as observed from the ARKA_2 vs ARKA_1 plot. Additionally, these compounds belong to the same pharmacological class, i.e.; local anesthetics. Even the main structural moiety is the same for both of these drugs, and they differ slightly in the side chain (the butyl group in Bupivacaine and the methyl group in Mepivacaine). According to the principle of similarity, two molecules having similar structural features are expected to show similar properties. In contrast, the experimental data says that Bupivacaine is an active (hepatotoxic) molecule while Mepivacaine is an inactive (non-hepatotoxic molecule). Similarly, from the test set, it can be observed that Dienestrol (885) and Phenol (561) have a high level of similarity and the same structural moiety (the phenol ring). Still, they differ in their activity values since the experimental data says that Dienestrol is an inactive (non-hepatotoxic) compound while Phenol is an active (hepatotoxic) compound. This demonstrates the power of the RASAR descriptors and the ARKA framework, where the placement of the compounds Bupivacaine and Dienestrol were not in the desired quadrant in the ARKA plot, and has proven to be activity cliffs.
Analysis of activity cliffs using Read-Across-derived information
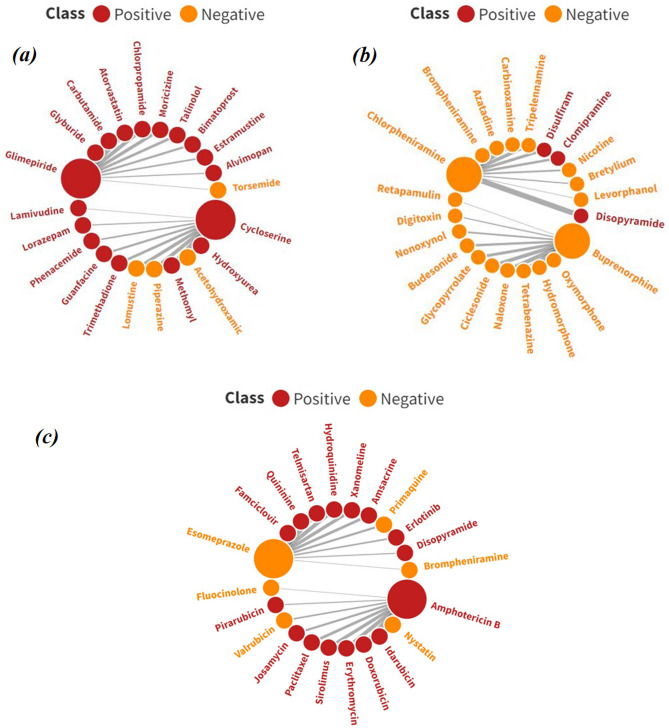
The basic concept of Read-Across is that for a query compound, we locate its close source neighbors (having experimental response values) in the chemical similarity space (based on the selected structural and physicochemical descriptors) and derive a consensus-like prediction for the query compound. This particular information is essential in identifying whether a particular query compound is an activity cliff. One of the theories for this is that if the nearest neighbor of a particular active query compound is an inactive molecule or vice versa, then such query compounds can be termed activity cliffs since they have identified a compound of the opposite class that most closely resembles its structural characteristics. Apart from the prediction files and the RASAR descriptor files generated by the tools Read-Across-v4.2.1 and RASAR-Desc-Calc-v3.0.3, respectively, both of these tools additionally generate a file (“Sort.xlsx”) that identifies the nearest neighbors for a particular query compound, based on which Read-Across predictions and the RASAR descriptors are calculated. The target compounds that have been analyzed in this section are from the test set. Taking information on the nearest neighbors of every query compound, we have identified the closest neighboring compounds for every query compound and analyzed whether they are activity cliffs or not. In usual cases, it is expected that the nearest neighbor of a positive query compound should ideally be positive (Fig. 13a) while the nearest neighbor of a negative query compound should ideally be negative (Fig. 13b). However, a query compound can be termed activity cliff only when the nearest neighbor of a positive query compound is negative or the nearest neighbor of a negative query compound is positive (Fig. 13c). As exemplified in Fig. 13a, the query compound Cycloserine is hepatotoxic, and its nearest neighbor is Hydroxyurea, which is also hepatotoxic. Similar observations can also be made for the query compound Glimepiride, whose nearest neighbor is Glyburide, and both of these compounds are hepatotoxic. Additionally, both Glimepiride and Glyburide are antidiabetic drugs from the group of arylsulfonylureas, and it is expected that they should show similar properties since they are structurally very similar. Figure 13b suggests that the query compound Buprenorphine is a non-hepatotoxic compound, and its nearest neighbor (Oxymorphone) is also non-hepatotoxic. This is also quite obvious since both these molecules belong to the opioid analgesic class of drugs, and it is expected that they should show similar properties. Additionally, the query compound Chlorpheniramine, which is also a non-hepatotoxic compound, has another non-hepatotoxic compound—Brompheniramine as its nearest neighbor. This is also expected since both of these molecules are antihistamines and only differ in their halogen substitution (chlorine in Chlorpheniramine and bromine in Brompheniramine). Figure 13c presents typical examples of activity cliffs. For the query compound Amphotericin B, the nearest neighbor is Nystatin. However, the experimental report infers that Amphotericin B is a hepatotoxic molecule, while Nystatin is non-hepatotoxic. This is a classic example of an activity cliff since both of these molecules are macrocyclic polyene antifungal drugs and possess very high levels of structural similarity. If we observe the distribution of the ten nearest neighbors of Amphoptericin B, we find that most of the molecules are hepatotoxic just like Amphotericin B. With this information, we can safely infer that Nystatin has been identified as an activity cliff. In another case, for the query compound Esomeprazole, the nearest neighbor is Famcyclovir. It is to be noted that Esomeprazole has been experimentally labeled as a non-hepatotoxic compound but Famcyclovir has been labeled as a hepatotoxic compound. If we observe the distribution of the 10 close source neighbors for the non-hepatotoxic query compound Esomeprazole, we find that 8 of them were labeled hepatotoxic compounds. Therefore, in this case, a non-hepatotoxic compound Esomeprazole has high levels of structural similarity with such molecules that have experimentally been labeled as hepatotoxics. Therefore, this observation concludes that the molecule Esomeprazole is an activity cliff. The positive and negative query compounds, along with their 10 close source neighbors (arranged in a decreasing order of similarity and depicted clockwise for each query compound), have been presented in Fig. 13. Thus, the compounds—Nystatin from the training set and Esomeprazole from the test set have been correctly identified as activity cliffs by the values of sm1 and sm2 (positive sm1 and sm2 values for the inactive compounds Nystatin and Esomeprazole).
Fig. 13.
An analysis of activity cliffs using the concepts from Read-Across and c-RASAR. (a) indicates an ideal case for positive query compounds, (b) indicates an ideal case for negative query compounds, and (c) indicates the activity cliffs.
Results for the true external set prediction
The evaluation of the model performance on a true external data set is a benchmark for assessing the generalizability of the developed model. The main motive is to check whether the model efficiently identifies hepatotoxic compounds on true external set data. The experimental active/inactive data was collected from the works of He et al.39, who also reported predictions generated using their voting classifier developed using eight different ML models. From a general conscience, it is expected that a voting classifier model from 8 different ML models should more efficiently be able to identify the hepatotoxic compounds compared to a simple LDA model. However, the novelty/specialty of this LDA model is that it was trained using RASAR descriptors. The true external set compounds that appeared in our training set were removed from our analysis. Therefore, this final list of 184 compounds has no such data points that appeared in either our or He et al.’s training sets, leading to the foundation of an unbiased evaluation. The predictions for these compounds were made using the LDA c-RASAR model, which generated the best predictivity. At this stage, we have the experimental response values, predicted values using the previously reported ensemble model, and predictions developed using our LDA c-RASAR model. Classification-based validation metrics like Accuracy and Sensitivity (Recall) were computed for both predictions. The reason for choosing these metrics is that the best model should not only be able to identify the hepatotoxic compounds efficiently but also should be able to generate a lower number of false negatives (data points that are hepatotoxic, but the model predicts that they are non-hepatotoxic). Additional metrics like Precision and F1 score were also computed and reported. The complete comparison has been reported in Table 4, where it is observed that the LDA c-RASAR model not only has enhanced accuracy in predicting the true external set but also generates a lower number of false negatives. From a pharmacological and statistical point-of-view, a model generating a higher number of false negatives is not sufficiently reliable as it can bypass potential hepatotoxic compounds by predicting them as non-hepatotoxic.
Table 4.
Comparison of the performance of the true external set data using our LDA c-RASAR model and the previously reported ensemble model.
| Models | Accuracy | Sensitivity (Recall) | Precision | F1 score |
|---|---|---|---|---|
| LDA c-RASAR | 0.734 | 0.824 | 0.778 | 0.800 |
| He et al. ensemble model39 | 0.723 | 0.756 | 0.804 | 0.779 |
Comparison with previously reported models
This section indicates a comprehensive comparison of the performance of our model and the previously reported models. Liew et al.1 used the same dataset to develop machine learning models. They used 617 base classifiers of k-Nearest Neighbor (k-NN), Support Vector Machine (SVM), and Naïve Bayes (NB), and used these predictions as descriptors for subsequent modeling using Naïve Bayes as the final stacking classifier. This procedure appears extremely complex, with very little room for reproducibility, especially when the authors predicted three external sets containing just 120, 47, and 20 compounds. Additionally, the authors defined that the external set containing 20 compounds is ten pairs of activity cliffs. If we analyze their prediction results, some important validation metrics like AUC, specificity, and G-mean did not even pass their threshold values, even though the authors used an array of modeling algorithms. Moreover, the prediction for true external set compounds using the presented modeling framework would be tedious, and these authors also did not evaluate the performance of the final stacking classifier model on true external sets. On the other hand, we have developed a simple, linear, reproducible, and transferable LDA c-RASAR model that can easily be used to compute true external set predictions. Additionally, we have not only employed this model to predict a test set containing 631 compounds (which is more than three times larger than the combined three different external sets of Liew et al.) but also have predicted another true external set of 184 compounds. As evident from the results of various statistical validation metrics of the predictions for the test and the true external sets, it is evident that the LDA c-RASAR model provided more robust, reliable, and accurate predictions of unseen hepatotoxic compounds. Toropova et al.5 also used this same dataset to develop a semi-correlation-based model that uses a regression modeling framework employing an optimal SMILES-based descriptor on graded data to generate classification predictions. However, the authors ignored the unique/rare structural features during the computation of their descriptor, which appears to introduce a bias in their modeling framework. Additionally, they have divided the dataset into four equal parts—active training, inactive training, calibration, and validation sets, and have only developed the model using the active training set (314 compounds). This model was evaluated for the predictive potential using a validation set of 322 compounds. On the other hand, our LDA c-RASAR model was not only trained using a higher number of data points (643 compounds) but also its predictive ability was evaluated on a large number of test set data points (631 compounds). Additionally, we have performed validation using a true external set to prove the generalizability of our model, which Toropova et al.5 did not perform. Our LDA c-RASAR model has not only been developed on a balanced training set but also provides competitive performance on the training, test, and external sets, as evident from the different classification-based validation metrics. Moreover, the present work provides a deep insight into potential activity cliffs using multiple methods, which is missing from the previous works.
Conclusion
Drug-Induced Liver Injury (DILI) is an important aspect since many drugs have the potential to cause liver injury. This warrants continuous research to develop safer molecules and identify safer methods for drug disposal. These hepatotoxic drugs do not necessarily be orally ingested, as various exposures from the environment can lead to the entry of these molecules inside the body. Predictive models are the need of the hour that can efficiently identify potential hepatotoxic molecules. Although various models have been reported previously, the predictive ability to screen a sufficiently large number of compounds still remains a concern. In this research work, we have developed c-RASAR models that not only have been trained using a sufficiently large number of compounds encoding the complete chemical space but also the performance has been tested on a sufficiently large number of test and true external data points. Moreover, the LDA c-RASAR model involves encapsulating non-linear relationships into a linear modeling framework, which is simple and reproducible53,54. This LDA c-RASAR model not only generates good predictions for the training set but also performs well on unseen data (test and true external sets). Rigorous cross-validation inferred that the performance of all the developed ML-based c-RASAR models was not dependent on only a certain number of chemicals. When it comes to reflection of the true potency of the c-RASAR modeling approach, a simple univariate LDA c-RASAR model has better predictive ability as compared to all the corresponding ML-based QSAR models, as evident from the test set validation statistics. Moreover, the application of different dimensionality reduction methods reflects the power and advantages of RASAR descriptors in being able to identify and segregate different types of data points into distinct clusters, which is not the case for standard QSAR descriptors. Additionally, the RASAR descriptors are potential indicators of activity cliffs, which is very common considering working with such a diverse dataset. Therefore, on observing the predictive ability and the cross-validation score, it can be inferred that the LDA c-RASAR model can safely be used to predict the hepatotoxicity of query chemicals.
Supplementary Information
Acknowledgements
AB thanks the Life Sciences Research Board, DRDO, New Delhi for a senior research fellowship. KR thanks the Anusandhan National Research Foundation (ANRF), New Delhi for the financial assistance under the CRG scheme (CRG/2023/000202).
Disclaimer
A preprint version of this manuscript has been submitted to ChemRxiv (10.26434/chemrxiv-2024-b4rln).
Author contributions
A.B.—Investigation, Validation, Writing—Initial draft, Software K.R.—Supervision, Conceptualization, Writing—Review and editing.
Funding
The Life Sciences Research Board, DRDO, New Delhi (LSRB/01/15001/M/LSRB-394/SH&DD/2022), has funded this research.
Data availability
Data availability The source data used for the development of models reported in this paper are available in Supplementary Materials.
Code availability
The DTC Lab software tools used during the model development are available at https://sites.google.com/jadavpuruniversity.in/dtc-lab-software/home and http://teqip.jdvu.ac.in/QSAR_Tools/ .
Competing interests
The authors declare no competing interests.
Footnotes
Publisher's note
Springer Nature remains neutral with regard to jurisdictional claims in published maps and institutional affiliations.
Supplementary Information
The online version contains supplementary material available at 10.1038/s41598-024-71892-4.
References
- 1.Liew, C. Y., Lim, Y. C. & Yap, C. W. Mixed learning algorithms and features ensemble in hepatotoxicity prediction. J. Comput. Aided Mol. Des.25, 855–871 (2011). 10.1007/s10822-011-9468-3 [DOI] [PubMed] [Google Scholar]
- 2.Zhu, X. & Kruhlak, N. L. Construction and analysis of a human hepatotoxicity database suitable for QSAR modeling using post-market safety data. Toxicology321, 62–72 (2014). 10.1016/j.tox.2014.03.009 [DOI] [PubMed] [Google Scholar]
- 3.Huang, S. H., Tung, C.-W., Fülöp, F. & Li, J.-H. Developing a QSAR model for hepatotoxicity screening of the active compounds in traditional Chinese medicines. Food Chem. Toxicol.78, 71–77 (2015). 10.1016/j.fct.2015.01.020 [DOI] [PubMed] [Google Scholar]
- 4.Zhou, Y. et al. Mechanism of drug-induced liver injury and hepatoprotective effects of natural drugs. Chin. Med.16, 135 (2021). 10.1186/s13020-021-00543-x [DOI] [PMC free article] [PubMed] [Google Scholar]
- 5.Toropova, A. P., Toropov, A. A., Roncaglioni, A. & Benfenati, E. The system of self-consistent models: QSAR analysis of drug-induced liver toxicity. Toxics11, 419 (2023). 10.3390/toxics11050419 [DOI] [PMC free article] [PubMed] [Google Scholar]
- 6.Brogi, S., Ramalho, T. C., Kuca, K., Medina-Franco, J. L. & Valko, M. Editorial: In silico methods for drug design and discovery. Front. Chem.8, 612 (2020). 10.3389/fchem.2020.00612 [DOI] [PMC free article] [PubMed] [Google Scholar]
- 7.Ball, N. et al. Key read across framework components and biology based improvements. Mutat. Res. Gen. Tox. Environ. Muta.853, 503172 (2020). 10.1016/j.mrgentox.2020.503172 [DOI] [PubMed] [Google Scholar]
- 8.Roy, K., Kar, S. & Das, R. N. Understanding the basics of QSAR for applications in pharmaceutical sciences and risk assessment (Academic Press, 2015). [Google Scholar]
- 9.Wang, Y. et al. From molecular descriptors to the developmental toxicity prediction of pesticides/veterinary drugs/bio-pesticides against zebrafish embryo: Dual computational toxicological approaches for prioritization. J. Hazard. Mater.476, 134945 (2024). 10.1016/j.jhazmat.2024.134945 [DOI] [PubMed] [Google Scholar]
- 10.Li, F. et al. Prioritization of the ecotoxicological hazard of PAHs towards aquatic species spanning three trophic levels using 2D-QSTR, read-across and machine learning-driven modelling approaches. J. Hazard. Mater.465, 133410 (2024). 10.1016/j.jhazmat.2023.133410 [DOI] [PubMed] [Google Scholar]
- 11.Li, Y. et al. Ecotoxicological risk assessment of pesticides against different aquatic and terrestrial species: using mechanistic QSTR and iQSTTR modelling approaches to fill the toxicity data gap. Green Chem.26, 839–856 (2024). 10.1039/D3GC03109H [DOI] [Google Scholar]
- 12.Chatterjee, M., Banerjee, A., De, P., Gajewicz-Skretna, A. & Roy, K. A novel quantitative read-across tool designed purposefully to fill the existing gaps in nanosafety data. Environ. Sci. Nano9, 189–203 (2022). 10.1039/D1EN00725D [DOI] [Google Scholar]
- 13.Roy, J. & Roy, K. Nano-read-across predictions of toxicity of metal oxide engineered nanoparticles (MeOx ENPS) used in nanopesticides to BEAS-2B and RAW 264.7 cells. Nanotoxicology16, 629–644 (2022). 10.1080/17435390.2022.2132887 [DOI] [PubMed] [Google Scholar]
- 14.Chatterjee, M. et al. Machine learning—based q-RASAR modeling to predict acute contact toxicity of binary organic pesticide mixtures in honey bees. J. Hazard. Mater.460, 132358 (2023). 10.1016/j.jhazmat.2023.132358 [DOI] [PubMed] [Google Scholar]
- 15.Banerjee, A. & Roy, K. ARKA: A framework of dimensionality reduction for machine-learning classification modeling, risk assessment, and data gap-filling of sparse environmental toxicity data. Environ. Sci. Process. Impacts26, 991–1007 (2024). 10.1039/D4EM00173G [DOI] [PubMed] [Google Scholar]
- 16.Patlewicz, G. et al. Navigating through the minefield of read-across frameworks: A commentary perspective. Comput. Toxicol.6, 39–54 (2018). 10.1016/j.comtox.2018.04.002 [DOI] [Google Scholar]
- 17.Manganelli, S. & Benfenati, E. Use of Read-Across Tools. In In Silico Methods for Predicting Drug Toxicity. Methods in Molecular Biology Vol. 1425 (ed. Benfenati, E.) (Humana Press, 2016). 10.1007/978-1-4939-3609-0_13. [DOI] [PubMed] [Google Scholar]
- 18.Banerjee, A., Chatterjee, M., De, P. & Roy, K. Quantitative predictions from chemical read-across and their confidence measures. Chemom. Intell. Lab. Syst.227, 104613 (2022). 10.1016/j.chemolab.2022.104613 [DOI] [Google Scholar]
- 19.Banerjee, A. & Roy, K. First report of q-RASAR modeling toward an approach of easy interpretability and efficient transferability. Mol. Divers.26, 2847–2862 (2022). 10.1007/s11030-022-10478-6 [DOI] [PubMed] [Google Scholar]
- 20.Banerjee, A. & Roy, K. Prediction-inspired intelligent training for the development of classification read-across structure–activity relationship (c-RASAR) models for organic skin sensitizers: Assessment of classification error rate from novel similarity coefficients. Chem. Res. Toxicol.36, 1518–1531 (2023). 10.1021/acs.chemrestox.3c00155 [DOI] [PubMed] [Google Scholar]
- 21.Roy, K. & Banerjee, A. q-RASAR: A Path to Predictive Cheminformatics (Springer, 2024). [DOI] [PubMed] [Google Scholar]
- 22.Luechtefeld, T., Marsh, D., Rowlands, C. & Hartung, T. Machine Learning of toxicological big data enables read-across structure-activity relationships (RASAR) outperforming animal test reproducibility. Toxicol. Sci.165, 198–212 (2018). 10.1093/toxsci/kfy152 [DOI] [PMC free article] [PubMed] [Google Scholar]
- 23.Banerjee, A. & Roy, K. On some novel similarity-based functions used in the ML-based q-RASAR approach for efficient quantitative predictions of selected toxicity end points. Chem. Res. Toxicol.36, 446–464 (2023). 10.1021/acs.chemrestox.2c00374 [DOI] [PubMed] [Google Scholar]
- 24.Banerjee, A. & Roy, K. Read-across-based intelligent learning: Development of a global q-RASAR model for the efficient quantitative predictions of skin sensitization potential of diverse organic chemicals. Environ. Sci. Process. Impacts25, 1626–1644 (2023). 10.1039/D3EM00322A [DOI] [PubMed] [Google Scholar]
- 25.Chen, S. et al. Ecotoxicological QSAR study of fused/non-fused polycyclic aromatic hydrocarbons (FNFPAHs): Assessment and priority ranking of the acute toxicity to Pimephales promelas by QSAR and consensus modeling methods. Sci. Tot. Environ.876, 162736 (2023). 10.1016/j.scitotenv.2023.162736 [DOI] [PubMed] [Google Scholar]
- 26.Sun, G. et al. QSAR and chemical read-across analysis of 370 potential MGMT inactivators to identify the structural features influencing inactivation potency. Pharmaceutics15, 2170 (2023). 10.3390/pharmaceutics15082170 [DOI] [PMC free article] [PubMed] [Google Scholar]
- 27.Kumar, V., Banerjee, A. & Roy, K. Breaking the barriers: Machine-learning-based c-RASAR approach for accurate blood-brain barrier permeability prediction. J. Chem. Inf. Model.10.1021/acs.jcim.4c00433 (2024). 10.1021/acs.jcim.4c00433 [DOI] [PubMed] [Google Scholar]
- 28.Xie, Z. et al. Fine-tuning GPT-3 for machine learning electronic and functional properties of organic molecules. Chem. Sci.15, 500–510 (2024). 10.1039/D3SC04610A [DOI] [PMC free article] [PubMed] [Google Scholar]
- 29.Omar, O. H., Nematiaram, T., Troisi, A. & Padula, D. Organic materials repurposing, a data set for theoretical predictions of new applications for existing compounds. Sci. Data9, 54 (2022). 10.1038/s41597-022-01142-7 [DOI] [PMC free article] [PubMed] [Google Scholar]
- 30.Mauri, A. alvaDesc: A tool to calculate and analyze molecular descriptors and fingerprints. In Ecotoxicological QSARs Methods in Pharmacology and Toxicology (ed. Roy, K.) (Humana, 2020). [Google Scholar]
- 31.Kumar, A., Kumar, V., Ojha, P. K. & Roy, K. Chronic aquatic toxicity assessment of diverse chemicals on Daphnia magna using QSAR and chemical read-across. Regulat. Toxicol. Pharmacol.148, 105572 (2024). 10.1016/j.yrtph.2024.105572 [DOI] [PubMed] [Google Scholar]
- 32.Kumar, V., Kar, S., De, P., Roy, K. & Leszczynski, J. Identification of potential antivirals against 3CLpro enzyme for the treatment of SARS-CoV-2: A multi-step virtual screening study. SAR QSAR Environ. Res.33, 357–386 (2022). 10.1080/1062936X.2022.2055140 [DOI] [PubMed] [Google Scholar]
- 33.Murcia-Soler, M. et al. Discrimination and selection of new potential antibacterial compound using simple topological descriptors. J. Mol. Graph. Model.21, 375–390 (2003). 10.1016/S1093-3263(02)00184-5 [DOI] [PubMed] [Google Scholar]
- 34.Das, R. N. & Roy, K. Predictive modeling studies for the ecotoxicity of ionic liquids towards the green algae Scenedesmus vacuolatus. Chemosphere104, 170–176 (2014). 10.1016/j.chemosphere.2013.11.002 [DOI] [PubMed] [Google Scholar]
- 35.Xanthopoulos, P., Pardalos, P. M. & Trafalis, T. B. Linear Discriminant Analysis. In Robust Data Mining. SpringerBriefs in Optimization (Springer, 2013). [Google Scholar]
- 36.Pal, M. Random forest classifier for remote sensing classification. Int. J. Rem. Sens.26, 217–222 (2003). 10.1080/01431160412331269698 [DOI] [Google Scholar]
- 37.Lau, K. W. & Wu, Q. H. Online training of support vector classifier. Pat. Recog.36, 1913–1920 (2003). 10.1016/S0031-3203(03)00038-4 [DOI] [Google Scholar]
- 38.Kleinbaum, D. G. & Klein, M. Logistic Regression (Springer, 2010). [Google Scholar]
- 39.He, S. et al. An in silico model for predicting drug-induced hepatotoxicity. Int. J. Mol. Sci.2019, 20 (1897). [DOI] [PMC free article] [PubMed] [Google Scholar]
- 40.Ai, H. et al. Predicting drug-induced liver injury using ensemble learning methods and molecular fingerprints. Toxicol. Sci.165, 100–107 (2018). 10.1093/toxsci/kfy121 [DOI] [PubMed] [Google Scholar]
- 41.Zhang, C. et al. In silico prediction of drug induced liver toxicity using substructure pattern recognition method. Mol. Inform.35, 136–144 (2016). 10.1002/minf.201500055 [DOI] [PubMed] [Google Scholar]
- 42.Kotsampasakou, E., Montanari, F. & Ecker, G. F. Predicting drug-induced liver injury: The importance of data curation. Toxicology389, 139–145 (2017). 10.1016/j.tox.2017.06.003 [DOI] [PMC free article] [PubMed] [Google Scholar]
- 43.Yan, M., Huo, Y., Yin, S. & Hu, H. Mechanisms of acetaminophen-induced liver injury and its implications for therapeutic interventions. Redox Biol.17, 274–283 (2018). 10.1016/j.redox.2018.04.019 [DOI] [PMC free article] [PubMed] [Google Scholar]
- 44.Héberger, K. Sum of ranking differences compares methods or models fairly. TRAC Trends Anal. Chem.29, 101–109 (2010). 10.1016/j.trac.2009.09.009 [DOI] [Google Scholar]
- 45.Héberger, K. & Kollár-Hunek, K. Sum of ranking differences for method discrimination and its validation: comparison of ranks with random numbers. J. Chemom.25, 151–158 (2011). 10.1002/cem.1320 [DOI] [Google Scholar]
- 46.Kollár-Hunek, K. & Héberger, K. Method and model comparison by sum of ranking differences in cases of repeated observations (Ties). Chemom. Intell. Lab. Syst.127, 139–146 (2013). 10.1016/j.chemolab.2013.06.007 [DOI] [Google Scholar]
- 47.Rácz, A., Bajusz, D. & Héberger, K. Multi-level comparison of machine learning classifiers and their performance metrics. Molecules24, 2811 (2019). 10.3390/molecules24152811 [DOI] [PMC free article] [PubMed] [Google Scholar]
- 48.Wojtuch, A., Jankowski, R. & Podlewska, S. How can SHAP values help to shape metabolic stability of chemical compounds?. J. Cheminform.13, 74 (2021). 10.1186/s13321-021-00542-y [DOI] [PMC free article] [PubMed] [Google Scholar]
- 49.Jaganathan, K., Tayara, H. & Chong, K. T. An explainable supervised machine learning model for predicting respiratory toxicity of chemicals using optimal molecular descriptors. Pharmaceutics14, 832 (2022). 10.3390/pharmaceutics14040832 [DOI] [PMC free article] [PubMed] [Google Scholar]
- 50.Rodriguez-Perez, R. & Bajorath, J. Interpretation of compound activity predictions from complex machine learning models using local approximations and shapley values. J. Med. Chem.63, 8761–8777 (2020). 10.1021/acs.jmedchem.9b01101 [DOI] [PubMed] [Google Scholar]
- 51.Van der Maaten, L. & Hinton, G. Visualizing data using t-SNE. J. Mach. Learn. Res.9, 2579–2605 (2008). [Google Scholar]
- 52.McInnes, L., Healy, J. & Melville, J. UMAP: Uniform manifold approximation and projection for dimension reduction. arXiv 2020. 10.48550/arXiv.1802.03426.
- 53.Banerjee, A. & Roy, K. How to correctly develop q-RASAR models for predictive cheminformatics. Expert Opin. Drug Discov.10.1080/17460441.2024.2376651 (2024). 10.1080/17460441.2024.2376651 [DOI] [PubMed] [Google Scholar]
- 54.Banerjee, A. et al. Molecular similarity in chemical informatics and predictive toxicity modeling: From quantitative read-across (q-RA) to quantitative read-across structure–activity relationship (q-RASAR) with the application of machine learning. Crit. Rev. Toxicol.10.1080/10408444.2024.2386260 (2024). 10.1080/10408444.2024.2386260 [DOI] [PMC free article] [PubMed] [Google Scholar]
Associated Data
This section collects any data citations, data availability statements, or supplementary materials included in this article.
Supplementary Materials
Data Availability Statement
Data availability The source data used for the development of models reported in this paper are available in Supplementary Materials.
The DTC Lab software tools used during the model development are available at https://sites.google.com/jadavpuruniversity.in/dtc-lab-software/home and http://teqip.jdvu.ac.in/QSAR_Tools/ .


