

Abstract
This study investigates the impact of particle volume fraction and distribution on the deformation and damage of particle-reinforced metal matrix composites, particularly in the context of functionally graded metal matrix composites. In this study, a two-dimensional nonlinear random microstructure-based finite element modeling approach implemented in ABAQUS/Explicit with a Python-generated script to analyze the deformation and damage mechanisms in composites. The plastic deformation and ductile cracking of the matrix are captured using the Gurson–Tvergaard–Needleman model, whereas particle fracture is modelled using the Johnson–Holmquist II model. Matrix-particle interface decohesion is simulated using the surface-based cohesive zone method. The findings reveal that functionally graded metal matrix composites exhibit higher hardness values () than traditional metal matrix composites. The results highlight the importance of functionally graded metal matrix composites. Functionally graded metal matrix composites with a Gaussian distribution and a particle volume fraction of 10% achieve values comparable to particle-reinforced metal matrix composites with a particle volume fraction of 20%, with only a 2% difference in . Thus, can be improved significantly by employing a low particle volume fraction and incorporating a Gaussian distribution across the material thickness. Furthermore, functionally graded metal matrix composites with a Gaussian distribution exhibit higher values and better agreement with experimental distribution functions when compared to those with a power-law distribution.
Keywords: Random microstructure-based model, Functionally graded metal matrix composites, Finite element method, Damage behavior, Spherical indentation
Subject terms: Aerospace engineering, Mechanical engineering, Structural materials, Computational science, Software
Introduction
Composite structures have the advantage of exhibiting different material properties at different points, offering the potential to enhance their mechanical behavior1. Functionally graded materials () are a class of advanced structures that possess non-uniform material properties throughout the spatial domain of a material. The advancement of composite materials with graded properties has led to a revolution in the fabrication of engineered components. This is particularly true in industries such as electronics, automobiles, aviation, and biomedicine, where conventional metallic or ceramic matrix composites cannot meet design requirements2.
Functionally graded structures can be observed in nature, such as in the bio-tissues of animals and plants. Bones and dental crowns are excellent examples of functionally graded structures because they require a wear-resistant surface combined with a ductile core to withstand high contact and dynamic fatigue loading3,4. Although were initially designed for heat-resistant materials, they have been increasingly employed to control the deformation, pressure, wear, corrosion, and stress concentration by enabling smooth transitional gradients across all dimensions of a product5.
Functionally graded metal matrix composites () belong to the category of metal matrix composites () and are characterized by a continuous variation in the volume fraction () of the reinforcement along a specific direction of the matrix alloy6. offer a gradual or continuous transition in engineering properties at the macroscopic scale, allowing for the combination of desirable properties without the presence of mechanically weak interfaces, which is a limitation often encountered in surface coating techniques7.
A literature review revealed the existence of multiple particle distribution curves within ; examples are:8–16, as depicted in Fig. 1. These empirical curves serve as a valuable resource for theoretical investigations, enabling the development of a controllable function that accurately represents particle distribution within the composite material. Utilizing such a controllable function facilitates a systematic approach for manipulating and analyzing the particle distribution. By fitting the experimental distribution curve to an approximated function, it is possible to obtain a mathematical model that captures the essential characteristics of particle distribution in . This model can be integrated into theoretical studies to enable a deeper understanding of the behavior of , which can serve as a powerful tool for predicting and optimizing the performance of in practical applications.
Figure 1.

Graded distribution of reinforcing phase in matrix from outer to inner surface based on experimental studies.
To assess the mechanical properties of , the indentation method is often favored owing to its simplicity and minimal specimen preparation requirements. This technique can be easily implemented multiple times on both both small-scale materials and miniaturized structures using a single specimen and a suitable load and indenter tip geometry. The use of numerical modeling to simulate the indentation process of can provide insight into the deformation mechanisms, stress, and strain fields within the metal matrix surrounding the reinforcement particles, as well as the interaction between the particles and the matrix17.
Reference18 conducted a study wherein graded Al7075/SiC composites were fabricated using a centrifugal casting technique with the aim of enhancing the mechanical properties and wear resistance for automotive purposes. The fabrication process involved utilizing two distinct weight fractions of particles (6.5% and 9.5%), while maintaining a constant mold rotational speed of 1300 rpm. The findings of the study indicated an improvement in the mechanical properties and wear resistance of the composites, especially in the outer region, with an increase in the weight fraction of particles owing to the influence of centrifugal forces.
In the study conducted by19, the distribution of SiC particles in aluminum-based used in brake rotor discs was investigated. The average particle size used in this study was 23 . The results demonstrated that the maximum hardness achieved after heat treatment of the Al(356)-SiC and Al(2124)-SiC FGMMCs at the outer periphery was 155 BHN and 145 BHN, respectively. Reference20 conducted a study on Al-SiC , where they varied the volume percentage of reinforcement. They found that, as the percentage of reinforcement increased, the density decreased. However, they observed that the hardness and wear resistance increased from the core to the cast surface. At low sliding speeds, they noted that microcracking and abrasive wear were dominant factors.
Reference21 conducted an investigation into the effects of particle segregation ratio and particle distribution on the and particle size () of reinforcement in aluminum based with in-situ primary particles. The study involved varying parameters, such as the mold temperature and high pouring temperature. The fabricated showed a graded dispersion of primary Si and particles in the inner region, with diameters ranging from 70 to 30 and 30 to 18 , respectively. Additionally, the volume fractions of and primary Si exhibited a gradient distribution ranging from of 14.8 to 27.7%. The highest hardness values were observed in the middle portion of the inner layer of the fabricated , ranging from Rockwell hardness () 72.0 to 75.0. Conversely, the outer layer exhibited the lowest hardness value of approximately 56.0 63.0.
Reference22 enhanced the resistance to contact damage in a graded material system comprising silicon nitride () ceramic (higher modulus) and oxynitride glass (lower modulus) by employing a unidirectional gradient of the elastic modulus from the contact surface to the interior. They achieved a 30% reduction in the maximum tensile stresses outside the Hertzian contact circle compared with the monolithic material () of the graded system.
Reference23 investigated the effectiveness of two-scale modeling for analyzing the mechanical properties of and evaluated aluminum as the supporting matrix and silicon carbide as particle inclusions. The mechanical properties of the material were derived at the macroscale level using a full model, and at the microscale level using a representative volume element in two-scale modeling. The results demonstrated the usefulness and reliability of the two-scale model in reducing the numerical computational time. As the of the inclusion increases, the deviation in the stress values decreases, providing evidence supporting the theory that offer the advantage of smoother stress distributions.
Reference17 conducted a study on the indentation behavior of , revealing that the number of layers, compositional gradient exponent, and random particle dispersion have a significant impact on the properties of material. Increasing the number of layers resulted in noticeable increases in indentation depths, whereas increasing the compositional gradient exponent led to higher mean residual stresses. Conversely, at a specific layer number, an increase in the compositional gradient exponent decreased the mean residual stresses and strains owing to an increase in the ceramic . Random particle dispersion influences the central indentation depth and deformed surface profiles, resulting in non-uniform levels and distributions of residual stress and strain.
To the best of our knowledge, no computational model has been developed thus far to quantitatively analyze the evolution of multiple damage mechanisms during the indentation of . The development of such a model is crucial for predicting material behavior under various conditions by systematically analyzing failure mechanisms and simulating responses to stress and strain over time. These models are essential for optimizing the material performance because they enable the tailoring of microstructures to enhance durability and resilience, thus reducing the need for extensive physical testing. They manage complex geometries and loading conditions, providing a virtual testing environment that identifies potential failure points and predicts the real-world performance. Integrating finite element damage models into research and development not only improves cost efficiency and innovation but also deepens material understanding and facilitates advancements in material engineering across various industries. The objective of this study is to address the gap in stress-state-dependent quantitative damage growth analysis in by investigating the indentation of . To achieve this, a microstructure-based model is employed to closely approximate the actual microstructure and consider all three potential failure modes. The hardness assessment procedure outlined in the standard24 is incorporated into finite element analysis (). To capture the damage mechanisms in the matrix, the Gurson–Tvergaard–Needleman () model is employed. This model represents the behavior of the matrix considering void growth and coalescence. Simultaneously, the Johnson–Holmquist II () model is integrated into the FE model to represent particle cracking. The matrix-particle interfacial behavior is further modeled using the cohesive zone method (). The analysis is conducted using ABAQUS/Explicit software, complemented by Python for scripting and preprocessing25,26.
Problem formulation
Figure 2 depicts the configuration of an with a spherical indenter. The composite structure is simulated as a rectangle with a width () of and height () of . In accordance with the ASTM E18-22 standard24, the diameter of indenter () and applied force () were determined as and 980 N, respectively. The was computed using the following equation
| 1 |
where h represents the permanent penetration in millimeters (mm).
Figure 2.
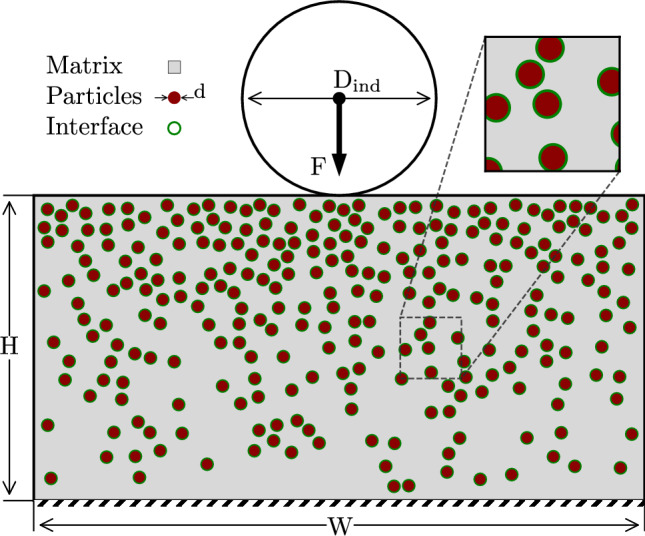
Model configuration of FGMMCs.
Material constitutive models
This study focuses on investigating a composite material consisting of alloy, which is chosen as the base matrix because of its extensive range of engineering and structural applications7. The composite is reinforced with particulates, which are the most commonly used reinforcement for 27 with volume fractions of 10% and 20% and an average size of . In general, composite materials can fail because of one of the three major failure modes. These modes include plastic deformation and ductile cracking of the matrix, fracture of the reinforcement particles, and decohesion at the matrix-particle interface. The following subsections provide a detailed description of each failure mode.
Plastic deformation and ductile cracking of the matrix
A three-stage mechanism involving void nucleation, growth, and coalescence is responsible for the ductile damage observed in the metals. These voids can be initiated by inclusions or microcracks. Subsequently, these voids undergo enlargement owing to the accumulation of plastic strain. The model28 is commonly employed for the theoretical analysis of this phenomenon in porous metals. The model is a modified version of the Gurson model29 and its yield function is mathematically expressed as
| 2 |
where the non-dilatational strain energy is denoted by , and constants , , and are introduced by Tvergaard30 to account for void interactions. Von Mises and flow stresses of the intact material are represented by and , respectively.
To accurately capture the rapid reduction in stress-carrying capacity resulting from void coalescence, Tvergaard–Needleman28 introduced the parameter , known as the effective porosity. This parameter acts as a modeling tool and is mathematically defined as follows:
| 3 |
The model incorporates several parameters to describe void behavior. The critical void volume fraction () at the beginning of coalescence is denoted by and represents the at which the material loses its stress-bearing capacity. Meanwhile, represents the at which the material experiences complete failure and controls the element deletion process. The increase in the owing to void nucleation and growth is considered. The function describing the effective porosity can be expressed as follows:
| 4 |
The rate of void growth () can be mathematically represented as a function of plastic volume change when the material is considered plastically incompressible.
| 5 |
where the trace of the plastic strain-rate tensor is expressed by . The nucleation of voids is strongly influenced by plastic strain, particularly under hydrostatic tension31. This phenomenon can be mathematically represented as follows
| 6 |
| 7 |
Variable p represents the hydrostatic stress, and represents the volume fraction of nucleated voids. Additionally, signifies the mean equivalent plastic strain for void nucleation and represents the standard deviation of the void distribution. The macroscopic plastic work rate can be equivalent to the rate of matrix plastic dissipation, which in turn determines the rate of equivalent plastic strain according to the following equation
| 8 |
Table 1 presents the elastoplastic and model constants employed for the matrix derived from previous studies.
Table 1.
Material constitutive models parameters utilized in this study.
| (GTN model) References30,34,35 | Value | particles (JH2 model) References36,37 | Value |
|---|---|---|---|
| E | 70 GPa | A | 0.93 |
| 275 MPa | B | 0.31 | |
| 361 MPa | G | 155 GPa | |
| 1.5 | T | 0.6 GPa | |
| 1 | N | 0.6 | |
| 2.25 | HEL | 10.5 GPa | |
| 0.001 | 4.5 GPa | ||
| 0.02 | M | 0.6 | |
| 0.06 | C | 0.0 | |
| 0.03 | 12.2 GPa | ||
| 0.1 | 1.3 GPa | ||
| 0.0005 | 193 GPa | ||
| – | – | 0.0 GPa | |
| – | – | 0.0 GPa | |
| – | – | 0.0 | |
| – | – | 1.2 | |
| – | – | 0.005 | |
| – | – | 1.0 | |
| – | – | FS | 0.2 |
| – | – | 1.0 | |
| – | – | 3890 |
Fracture of reinforcement particles
The JH2 model constitutive model was initially employed to simulate the mechanical response of materials exhibiting brittle fractures, particularly ceramic materials. Based on the foundational principles outlined in32, the JH2 model incorporates the mechanisms of softening and pressure-dependent strength, material damage, and fracture; it also accounts for significant residual strength after fracture, bulking, and sensitivity to the loading rate. The model characterizes the behavior of materials in their damaged state by considering three distinct states: intact, damaged, and fractured. In this context, the model employs an analytical function to express the normalized equivalent stress in the damaged state. The generic form of this function is as follows
| 9 |
, , , and are defined as follows: denotes the normalized intact equivalent stress; represents the normalized fracture stress; is the damage factor, which varies between 0 and 1.0; and denotes the equivalent stress at the Hugoniot Elastic Limit (). The critical point signifies the net compressive stress, which considers both hydrostatic pressure and deviatoric stress components. This is the point at which a one-dimensional shock wave with uniaxial strain exceeds the elastic limit of the material33. Lastly, denotes the actual equivalent stress.
The normalized intact strength () can be determined using the following equation:
| 10 |
where A, C, and N are the material constants. represents the normalized pressure defined as the ratio of the actual hydrostatic pressure (P) to the hydrostatic pressure at the (). represents the normalized maximum tensile hydrostatic pressure, which is defined as the ratio of the maximum tensile hydrostatic pressure that the material can withstand (T), to . represents the dimensionless strain rate, defined as the ratio of the actual equivalent strain rate () to the reference strain rate ().
Similarly, the equation for the normalized fracture strength () can be expressed as
| 11 |
where B, C, and M are the material constants. represents the ultimate value of the normalized fracture strength (), providing additional flexibility in the definition of the fracture strength.
According to the model, the softening process in brittle materials can be described by Eq. (9), which allows for the gradual softening of the material as the plastic strain increases. The softening process continues until the material is fully damaged (). The expression describing the cumulative damage resulting from fracture is expressed as follows
| 12 |
where represents the accumulated plastic strain during the integration cycle. Function represents the plastic strain necessary for fracture under a constant pressure P. The parameters and correspond to the damage factors associated with .
When a material reaches a certain threshold of plastic deformation or damage, it enters a failure state described by fluid-like behavior33. In this state, the material loses its strength and cannot withstand the stress. Both the hydrostatic pressure and deviatoric stress become zero. The relationship between hydrostatic pressure P and volumetric strain is described by a polynomial equation of state (), which consists of two distinct stages: an elastic stage and a plastic damage stage. The mathematical expressions for these stages are as follows
| 13 |
Here, , , and are constants and is defined as the ratio of the current density () to the initial density (). For tensile pressure (), Eq. (13) is replaced by . The incremental pressure () is added when the material fractures owing to bulking energy.
The reduction in incremental internal elastic energy is transformed into potential internal energy via an incremental increase in hydrostatic pressure . As the fracture progresses, the shear and deviatoric stresses diminish owing to the decrease in the equivalent plastic flow stress . The elastic internal energy related to these shear and deviatoric stresses can be expressed mathematically as
| 14 |
where G denotes the rigidity modulus. The incremental energy loss is given by
| 15 |
The quantities and are determined using Eq. (14). The change in energy, , is primarily converted into incremental fracturing energy, . An approximate expression for this energy conversion is given by
| 16 |
where is a fraction satisfying , which represents the extent of energy transformation. The model constants used for the particles are summarized in Table 1.
Cohesive zone modeling (CZM) for matrix and particle interfaces
The failure process of an interface surface involves three fundamental components: initiation of damage, progression of damage, and overall debonding resulting from substantial damage. The cohesive zone method () is utilized to describe the potential debonding occurring at the interface between the particles and matrix. This study characterizes the through a bilinear relationship between traction () and separation (). The initiation of damage is governed by the quadratic stress failure criterion. This criterion postulates that damage is initiated when a quadratic interaction function reaches a unit value38. Mathematically, this criterion can be expressed as
| 17 |
where , , and represent the peak values of the nominal stresses during deformation along specific directions: normal to the interface, the first shear direction, and the second shear direction, respectively.
In the traction-separation model, it is assumed that the scalar damage variable changes from 0 to 1 as the material undergoes further loading after damage initiation. The damage variable exerts the following influence on the stress components:
| 18 |
| 19 |
| 20 |
The stress components , , and are obtained by utilizing the elastic traction-separation behavior for the current strain before damage initiation. To characterize the progression of damage within the interface under combined normal and shear deformations, it is helpful to introduce an effective displacement . The effective displacement is defined as follows
| 21 |
The nominal separations in the normal () and in-plane shear (, ) directions govern the evolution of damage variable through the following expression
| 22 |
where and characterize the effective separations at the initiation of damage and complete failure, respectively, and represents the peak value of the effective displacement attained during the loading history. The fracture energy, , which is a measure of the area enclosed by the traction-separation displacement curve, can be obtained as follows
| 23 |
The CZM constants used for the and interfaces in this study are listed in Table 2.
Table 2.
Parameters employed for CZM of matrix/particle interface.
Computational model
The model and its validation are described in the following subsection. To investigate the damage mechanisms related to the failure modes of AA6061-T6/Al2O3 composites, a Python-generated script is used. This script enables the implementation of indentation-hardness test specifications to assess the resulting microstructure. Using this script, it is possible to generate particles with different distributions and volume fractions throughout the structure.
Mathematical equations representing the different failure modes outlined in this study have been compiled and integrated into the ABAQUS software. The analysis process is summarized in the flowchart presented in Fig. 3, providing an overview of the steps involved in the current study.
Figure 3.

Flowchart of the present analysis.
Finite element model
The analysis considered various factors such as geometric considerations, material nonlinearities, and nonlinear deformations caused by the contact between a rigid indenter and a metal matrix surface. The analysis employed a model with 4-node bilinear plane strain quadrilateral elements (). To capture the damage behavior and failure modes precisely, a refined mesh with an element size of is employed throughout the microstructure. This resulted in an average of 146,700 elements and 156,000 nodes per microstructure (Fig. 4). In accordance with the findings of a previous investigation41, the optimal particle shape utilized in this study is circular with a diameter (d) of
Figure 4.
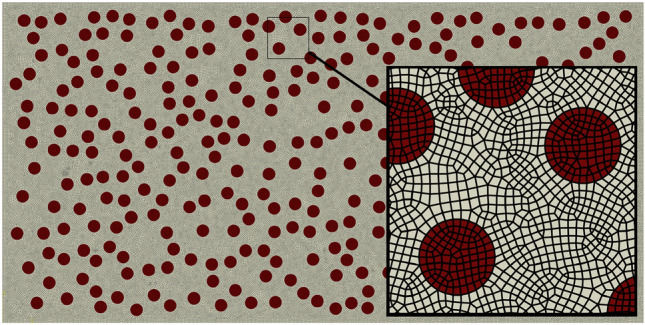
Finite element mesh for the studied model.
To optimize computational efficiency, the model employs a perfectly rigid indenter, and a fixed lower boundary is chosen for the structure to maintain stability. A Coulomb friction coefficient of 0.142,43 is applied at both the indenter-matrix and particle-matrix interfaces to model frictional interactions. For quasi-static analysis in the ABAQUS software, the force was gradually applied in a smooth step44, as depicted in Fig. 5.
Figure 5.

Applied force as a smooth step in ABAQUS.
Validation of the model
The accuracy of the model is validated by comparing its predicted values with those obtained experimentally for the corresponding reported by45. The measurement procedure defined in ASTM E18-2224 is employed in the experimental study. This method initially involves applying a minor load to establish a reference position, followed by the application of a major load for a specified time interval. Subsequently, the major load is removed and the difference in the penetration depth of the indenter is measured and used to calculate the value.
For both volume fractions of 10% and 20%, at least ten random base models were considered in the experimental study, as the particles were randomly dispersed within the structure (refer to Fig. 6). The average value was used for the comparison.
Figure 6.

Representation of microstructure of composite with various .
Table 3 presents a comparison between the random distribution of the proposed model and experimental data. The results indicate that the error ranges from 0.635 to 1.811% when the present random distribution is compared with the experimental data. This low percentage error indicates that the values obtained from the model for volume fractions of 0%, 10%, and 20% are very close to the corresponding experimental values. The comparison demonstrates good agreement between the predicted and experimental results. This minimal error percentage error suggests that the values derived from the model for volume fractions of 0%, 10%, and 20% closely align with the corresponding experimental values. The comparison demonstrates strong agreement between the predicted and experimental results. For further details about the model and its validation, please refer to the previous work41.
Table 3.
HRB validation results.
| Experimental45 | Present model random distribution | Error % | |
|---|---|---|---|
| 0% | 61.387 | 0.635 | |
| 10% | 68.601 | 0.578 | |
| 20% | 73.642 | 1.811 |
Results and discussions
The main objective of this section is to explore the effect of particle distribution on the mechanical characteristics and damage mechanisms of the composite. To achieve this objective, this study analyzes the effects of the particle distribution across the structure on the mechanical properties of the composite.
An analysis is conducted to investigate the indentation behavior of structures composed of under the influence of a spherical indenter. The structure under examination is modelled to exhibit a variation in the of the particles throughout its thickness, as depicted in Fig. 2.
are modelled using the linear rule of mixtures, which is a commonly employed approach17. This modelling technique assumes a linear relationship between the volume fractions of the reinforcement and matrix material. The sum of the volume fractions of the reinforcement and matrix material is equal to one and is expressed as
| 24 |
and represent the volume fractions of and matrix materials, respectively. In the investigated structures (Fig. 2), the particles are distributed randomly throughout the matrix. This irregularity in the arrangement of the reinforcement particles reflects the actual conditions observed in the .
The investigation focused on studying the variation in of particles across the thickness of using two approaches. The first approach is the power law approach46, whereas the second approach utilized a Gaussian distribution47.
The first approach (power law) is commonly employed in the theoretical modeling of structures17,48,49. In this approach, the of particles at any position across the thickness is assumed to be determined by the equation
| 25 |
Here, represents the non-negative compositional gradient exponent, which determines the variation profile of the particles. Different values of result in distinct particle distribution profiles and overall particle volume fractions. Position indicates the location within the thickness of the structure measured from its bottom surface. represents the total thickness of the structure.
To enable meaningful comparisons between and , two total particle volume fractions are considered, 10% and 20%. To determine the volume fractions, the compositional gradient exponent is estimated to be 2.65 for a total of 10%, whereas a value of 0.65 is estimated for when the total is 20%. Figure 7 shows the distribution curves obtained using the estimated values.
Figure 7.
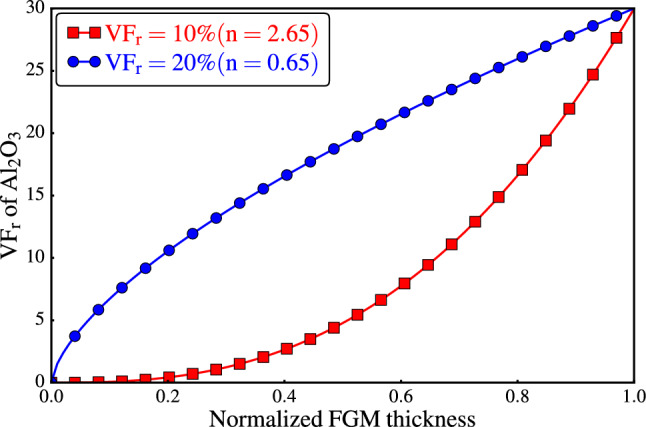
Compositional profiles of the FGMMCs using power law.
Figure 8 shows the samples representing resulting from the application of the power law approach. A sample with a total of 10% ( ) is depicted in Fig. 8a, whereas a sample with a total of 20% ( ) is illustrated in Fig. 8b.
Figure 8.

The distribution of particles across the FGMMCs structure thickness using power law.
The second approach (Gaussian distribution) used to vary the particle distribution within the thickness of the structure is based on experimental work, specifically the study conducted by11–13,16 (see Fig. 1). In this approach, the distribution at any position is determined by fitting the experimental distribution curves. The best fit is achieved using a Gaussian distribution function47, which is represented by the following formula:
| 26 |
The constants , , and determine the shape of the Gaussian curve, and consequently, the particle volume fraction. These constants are estimated using trial methods to obtain specific volume fractions, these constants are estimated through trial methods. For a total of 10%, the estimated values of , , and are 0.365, 2.215, and 0.295, respectively. Similarly, for a total of 20%, the constants are estimated to be , , and . The distribution curves for values of both 10% and 20% using a Gaussian distribution are shown in Fig. 9.
Figure 9.
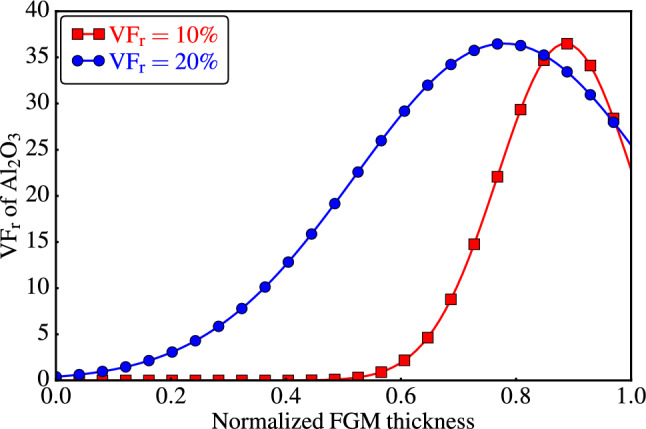
Compositional profiles of the FGMMCs using Gaussian distribution.
Representative samples of structure with these variations obtained using the Gaussian approach are shown in Fig. 10. Figure 10a depicts a structure with a total of 10%, whereas Fig. 10b shows a structure with a total of 20%.
Figure 10.

The distribution of particles across the FGMMCs structure thickness using Gaussian distribution.
HRB results
Nonlinear analyses are performed to explore the influence of the power law and Gaussian distributions in on the indentation behavior of . Specifically, two total volume fractions of particles are considered: 10% and 20%. This is achieved by varying the compositional gradient exponents ( ) for the power law distribution and by adjusting three parameters (, , and ) for the Gaussian distribution.
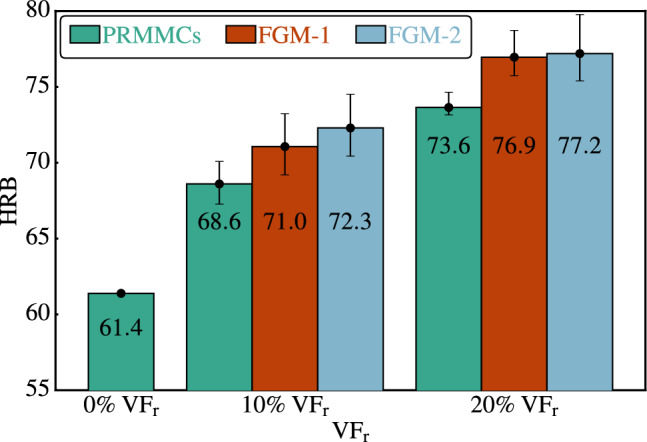
Ten samples with random reinforcement distributions are analyzed for each and distribution, and the calculated indentation depths are used to determine the values. Figure 11 presents the results for the pure matrix as a reference value and the average values for the composites with volume fractions of 10% and 20% particles. In addition to the of the pure matrix (0% ), the results are shown three times in Fig. 11 for both the 10% and 20% particle . The first set of results corresponds to the random distribution of particles throughout the thickness without any variation in particle concentration, labeled as . The other two sets of results show the effects of particle variation through the thickness using the power law and Gaussian distribution, labeled FGM-1 and FGM-2, respectively.
Figure 11.
The variations of HRB for different particles and variation through the FGMMCs thickness.
According to the results presented in Fig. 11, the results exhibited a consistent pattern. Specifically, when examining volume fractions of 10% and 20%, it is apparent that the values of are greater than those of the pure matrix (0% ). Additionally, it can be observed that the values of the using the power law distribution (labeled FGM-1) are higher than those achieved with the , and the values of obtained through the Gaussian distribution (labeled FGM-2) are higher than those obtained through the power law distribution.
Table 4 shows a comparison between the results and their enhancement over the pure matrix for all particle volume fractions and variations through the structure thickness. It is shown that the is enhanced for a 10% over the pure matrix by 11.7%, 15.6%, and 17.8% for , FGM-1, and FGM-2, respectively. For 20% , the enhancements are 19.8%, 25.2, and 25.7 for , FGM-1, and FGM-2, respectively. It is noted from the results in Table 4 that the hardness values in the case of the Gaussian distribution are greater than in the case of the power law distribution as a result of the convergence of the particles in the part closest to the surface of the samples, which leads to an increase in the resistance of the samples to penetration due to the increase in the hardest material in the upper part of the samples, this difference in results appears as a result of the difference in the distribution according to the shape of the functions, which is clearly shown in Figs. 7 and 9, as well as the distribution in samples representing the distributions in Figs. 8 and 10.
Table 4.
HRB results for various particles and variation across the MMCs thickness.
| HRBPRMMCs | Enhancement % over pure matrix | HRB FGMMCs Power law | Enhancement % over pure matrix | HRB FGMMCs Gaussian | Enhancement % over pure matrix | |
|---|---|---|---|---|---|---|
| 10% | 68.6 | 11.7 | 71.0 | 15.6 | 72.3 | 17.8 |
| 20% | 73.6 | 19.8 | 76.9 | 25.2 | 77.2 | 25.7 |
The results highlight the importance of , because the values obtained for with a Gaussian distribution and a particle of 10% are comparable to the values obtained for with a particle of 20%. The difference between the results is approximately 2%. This means that with a low particle and changing the particle variation across the material thickness, that is, by a Gaussian distribution, can be enhanced significantly.
As particle increases, it becomes evident that the values also increase. Notably, the results obtained for both distributions of with a particle of 20% exhibited minimal differences. This observation indicates that it is challenging to achieve a significant difference in the values through particle distribution for with higher particle volume fractions such as 20%.
The load-displacement and surface profiles curves of representative specimens are shown in Fig. 12. The indentation depth decreased significantly as increased. Notably, distinct variations in the results are evident for all representative samples with a of 10%, as illustrated in Fig. 12a,c. Conversely, for a of 20%, the curves for the two representative samples of are nearly identical, as depicted in Fig. 12b,d.
Figure 12.

Effects of of particles on load-displacement curves and deformed indentation surfaces.
Residual von-Mises stress and plastic strain
Figure 13 illustrates the effect of on the distributions of residual von-Mises stress and effective plastic strain within the structure. As decreases, the levels of residual stress and strain in the representative samples decrease. It is worth noting that the regions of the effective plastic strain are localized beneath the indenter and propagate at an angle of nearly .
Figure 13.

Effect of power law distribution on residual von-Mises stress and effective plastic strain during loading.
The stress concentration is influenced by the relative distances between the particles and indenter as well as between the particles themselves. Consequently, as increases, becomes more susceptible to stress concentration. This is because the permissible area for particle movement is reduced with higher particle . Moreover, the particles located beneath the indenter experienced the most significant effects, as shown in Fig. 13b,d.
The range of von-Mises stress varies from 1010 to 1565 for a particle of 10% ( ), and for a particle of 20% ( ), with a range of 1282 to 3215 , as shown in Table 5. The effective plastic strain ranges from 1.566 to 2.41 for a of 10% ( ), and 1.507 to 2.524 for of 20% ( ) (see Table 5).
Table 5.
Output values for FGMMCs using power law distribution.
| Samples | FGMMCs using Power law distribution | |||||||||
|---|---|---|---|---|---|---|---|---|---|---|
| von−Mises | PEEQ | VVF | von−Mises | PEEQ | VVF | |||||
| 1010 | 1.838 | 0.0014 | 3958 | 0.25259 | 1485 | 1.7888 | 0.00232 | 4283 | 0.48826 | |
| 1115 | 2.182 | 0.00142 | 4302 | 1 | 1386 | 1.565 | 0.06 | 4140 | 0.5955 | |
| 1401 | 2.196 | 0.00378 | 4323 | 0.38791 | 1651 | 2.158 | 0.01041 | 4179 | 0.48805 | |
| 1346 | 2.41 | 0.00398 | 4314 | 0.32125 | 2034 | 1.767 | 0.00229 | 4991 | 1 | |
| 1400 | 1.566 | 0.00121 | 4971 | 1 | 1282 | 1.507 | 0.01117 | 3994 | 0.55584 | |
| 1454 | 1.757 | 0.00199 | 4438 | 1 | 3215 | 2.089 | 0.0033 | 5207 | 0.57758 | |
| 1565 | 1.756 | 0.0017 | 4519 | 0.56296 | 1746 | 2.514 | 0.0053 | 4613 | 0.85727 | |
| 1131 | 1.867 | 0.00268 | 3999 | 0.29048 | 1475 | 2.524 | 0.01737 | 4146 | 1 | |
| 1350 | 1.736 | 0.00207 | 4171 | 0.34019 | 1891 | 1.567 | 0.0063 | 4501 | 0.98032 | |
| 1307 | 2.139 | 0.00133 | 4101 | 0.35345 | 1920 | 1.539 | 0.00507 | 4830 | 0.86073 | |
| Min. | 1010 | 1.566 | 0.00121 | 3958 | 0.25259 | 1282 | 1.507 | 0.00229 | 3994 | 0.48805 |
| Max. | 1565 | 2.41 | 0.00398 | 4971 | 1 | 3215 | 2.524 | 0.06 | 5207 | 1 |
| Avg. | 1307.9 | 1.9447 | 0.00216 | 4309.6 | 0.551 | 1808.5 | 1.90188 | 0.013 | 4488.4 | 0.741 |
Figure 14 presents the effects of the Gaussian distribution on the distributions of the residual von-Mises stress and effective plastic strain within the structure for both 10% and 20% volume fractions. Similar to previous observations, localized stress concentration areas beneath the indenter and the propagation angle of the effective plastic strain are evident in these results (see Fig. 14b,d).
Figure 14.

Effect of Gaussian distribution on residual von-Mises stress and effective plastic strain during loading.
By analyzing the distribution of von-Mises stress for the representative samples (Fig. 14a,b), it is observed that the stress levels are higher for 10% . This can be attributed to the chosen Gaussian distribution, which results in a higher concentration of particles in the region directly below the indenter compared with the distribution with a 20% . This can be observed by noting the positions of the peak values in the curves, as depicted in Fig. 9.
The range of von-Mises stress for with a Gaussian distribution is 1401 to 2446 for a particle of 10% and 1196 to 2228 for a particle of 20%, as shown in Table 6. The effective plastic strain ranged from 1.615 to 2.865 for the 10% particle and 1.331 to 2.474 for the 20% particle (see Table 6). These values indicate the extent of plastic deformation experienced by the matrix material in the structures with Gaussian distributions.
Table 6.
Output values for FGMMCs using Gaussian distribution.
| Samples | FGMMCs using Gaussian distribution | |||||||||
|---|---|---|---|---|---|---|---|---|---|---|
| von−Mises | PEEQ | VVF | von−Mises | PEEQ | VVF | |||||
| 1645 | 1.735 | 0.00124 | 4455 | 0.5005 | 1547 | 1.775 | 0.00212 | 4674 | 0.62322 | |
| 1765 | 1.96 | 0.00184 | 4429 | 0.49425 | 1356 | 2.006 | 0.004 | 4455 | 0.4851 | |
| 1722 | 1.822 | 0.00415 | 4610 | 1 | 1411 | 2.277 | 0.00479 | 4353 | 0.37578 | |
| 1413 | 1.917 | 0.00216 | 4104 | 0.64823 | 1343 | 2.266 | 0.00345 | 4058 | 0.8111 | |
| 1894 | 1.671 | 0.01254 | 4519 | 0.4018 | 1464 | 1.331 | 0.00162 | 4223 | 0.54484 | |
| 1401 | 2.863 | 0.00134 | 4355 | 1 | 1741 | 1.867 | 0.00381 | 4888 | 0.5326 | |
| 1676 | 1.615 | 0.0012 | 4411 | 1 | 1547 | 1.752 | 0.06 | 4590 | 1 | |
| 1489 | 1.648 | 0.00115 | 4260 | 0.55083 | 1196 | 1.76 | 0.00218 | 4040 | 0.38482 | |
| 2446 | 1.927 | 0.00176 | 5651 | 0.69258 | 1811 | 1.739 | 0.00239 | 4993 | 0.64814 | |
| 1841 | 2.865 | 0.00248 | 4510 | 0.80866 | 2228 | 2.474 | 0.00694 | 4896 | 0.58603 | |
| Min. | 1401 | 1.615 | 0.00115 | 4104 | 0.4018 | 1196 | 1.331 | 0.00162 | 4040 | 0.37578 |
| Max. | 2446 | 2.865 | 0.01254 | 5651 | 1 | 2228 | 2.474 | 0.06 | 4993 | 1 |
| Avg. | 1729.2 | 2.0023 | 0.003 | 4530.4 | 0.71 | 1564.4 | 1.9247 | 0.01 | 4517 | 0.6 |
A comparison of the von-Mises stress results between and showed that there is a significant increase in the von-Mises stress values in the case of . For instance, when comparing the average von-Mises stress values in both cases, it is found that with 10% , the von-Mises stress values increased by 64% and 117% for with power law and Gaussian distributions, respectively. Similarly, with 20% , the average value of the von-Mises stress increased by 81% and 57% for both the power law and Gaussian distributions, respectively.
Furthermore, an increase in the average values of effective plastic strain is also observed. When considering a 10% of particles, the effective plastic strain increased by 84% and 90% for the power law and Gaussian distribution, respectively. Similarly, with 20% , the effective plastic strain for power law and Gaussian distribution increased by 35% and 37%, which indicates the tendency to damage for over .
Damage analysis of FGMMCs
This subsection presents an analysis of the existing and potential damage locations within the AA6061-T6/ structure for three potential failure modes: (i) matrix damage, (ii) particle fracture, and (iii) interfacial decohesion. The results of the damage parameters associated with each failure mode are analyzed.
-
(i)
Matrix damage:
For of 10%, no damage is observed in any sample for both distribution approaches. Fig. 15a,c shows the representative samples for this , which help predict the failure mechanisms in the matrix. As shown in Table 5, the range of the void volume fraction () for a of 10% ( =2.65) is between 0.00121 and 0.00398, with an average value of 0.00216. Considering the results of for the Gaussian distribution, the range of is between 0.00115 and 0.01254, with an average value of 0.00299 for a of 10% (see Table 6).
Figure 15.

Void volume fraction in matrix for power law and Gaussian during loading.
Based on the results, it is observed that the matrix damage mode occurred when is 20% for both the power law and Gaussian distributions of the . Out of the ten samples studied for each distribution, only one sample in each case exhibited clear damage. These two samples () are shown in Fig. 15b,d. For a of 20% ( =0.65), the range of the is between 0.00229 and 0.06, with an average value of 0.012353 (Table 5). These findings indicated that a higher leads to a higher possibility of void nucleation and growth. For a of 20% Gaussian distribution, the range is between 0.00162 and 0.06, with an average value of 0.00913 (see Table 6). The higher possibility of matrix damage in these cases is attributed to the increase in the number of particles, which reduces the distance between them owing to the limited space available for particle movement.
-
(ii)
Particle fracture:
The damage parameter for the particles is found to be zero for both volume fractions (10% and 20%) in the two types of with the power law and Gaussian distributions. The distribution of the yield stress parameter for the particles is shown in Fig. 16, which indicates critically loaded particles that are susceptible to damage.
Figure 16.

Yield stress distribution in particles for power law and Gaussian during loading.
For samples with a power law distribution (represented in Fig. 16a,b), the range of the yield stress parameter is between 3958 and 4971 , with an average value of 4309 for a of 10% ( ), as shown in Table 5. For a of 20% ( ), the range is between 3994 and 5207 , with an average value of 4488 (see Table 5).
For samples with a Gaussian distribution (represented in Fig. 16c,d), the range of the yield stress parameter is between 4104 and 5651 , with an average value of 4530 for a of 10% (see Table 6). For a of 20%, the range is between 4040 and 4993 , with an average value of 4517 . These findings provide insight into the distribution of the yield stress parameter, highlighting the potential susceptibility of critically loaded particles to damage in both the power law and Gaussian .
-
(iii)
Interfacial decohesion:
For samples with a power law distribution and 10% ( ), there are three samples () in which complete interfacial decohesion is observed. One of these samples () is shown in Fig. 17a. Two samples () exhibited interfacial decohesion when the is 20% ( ), with one of the samples () shown in Fig. 17b.
Figure 17.

Spatial distribution of matrix/particle decohesion damage parameter (CSDMG) for FGMMCs during Loading.
Regarding the Gaussian distribution, interfacial decohesion is observed in three samples () with a of 10%, and one sample () with a of 20. Figure 17c,d shows one sample for each . These findings indicate that interfacial decohesion is a prevalent phenomenon in regardless of the distribution type and .
Comparative analysis of the power law and Gaussian distribution
To compare the two distribution approaches for (the power law and Gaussian distributions), several factors are considered. First, the values are examined, which indicated that the Gaussian distribution approach is the preferred method, particularly for a of 10%. Additionally, to obtain a fair understanding of the preferred distribution approach, the damage incurred by the three different modes in the is studied. Because damage does not occur uniformly across all modes, a normalization procedure is conducted for each damage parameter50. For each , the damage parameter, or the parameter indicating the occurrence of damage, is normalized based on the results obtained from the samples distributed according to both the power law and Gaussian approaches. The following normalization formula of50 is used
| 27 |
Here, represents the normalized value, denotes the set of values used for normalization, represents the minimum values within , and represents the maximum values within . By employing this normalization process, a fair comparison between the damage parameters obtained from the two distribution approaches is achieved, allowing for a complete evaluation of the preferred distribution approach for . Figure 18 presents the normalized values obtained for each distribution approach and .
Figure 18.

Comparison between the two approaches of FGMMCs distribution.
Based on the analysis of Fig. 18a,c,e for a of 10%, it can be concluded that with a Gaussian distribution are more susceptible to damage, particularly interfacial decohesion (as depicted in Fig. 18e). This is because the higher susceptibility to damage in the Gaussian distribution of samples with a particle of 10% can be attributed to the fact that 60% of these samples exhibited more than 40% damage. In contrast, for samples following a power law distribution, the percentage of samples that experienced damage is lower (approximately 30%). Therefore, for a of 10%, the Gaussian distribution offers higher hardness, but is also more susceptible to damage, although it does not necessarily ensure the occurrence of such damage.
From the examination of Fig. 18b,d,f, it is evident that the Gaussian distribution exhibits lower susceptibility to damage. Hence, for a of 20%, a Gaussian distribution is a favorable choice to achieve both high hardness and improved resistance against damage. Considering these results, decisions regarding the distribution approach should consider the specific requirements of the application and evaluate the desired hardness against an acceptable level of potential damage.
Conclusion
A novel finite element model based on a random microstructure is proposed to investigate the deformation and damage behavior of functionally graded metal matrix composites subjected to indentation loading. This study focuses on the influence of the volume fraction and distribution percentage of particles on the thickness of the composite structure. To the best of our knowledge, this study represents the first investigation into the influence of particle volume fraction and distribution on the damage mechanisms of functionally graded metal matrix composites while considering various damage modes occurring during the indentation process. The model incorporated the Gurson-Tvergaard-Needleman (GTN) damage model to simulate the elastoplastic behavior and damage of the matrix, the JH2 cracking model to represent particle fracture, and the cohesive zone model (CZM) to account for matrix-particle interfacial decohesion. The model was employed in ABAQUS/Explicit software using a Python script. The significant findings of this study are as follows:
The finite element model effectively captures the three primary damage mechanisms in , particularly in , thereby providing valuable insights into optimizing their performance.
The hardness value () increases as the particle volume fraction and size increase. Additionally, the probability of fracture for the particles increases with an increase in the volume fraction.
particles enhance the resistance of to deformation, although their effectiveness is influenced by the particle volume fraction.
can be represented using a variation in the particle concentration throughout the thickness of the structure, resulting in . exhibit a higher hardness value () than traditional Metal Matrix Composites ().
This study demonstrates that with a volume fraction of 10% particles and a Gaussian distribution for particle variation through the structure thickness, the is approximately equivalent to the achieved with a volume fraction of 20% particles in without any variation in particle distribution through the thickness.
with a Gaussian distribution yield a higher than those with a power-law distribution and exhibit closer alignment with the experimental distribution functions.
Author contributions
The manuscript titled [Insights into particle dispersion and damage mechanisms in functionally graded metal matrix composites with random microstructure-based finite element model] was authored by M.E. Naguib., who wrote the main manuscript text and prepared the figures. The manuscript was further reviewed by S.I. Gad., M. Megahed., and M.A. Agwa. to ensure its quality and accuracy.
Funding
Open access funding provided by The Science, Technology & Innovation Funding Authority (STDF) in cooperation with The Egyptian Knowledge Bank (EKB).
Data availability
The datasets used during the current study available from the corresponding author on reasonable request.
Competing interests
The authors declare no competing interests.
Footnotes
Publisher's note
Springer Nature remains neutral with regard to jurisdictional claims in published maps and institutional affiliations.
References
-
1.Ghandour, A., Selmy, A., Megahed, M., Kabeel, A., & Ibrahim, A. The influence of glass fiber and copper wire z-binder on the mechanical properties of
 woven polymeric composites. Fibers Polym. 1–12 (2024).
- 2.Gasik, M. Functionally graded materials: Bulk processing techniques. Int. J. Mater. Prod. Technol.39, 20–29 (2010). 10.1504/IJMPT.2010.034257 [DOI] [Google Scholar]
- 3.Sola, A., Bellucci, D. & Cannillo, V. Functionally graded materials for orthopedic applications-an update on design and manufacturing. Biotechnol. Adv.34, 504–531 (2016). 10.1016/j.biotechadv.2015.12.013 [DOI] [PubMed] [Google Scholar]
- 4.Lin, D., Li, Q., Li, W., Zhou, S. & Swain, M. Design optimization of functionally graded dental implant for bone remodeling. Compos. B Eng.40, 668–675 (2009). 10.1016/j.compositesb.2009.04.015 [DOI] [Google Scholar]
- 5.Parihar, R., Setti, S. & Sahu, R. Recent advances in the manufacturing processes of functionally graded materials: A review. Sci. Eng. Compos. Mater.25, 309–336 (2018). 10.1515/secm-2015-0395 [DOI] [Google Scholar]
- 6.Minoo, N. & Kamyar, S. Functionally graded materials: A review of fabrication and properties. Appl. Mater. Today5, 223–245. 10.1016/j.apmt.2016.10.001 (2016). 10.1016/j.apmt.2016.10.001 [DOI] [Google Scholar]
-
7.Sindhu, N., Goyal, R., Pullan, T., Rajan, T. & Madamand, S. Study on
 functionally graded metal matrix composites. Mater. Today Proc.44, 2945–2951 (2021). 10.1016/j.matpr.2021.01.934 [DOI] [Google Scholar]
 - 8.Rajan, T., Jayakumar, E. & Pai, B. Developments in solidification processing of functionally graded aluminium alloys and composites by centrifugal casting technique. Trans. Indian Inst. Met.65, 531–537 (2012). 10.1007/s12666-012-0191-0 [DOI] [Google Scholar]
- 9.Zhang, L., Lin, Q., Chen, F., Zhang, Y. & Yin, H. Micromechanical modeling and experimental characterization for the elastoplastic behavior of a functionally graded material. Int. J. Solids Struct.206, 370–382 (2020). 10.1016/j.ijsolstr.2020.09.010 [DOI] [Google Scholar]
-
10.Vikas, R., Maiya, M., Jayakumar, E. & Ranjan, T. Processing and characterization of
 reinforced functionally graded
  6061 aluminium metal matrix composites, International Journal of Advancements in Mechanical and Aeronautical. Engineering1, 61–65 (2014). [Google Scholar]
 - 11.Saleh, B. et al. Influence of gradient structure on wear characteristics of centrifugally cast functionally graded magnesium matrix composites for automotive applications. Arch. Civ. Mech. Eng.21, 1–23 (2021). 10.1007/s43452-020-00168-1 [DOI] [Google Scholar]
-
12.El-Galy, I., Ahmed, M. & Bassiouny, B. Characterization of functionally graded
 metal matrix composites manufactured by centrifugal casting. Alex. Eng. J.56, 371–381 (2017). 10.1016/j.aej.2017.03.009 [DOI] [Google Scholar]
 -
13.El-Galy, I., Bassiouny, B. & Ahmed, M. Empirical model for dry sliding wear behaviour of centrifugally cast functionally graded
 composite. Key Eng. Mater.786, 276–285 (2018). 10.4028/www.scientific.net/KEM.786.276 [DOI] [Google Scholar]
 - 14.Sobczak, J. & Drenchev, L. Metallic functionally graded materials: A specific class of advanced composites. J. Mater. Sci. Technol.29, 297–316 (2013). 10.1016/j.jmst.2013.02.006 [DOI] [Google Scholar]
-
15.Vieira, A., Sequeira, P., Gomes, H. & Rocha, L. Dry sliding wear of
 alloy/
 functionally graded composites: Influence of processing conditions. Wear267, 585–592 (2009). 10.1016/j.wear.2009.01.041 [DOI] [Google Scholar]
 - 16.Watanabe, Y., Inaguma, Y., Sato, H. & Miura-Fujiwara, E. A novel fabrication method for functionally graded materials under centrifugal force: The centrifugal mixed-powder method. Materials2, 2510–2525 (2009). 10.3390/ma2042510 [DOI] [Google Scholar]
-
17.Ekici, R., Apalak, M. & Yildirim, M. Indentation behavior of functionally graded
 metal matrix composites with random particle dispersion. Compos. B Eng.42, 1497–1507 (2011). 10.1016/j.compositesb.2011.04.053 [DOI] [Google Scholar]
 -
18.Prabhu, T. Processing and properties evaluation of functionally continuous graded 7075
 composites. Arch. Civ. Mech. Eng.17, 20–31 (2017). 10.1016/j.acme.2016.08.004 [DOI] [Google Scholar]
 - 19.Rajan, T., Pillai, R. & Pai, B. Characterization of centrifugal cast functionally graded aluminum-silicon carbide metal matrix composites. Mater. Charact.61, 923–928 (2010). 10.1016/j.matchar.2010.06.002 [DOI] [Google Scholar]
-
20.Carvalho, O., Buciumeanu, M., Miranda, G., Madeira, S. & Silva, F. Development of a method to produce
 by controlling the reinforcement distribution. Mater. Des.92, 233–239 (2016). 10.1016/j.matdes.2015.12.032 [DOI] [Google Scholar]
 -
21.Lin, X., Liu, C. & Xiao, H. Fabrication of
 functionally graded materials tube reinforced with in situ
  particles by centrifugal casting. Compos. B Eng.45, 8–21 (2013). 10.1016/j.compositesb.2012.09.001 [DOI] [Google Scholar]
 -
22.Pender, D., Padture, N., Giannakopoulos, A. & Suresh, S. The silicon nitride-oxynitride glass system: Gradients in elastic modulus for improved contact-damage resistance. Part
 . Acta Mater.49, 3255–3262 (2001). 10.1016/S1359-6454(01)00200-2 [DOI] [Google Scholar]
 - 23.Fatoni, N., Park, W. & Kwon, O. Mechanical property evaluation of functionally graded materials using two-scale modeling. J. Adv. Mar. Eng. Technol. (JAMET)41, 431–438 (2017). 10.5916/jkosme.2017.41.5.431 [DOI] [Google Scholar]
- 24.ASTM E18-22, Standard Test Method for Rockwell Hardness of Metallic Materials, West Conshohocken (2022).
- 25.D. S. S. Corp, ABAQUS, United States (2020).
- 26.P. S. Foundation, Python (2022).
- 27.Reiff-Musgroveand, R. et al. Indentation plastometry of particulate metal matrix composites, highlighting effects of microstructural scale. Adv. Eng. Mater.25, 2201479 (2023). 10.1002/adem.202201479 [DOI] [Google Scholar]
-
28.Tvergaard, V. & Needleman, A. Analysis of the cup
 cone fracture in a round tensile bar. Acta Metall.10.1016/0001-6160(84)90213-X (1984). 10.1016/0001-6160(84)90213-X [DOI] [Google Scholar]
 -
29.Gurson, A. L. Continuum theory of ductile rupture by void nucleation and growth: Part 1
 yield criteria and flow rules for porous ductile media. J. Eng. Mater. Technol. Trans. ASME10.1115/1.3443401 (1977). 10.1115/1.3443401 [DOI] [Google Scholar]
 - 30.Tvergaard, V. Influence of void nucleation on ductile shear fracture at a free surface. J. Mech. Phys. Solids10.1016/0022-5096(82)90025-4 (1982). 10.1016/0022-5096(82)90025-4 [DOI] [Google Scholar]
- 31.Chu, C. C. & Needleman, A. Void nucleation effects in biaxially stretched sheets. J. Eng. Mater. Technol. Trans. ASME10.1115/1.3224807 (1980). 10.1115/1.3224807 [DOI] [Google Scholar]
- 32.Johnson, G., & Holmquist, T. An improved computational constitutive model for brittle materials. In AIP Conference Proceedings, vol. 309 981–984 (American Institute of Physics, 1994).
- 33.Johnson, G. & Holmquist, T. Response of boron carbide subjected to large strains, high strain rates, and high pressures. J. Appl. Phys.10.1063/1.370643 (1999). 10.1063/1.370643 [DOI] [Google Scholar]
- 34.Manes, A., Serpellini, F., Pagani, M., Saponara, M. & Giglio, M. Perforation and penetration of aluminium target plates by armour piercing bullets. Int. J. Impact Eng.69, 39–54 (2014). 10.1016/j.ijimpeng.2014.02.010 [DOI] [Google Scholar]
-
35.Safdarian, R. Forming limit diagram prediction of 6061 aluminum by
 damage model. Mech. Ind.10.1051/meca/2018006 (2018). 10.1051/meca/2018006 [DOI] [Google Scholar]
 -
36.Zhang, J., Liu, L., Zhai, P., Fu, Z. & Zhang, Q. The prediction of the dynamic responses of ceramic particle reinforced
 by using multi-particle computational micro-mechanical method. Compos. Sci. Technol.67, 2775–2785. 10.1016/j.compscitech.2007.02.002 (2007). 10.1016/j.compscitech.2007.02.002 [DOI] [Google Scholar]
 -
37.Zhu, Y. et al. Back-spalling process of an
 ceramic plate subjected to an impact of steel ball. Int. J. Impact Eng.122, 451–471. 10.1016/j.ijimpeng.2018.09.011 (2018). 10.1016/j.ijimpeng.2018.09.011 [DOI] [Google Scholar]
 - 38.Brewer, J. & Lagace, P. Quadratic stress criterion for initiation of delamination. J. Compos. Mater.10.1177/002199838802201205 (1988). 10.1177/002199838802201205 [DOI] [Google Scholar]
-
39.Sayahlatifi, S., Shao, C., McDonald, A. & Hogan, J.
 microstructure-based finite element simulation of cold-sprayed
  composite coatings under quasi-static compression and indentation loading. J. Therm. Spray Technol.31, 102–118. 10.1007/s11666-021-01260-5 (2022).
10.1007/s11666-021-01260-5 [DOI] [PMC free article] [PubMed] [Google Scholar]
composite coatings under quasi-static compression and indentation loading. J. Therm. Spray Technol.31, 102–118. 10.1007/s11666-021-01260-5 (2022).
10.1007/s11666-021-01260-5 [DOI] [PMC free article] [PubMed] [Google Scholar] -
40.Sazgar, A., Movahhedy, M., Mahnama, M. & Sohrabpour, S. Development of a molecular dynamic based cohesive zone model for prediction of an equivalent material behavior for
 composite. Mater. Sci. Eng. A679, 116–122. 10.1016/j.msea.2016.10.001 (2017). 10.1016/j.msea.2016.10.001 [DOI] [Google Scholar]
 - 41.Naguib, M., Gad, S., Megahed, M. & Agwa, M. Computational damage analysis of metal matrix composites to identify optimum particle characteristics in indentation process. Eng. Fract. Mech.295, 109751 (2024). 10.1016/j.engfracmech.2023.109751 [DOI] [Google Scholar]
-
42.Agwa, M., & Pinto da Costa, A. Existence and multiplicity of solutions in frictional contact mechanics. Part
 : Analytical and numerical case study. Eur. J. Mech. A Solids. (2021). 10.1016/j.euromechsol.2020.104063.
-
43.Agwa, M., & Pinto da Costa, A. Existence and multiplicity of solutions in frictional contact mechanics. part
 : A simplified criterion. Eur. J. Mech. A Solids (2021). 10.1016/j.euromechsol.2020.104062.
- 44.Smith, M. ABAQUS/Standard User’s Manual, Version 6.14, Dassault Systèmes Simulia Corp, United States (2014).
-
45.Leu, J. et al. The combination of rolling-and-
 -treatments with
  -reinforcingparticles effect on
  metal-matrix composites. Proc. Inst. Mech. Eng. Part L J. Mater. Des. Appl.230, 233–239. 10.1177/1464420714565433 (2016). 10.1177/1464420714565433 [DOI] [Google Scholar]
 - 46.Newman, M. Power laws, pareto distributions and zipf’s law. Contemp. Phys.46, 323–351 (2005). 10.1080/00107510500052444 [DOI] [Google Scholar]
- 47.Goodman, N. Statistical analysis based on a certain multivariate complex gaussian distribution (an introduction). Ann. Math. Stat.34, 152–177 (1963). 10.1214/aoms/1177704250 [DOI] [Google Scholar]
- 48.Burlayenko, V., Altenbach, H., Sadowski, T., Dimitrova, S. & Bhaskar, A. Modelling functionally graded materials in heat transfer and thermal stress analysis by means of graded finite elements. Appl. Math. Model.45, 422–438 (2017). 10.1016/j.apm.2017.01.005 [DOI] [Google Scholar]
- 49.Attia, M. & El-Shafei, A. Investigation of multibody receding frictional indentation problems of unbonded elastic functionally graded layers. Int. J. Mech. Sci.184, 105838 (2020). 10.1016/j.ijmecsci.2020.105838 [DOI] [Google Scholar]
- 50.Freedman, D., Pisani, R. & Purves, R. Statistics: Fourth International Student Edition, Emersion: Emergent Village Resources for Communities of Faith Series (W.W. Norton & Company, 2007).
Associated Data
This section collects any data citations, data availability statements, or supplementary materials included in this article.
Data Availability Statement
The datasets used during the current study available from the corresponding author on reasonable request.