

Abstract
Ovarian cancer is the second most common and lethal gynecologic malignancy. Among natural product-based therapy, the honeybee products, particularly propolis, serve a valuable source contributing directly to human nutrition and health.
In the present study, we determined the chemical composition of different types of propolis originating from Egypt, Germany and France using liquid chromatography-tandem mass spectrometry. The compounds identified belong to different metabolite classes, including flavonoids, cinnamic acid, chalcones, terpenoids, phenolic lipids, stilbenes, phenolic compounds, carbohydrates, vitamins, coumarins, polyprenylated benzophenone, benzoic acids, fatty acid methyl ester, and coumaric acid, and their derivatives. The most active extract is from France then Egypt and Germany.
Afterwards, we treated the human ovarian cancer cells, OVCAR4, with different concentrations (1–400 μg/mL) of variable propolis types supplemented or not with vitamin D (0.0015–0.15 μg/mL) in order to evaluate the efficacy and the cytotoxic activities of our local P as compared to other types collected from different geographic regions. Importantly, the combinatorial treatment of OVCAR4 cancer cells with propolis and vitamin D in the same concentration ranges resulted in enhanced cell viability inhibition. Furthermore, such co-supplementation with vitamin D inhibits predominately the proliferative activity of cell population with the French propolis type as manifested by Ki67 expression, while it reduces considerably its expression, particularly with the German type, followed by the Egyptian one.
Nowadays, scientists are interested by natural products which have risen to the forefront of drug discovery. Chemically characterized propolis showing cell viability inhibition and antiproliferative potential seems a valuable extract for further consideration as anti-carcinogenic agent.
Graphical abstract

Supplementary Information
The online version contains supplementary material available at 10.1186/s13048-024-01500-6.
Keywords: Propolis, LC-MS/MS, Oxidative stress, Toxicity, OVCAR4
Introduction
Non-communicable diseases (NCDs), including among others cardiovascular diseases, chronic respiratory diseases, cancers, diabetes, urogenital, blood and endocrine diseases, are collectively the leading causes of death and disability in the world. The Global Burden of Diseases (GBD), Injuries, and Risk Factors Study 2019 provides the most up-to-date assessment of a mutually exclusive and collectively exhaustive list of diseases and injuries for 204 countries and territories from 1990 to 2019 [1, 2]. Morbidity and mortality caused by cancer are mainly due to changes in exposure to risk factors. It has been reported that more deaths worldwide are caused by cancer than by cardiovascular diseases [3]. The cancerous process is a result of disturbed cell function due to the accumulation of many genetic and epigenetic aberrations [4, 5]. It is difficult to assess the validity of individual aetiological factors, but it can be concluded that interaction of various risk factors has the largest contribution to the cancer development. Environmental, exogenous and endogenous factors, as well as individual factors including genetic predisposition, contribute to the development of cancer [6, 7].
Ovarian cancer is the second most common and lethal gynecologic malignancy. So far, there is lack of methods recommended for screening and early diagnosis of this disease [8]. Nowadays, scientists are interested in developing naturally-derived drugs [9, 10], particularly that the nature has been the source of life-changing and saving medications for centuries. Plant-derived anticancer constituents including vinblastine, vincristine, paclitaxel, curcumin, colchicine, and lycopene are examples of nature’s gifts to medicine [11]. Among the different honeybee products, propolis (P) serves a valuable source contributing directly to human nutrition and health [12]. The chemical composition of P is diverse and depends on the geographical and botanical origin, i.e., climate factors, plant resources, place of origin, and time in which it was collected by the bees. The specificity of the local flora is the main factor that determines the chemical composition of P and, subsequently, its biological and pharmacological properties [13]. In general, propolis is composed of 50–60% of resins and balms, 30–40% of waxes and fatty acids, 5–10% of essential and aromatic oils, 5–10% of pollen, and about 5% of other substances, such as amino acids, vitamins, macro-, and microelements [14]. Vitamin D which is produced endogenously in the skin by a photochemical reaction is the precursor of 1,25-dihydroxyvitamin D in the organism, a steroid hormone involved in various vital processes in the body, including pathways that inhibit cancer promotion and progression. It has received wide scientific interest in cancer prevention research and cancer therapy as well [15, 16]. Moreover, a bulk of research indicates that low levels of circulating vitamin D are linked to an increased risk of developing cancer, whereas supplementation may further enhance clinical outcomes. These encouraging results nevertheless need additional study and development of cutting-edge strategies that target vitamin D signalling and metabolic systems to enhance cancer therapeutic outcomes [17].
In the present study, we determined the chemical composition of different types of P originating from Egypt (Egy P), Germany (Ger P), and France (Fre P) using liquid chromatography-tandem mass spectrometry (LC-MS/MS). Afterwards, we investigated the in vitro antiproliferative potential of the different types of P against human ovarian cancer cell line supplemented or not with vitamin D in order to mimic the internal environment within the body and maintain a relatively similar biological condition to evaluate the efficacy and the cytotoxic activities of our local P as compared to other types collected from different geographic regions. Our study combined biochemical approaches and molecular biology techniques in order to elucidate the cellular and molecular effects of P against OVCAR4 cancer cells.
Results
Identification of the secondary metabolites from the different types of P
The three different propolis extracts from Egypt, Germany, and France each had a unique metabolomics mass profile that was analyzed using a Global Natural Products Social Molecular Networking (GNPS) network based on tandem mass spectrometry data (Fig. 1; Table 1) in the positive ionization mode [15, 18, 19]. The molecular network’s nodes represented the metabolites, and chemically similar metabolites were grouped together [20]. The parent ions of propolis were assigned 249 colored nodes. The LC-MS/MS analysis of propolis extracts revealed the presence of a complex mixture, and the chemical components of the extracts identified are summarized in Table 1. 57 compounds were identified; 9 parent ions matched nine known standards in the GNP library (Table 1), belonging to flavonoids, cinnamic acids, carbohydrates, vitamins, and fatty acid methyl ester. Pinocembrin, (-)-liquiritigenin, and chlorogenic acid were previously identified from propolis and matched with the GNPS database. 49 compounds were identified previously in propolis as shown in Table 1. The compounds identified belong to different metabolite classes, including flavonoids, cinnamic acid, chalcones, terpenoids, phenolic lipids, stilbenes, phenolic compounds, carbohydrates, vitamins, coumarins, polyprenylated benzophenone, benzoic acids, fatty acid methyl ester, and coumaric acid and their derivatives.
Fig. 1.

Chemical structure of (a) Flavonoids compounds, and (b) Different classes of compounds identified from different propolis extracts using LC–LTQ–MS/MS analysis and assisted Global Natural Product Social (GNPS) molecular networking. The network is represented as a pie chart, where nodes correspond to parent masses of the metabolites. Circular nodes represent unique detected peaks in the molecular networking, while triangle nodes denote parent ions identified in the GNPS molecular networking. Grey nodes are the metabolites detected in the blank solvent and those common between propolis samples and the blank. The metabolites in propolis from Egypt, Germany, and France are represented by aqua, green, and violet colors, respectively. Yellow nodes indicate metabolites that occur in Egyptian and German propolis, while orange nodes denote metabolites common across all three regions’ propolis samples. Blue nodes represent similar metabolites between Egyptian and French propolis, and pink nodes indicate metabolites common between German and French propolis. G1: Propolis from Egypt, G2: Propolis from Germany, G3: Propolis from France, and G4: Blank solvent
Table 1.
Identification of compounds from propolis originating from different regions using LC–LTQ–MS/MS analysis
| Compound name | Rt | m/z | MF | MS2 | Egy P | Ger P | Fre P | Reference |
|---|---|---|---|---|---|---|---|---|
| Flavonoid | ||||||||
| 5-Hydroxy-4"-4"-dimethyl-5"-methyl-5"-H-dihrofurano(2",3"6,6) flavanone | 0.90 | 326.26 | C19H18O5 | 309.2058, 295.0773, 263.2461, 238.5674, 161.1475 | × | - | - | [21] |
| 5,7,3’,4’Tetrahydroxy-6Cgeranylflavanone | 3.02 | 424.03 | C25H28O6 | 407.3767, 390.6158, 348.2471, 321.1401, 314.1860, 301.1189, 287.1748, 271.0090, 252.9539, 177.9554, 122.8480 | - | × | - | [ 21] |
| Propolin D | 3.17 | 424.82 | C25H28O6 | 407.2590, 365.1900 | × | × | × | [22] |
| Genistein | 4.00 | 271.11 | C15H10O5 | 270.9819, 253.0970, 243.0889, 215.2456, 168.7328, 152.9690, 106.9171, 99. 9084, 90.9551 | - | × | × | [23] |
| (2R,3R)-6-[1-(4-Hydroxy-3-methoxyphenyl)prop-2-en-1-yl]pinobanksin | 4.08 | 420.26 | C25H23O7 | 420.0123, 406.0773, 391.1183, 375.2168, 385.1605, 257.1549, 240.1076, 137.0843, 121.0632 | - | × | - | [24] |
| Pinocembrin | 5.13 | 257.26 | C15H12O4 | 229.0510, 215.0090, 211.0410, 172.9770, 152.9330, 102.9960 | × | × | - |
https://bit.ly/3PyvfAO (Access on December 22, 2022) |
| Daidzein | 5.20 | 254.06 | C15H10O4 | 254.9752, 237.1179, 227.0928, 219.1870, 199.0260, 186.9690, 181.2539, 147.0320, 130.0750 | - | × | - | [27] |
| Hesperitin5,7dimethyl ether | 5.34 | 330.11 | C18H18O6 | 313.2244, 298.3091, 282.0153, 267.0806, 251.3294, 236.1053, 220.2451, 179.9206 | - | × | - | [21] |
| (-)-Liquiritigenin | 5.51 | 257.35 | C15H12O4 | 229.0760, 210.9960, 162.06029860, 146.9370,136.9260,119.0250 | × | - | - |
[28] https://bit.ly/3FGNijs (Access on December 22, 2022) |
| Pinostrobin | 6.51 | 269.08 | C16H14O4 | 222.9600, 173.0543, 166.9160, 104.9250, 90.9250 | - | × | - | [23] |
| 3’,5Dihydroxy-4’,7dimenthoxy flavones | 7.21 | 492.49 | C27H24O9 | 474.2940, 330.2830, 312.2600 | × | - | - | [21] |
| Abyssinoflavanone VII | 8.53 | 424.49 | C25H28O6 | 365.2060, 3271710, 281.1140, 150.9727 | - | × | × | [29] |
| 3’,4’-Di-O-benzyl-7-O-(2-hydroxyethyl)-3-O-methylquercetin | 9.38 | 540.18 | C32H28O8 | 523.2446, 479.3914, 371.2449, 327.1682, 231.1650 | - | - | × | [23] |
| Alpinetin | 10.34 | 271.17 | C16H14O4 | 229.0270, 225.04420, 203.0910, 166.9390, 152.8913, 130.9920, 103.0320 | × | × | - | https://bit.ly/3FznPZg (Access on December 22, 2022) |
| Galangin | 10.40 | 270.36.51 | C15H10O5 | 241.8558, 197.0250, 175.9750, 167.0419, 152.9669,131.0289 | × | - | - | [30] |
| 2’-Hydroxyformononetin | 10.80 | 270.24 | C15H10O5 | 241.1118, 237.9930, 214.0370, 182.0510, 162.9420, 136.9990 | × | - | - | [31] |
| Medicarpin | 10.86 | 270.28 | C16H14O4 | 255.0075, 243.0520, 215.0270, 164.9730, 160.9770, 136.9680, 122.9750, 109.0223 | × | - | - | [23] |
| 7-Hydroxy-8-methoxyflavanone | 10.87 | 270.28 | C16H14O4 | 236.9930, 213.0420, 193.0170, 166.9664,118.000 | × | - | - | [26] |
| 7-Hydroxyflavanone | 11.04 | 241.42 |
C15H12O3 : |
213.0680, 194.9880, 162.9450, 136.9680 | × | - | - | https://bit.ly/3Hkdvaa (Access on December 22, 2022) |
| (-)-Melilotocarpan D | 11.23 | 317.21 | C17H16O6 | 301.9946, 299.1074, 285.0340, 178.9790, 162.9990, 152.9891, 138.9329, 134.9960 | × | × | - | [32] |
| Schweinfurthin A | 11.25 | 548.31 | C34H44O6 | 549.6781, 518.8340, 506.3636, 492.3170, 478.5146, 465.4971, 437.2702, 414.8420, 394.1100, 377.7569, 299.3496, 209.9933 | - | × | - | [21] |
| (2R,3R)-pinobanksin 3-(2-methyl)-butyrate | 11.44 | 342.39 | C20H22O5 | 287.0210, 268.9990, 203.0690, 164.4538, | × | - | - | [33] |
| (-)-Mucronulatol | 12.62 | 303.41 | C17H18O5 | 285.0850, 271.0620, 253.9700, 180.0468, 162.9400, 134.9500 | × | - | - | [32] |
| Kaempferide | 13.43 | 300.31 | C17H16O5 | 283.0220, 268.9840, 229.1165, 152.9700, 165.9284, 136.9850, 121.0080 | × | - | - | [30] |
| Rhamnocitrin | 13.50 | 299.54 | C16H12O6 | 299.2303, 271.1616, 209.1653, 165.9840, 137.0400, 122.9660 | × | - | - | [26] |
| 6-(1,1-dimethyl allyl) pinocembrin | 15.15 | 324.85 | C20H20O4 | 307.2065, 293.2345, 265.2312, 221.2634, 214.1630, 95.0537 | × | - | - | [21] |
| Cinnamic acid and its derivatives | ||||||||
| Dihydrocaffeic acid | 0.53 | 182.00 | C9H10O4 | 136.9830, 123.8996, 107.9610 | - | × | - | [34] |
| 3,4-Dimethoxycinnamic acid | 0.76 | 209.04 | C11H12O4 | 191.1121, 162.9759, 133.0046, 102.9836, 76.9730 | - | × | × | [35] |
| Cinnamyl caffeate | 1.35 | 296.14 | C18H16O4 | 279.0237, 238.2185, 193.0850, 162.96600, 148.97 | - | × | - | [36] |
|
Artepillin C (3,5-Diprenyl-4-hydroxycinnamic acid) |
1.63 | 300.17 | C19H24O3 | 300.1414, 283.2649, 255.0471, 199.9463, 145.0778 | - | - | × | [37] |
| Caffeic acid | 2.72 | 180.04 | C9H8O4 | 162.9987, 147.9744, 135.0150, 121.9347 | - | - | × | [38] |
|
(2E)-3-[7-(3-methyl-2-buten-1-yl)-2-(1-methylethenyl)- 5-benzofuranyl]-2-propenoic acid |
2.89 | 296.68 | C19H20O3 | 279.0405, 222.9681, 194.9552, 151.1024, | - | - | × | [39] |
| 3-Prenyl-4-methoxy cinnamic acid | 2,92 | 246.13 | C15H18O3 | 229.0949, 201.0918, 189.0085, 145.0113, 132.8638, 118.7485, 103.9059 | - | - | × | [40] |
| Caffeoyl coumaroyl acetyl glycerol | 3.16 | 442.18 | C23H22O9 | 425.2443, 348.4769, 336.9940, 323.1130, 309.0520, 295.1140, 279.1529, 264.2130, 236.1262, 220.0712, 205.0080, 163.1148, 135.9840 | - | × | - | [30] |
| Dimethoxycinnamic acid | 3.53 | 208.07 | C11H12O4 | 162.9500, 148.9932, 132.9710, 112.9920, 104.9582, 90.9847 | - | × | - | [35] |
|
(2E)-3-(2,2-dimethyl-2H-1-benzopyran- 6-yl)-2-propenoic acid |
6.6 | 230.09 | C14H14O3 | 213.1382, 196.9871, 185.0270, 84.9310 | - | × | - | [39] |
| Chlorogenic acid | 6.95 | 355.14 | C16H18O9 | 319.0590, 309.0720, 162.9400, 135.0260 | × | - | - |
[41] https://bit.ly/3uEPsLr (Access on December 22, 2022) |
| p-Coumaric acid | 11.58 | 165.05 | C9H8O3 | 163.6393, 149.0293, 132.0347, 120.9949 | × | - | - | [28] |
| Chalcones | ||||||||
| 2',6'-Dihydroxy-4'-methoxydihydrochalcone | 5.20 | 272.13100 | C16H16O4 | 255.0665, 224.2262, 195.02 49.0642, 167.9810, 132.9940, 91.0223 | - | - | × | [23] |
| (E,E,E)-4,2’,4’-Trihydroxy-3’-(7’’-hydroxy-3’’,7’’-dimethyloct-2’’,5’’-dienyl)-chalcone | 9.51 | 408.19 | C25H28O5 | 407.4463, 391.2099, 349.2774, 335.7463, 322.8995, 309.0037, 294.1888, 282.1763 | - | - | × | [42] |
| Terpenoids | ||||||||
| Acetylisocupressic acid | 3.37 | 362.25 | C22H34O4 | 362.2958, 345.1349, 330.2925, 317.1249, 302.1115, 288.0924, 274.1560, 247.1904, 149.0241 | - | - | × | [43] |
| Mangiferonic acid | 6.25 | 454.25 | C30H50O | 437.2480, 422.1044, 407.0734, 394.3219, 297.1874, 215.1196 | - | × | - | [44] |
| Poilaneic acid | 12.68 | 302.46 | C20H30O2 | 286.0009, 269.1046,, 255.0537, 241.0055, 227.0801, 122.9624, | × | - | - | [45] |
| Phenolic lipids | ||||||||
| 5-(12’Z-Heptadecenyl)-resorcinol | 4.96 | 346.29 | C23H38O2 | 329.1013, 311.2385, 303.0174, 297.0928, 283.1714, 269.1329, 237.2850, 195.0435, 167.9992, 111.9131 | - | - | × | [44] |
| Stilbenes | ||||||||
| 3,5-Dihydroxy-2-prenyl-E-stilbene | 5.89 | 279.10 | C19H20O2 | 250.9272, 237.8688, 225.1041, 120.9799 | - | × | × | [21] |
| 5,4’-Dihydroxy-3,3’-dimethoxy-2-prenyl-E-stilbene | 12.37 | 340.42 | C21H24O4 | 299.0710, 284.9870, 175.0995, 104.8999 | × | - | - | [46] |
| Phenolic compounds | ||||||||
| Obtusaquinol | 11.65 | 255.64 | C16H16O3 | 256.0338, 240.0186, 223.1327, 150.9319, 135.0651 | × | - | - | [31] |
|
(Z)-1-(2’-methoxy-4’,5’- dihydroxyphenyl)-2-(3-phenyl)propene |
11.67 | 256.39 | 256.0931, 241.0217, 225.1016, 209.0823, 179.0548, 152.9436, 139.9608 | × | - | - | [32] | |
| Trans-3,5-dihydroxy-1,7-diphenyl-hept-1-ene | 16.77 | 282.71 | C19H22O2 | 264.5700, 248.2991, 191.510, 178.8278, 162.0833, 149.0860, 135163.1070, 94.9480 | × | - | - | [21] |
| Carbohydrates | ||||||||
| Glycan 4.β.-Galactobiose | 1.09 | 365.225 | 347.1100, 305.1200, 275.0000, 245.0790, 203.0340, 185.0210 | × | - | - | https://bit.ly/3iUzk69 (Access on December 22, 2022) | |
| D-(+) Cellobiose | 12.21 | 342.12 | C12H22O11 | 342.0950, 325.0200, 307.0130, 289.0140, 259.0080, 217.9598, 203.8954, 198.0400, 162.9530, 126.9540, 108.9790 | × | - | × | https://bit.ly/3j8NRef (Access on December 22, 2022) |
| Vitamin | ||||||||
| Tocopherol | 16.01 | 430.14 | C29H50O2 | 401.3220, 219.1030, 205.0360, 191.0640, 177.0509, 165.0060 | × | - | - | https://bit.ly/3uClwzA (Access on December 22, 2022)) |
| Coumarin | ||||||||
| Esculetin | 2.77 | 178.03 | C9H6O4 | 149.9676, 133.0174, 122.9413,104.9516 | - | - | × | [47] |
| Gambogenone | 4.71 | 452.55 | C27H32O6 | 435.3546,417.1204, 326.6595, 295.0794 | - | × | × | [21] |
| Benzoic acid | ||||||||
| 4-Methoxybenzoic acid | 14.93 | 153.06 | C8H8O3 | 153.0307, 134.9597, 91.9711, 107.87, 89.9705, 67.9884, 62.8947 | - | - | × | [48] |
| Fatty acid methyl ester | ||||||||
| cis-7-Hexadecenoic acid methyl ester | 15.04 | 269.37 | C17H32O2 | 237.1210, 219.1780, 199.1270, 185.1370, 163.0620, 157.0760, 109.0590 | × | - | - | https://bit.ly/3V63IYh (Access on December 22, 2022) |
| Coumaric acid and its derivatives | ||||||||
| 2-Acetyl-1,3-diferuloylglycerol | 14.53 | 485.91 | C25H26O10 | 467.3230, 321.2061892, 309.1245 | × | - | - | [25] |
Flavonoids are the most predominant class (Table 1). The abundance of the class was in the elution range (Rt 1–15 min). Based on Tables 1, 26 compounds have been identified, the LC-MS revealed that propolin D was detected in Egy P, Ger P, and Fre P. Pinocembrin, alpinetin, and (-)-melilotocarpan D were detected in Egy P and Ger P. Furthermore, genistein, abyssinoflavanone VII, and gambogenone were detected in Ger P and Fre P.
Cinnamic acid and its derivatives, 3,5-diprenyl-4-hydroxycinnamic acid, caffeic acid, (2E)-3-[7-(3-methyl-2-buten-1-yl)-2-(1-methylethenyl)-5-benzofuranyl]-2-propenoic acid, and 3-prenyl-4-methoxy cinnamic acid were detected in Fre P while chlorogenic acid and p-coumaric acid characterized the Egy P. Dihydrocaffeic acid, cinnamyl caffeate, caffeoyl coumaroyl acetyl glycerol, dimethoxycinnamic acid, and (2E)-3-(2,2-dimethyl-2 H-1-benzopyran-6-yl)-2-propenoic acid were determined in Ger P. Acetylisocupressic acid and belong to terpenoids and were detected in Fre P. Mangiferonic acid and poilaneic acid were identified in Ger P and Egy P, respectively. 3,5-dihydroxy-2-prenyl-E-stilbene and Gambogenone were detected in both Ger P and Fre P.
P affected ovarian cell viability
The effect of P and/or Vit D on the growth of OVCAR4 ovarian cancer cells is presented in Fig. 2 MTT. Vit D at different concentrations (from 0.0015 to 0.15 μg/mL) produced marked growth inhibition with an IC50 of 0.035 ± 0.002 μg/mL (Fig. 2a). It exhibited a concentration-dependent cytotoxic effect, where exposure to the P concentration range (1–400 μg/mL) inhibited cell viability with an IC50s of 100.335 ± 1.38 μg/mL and 86.064 ± 2.09 μg/mL for Ger P and Egy P, respectively (Fig. 2b, c). While Fre P exerted the lowest IC50 equivalent to 75.040 ± 1.45 μg/mL among all other propolis (Fig. 2d). Additionally, the combination of P (from different geographical sources) and Vit D in the same concentration ranges resulted in enhanced cell viability inhibition with a combined IC50 values of 47.4701 ± 1.27 (47.4519 μg/mL for Ger P + 0.01815 μg/mL for Vit D; Fig. 3a), 38.7193 ± 1.79 (38.7045 μg/mL for Egy P + 0.01480 μg/mL for Vit D; Fig. 3b) and 37.0036 ± 1.41 (36.9895 μg/mL for Fre P + 0.01415 μg/mL for Vit D; Fig. 3c).
Fig. 2.

The viability of OVCAR4 ovarian cancer cells treated with different concentrations of Vit D (0.0015–0.15 μg/mL) (a), or with different concentrations of Propolis (1–400 μg/mL) from different geographical sources Ger P (b), Egy P (c) and Fre P (d), data points represent the mean ± SEM (standard error of mean), each performed in triplicate. *p < 0.05 indicates a significant difference for different types of P and Vit D vs. the corresponding control group
Fig. 3.

The viability of OVCAR4 ovarian cancer cells treated with combination of different concentrations of Vit D (0.0015–0.15 μg/mL) and with different concentrations of Propolis (1–400 μg/mL) from different geographical sources Ger P (a), Egy P (b) and Fre P (c), Data points represent the mean ± SEM (standard error of mean), each performed in triplicate. *p < 0.05 indicates a significant difference for different types of P and Vit D vs. the corresponding control group
Combination index (CI) and dose reduction index (DRI) of different types of P and Vit D
To examine the combined effects of different types of P and Vit D on OVCAR4 ovarian cancer cells, synergy experiments were performed. These cells were treated experimentally with different geographical sources of P, Vit D, or combination of both drugs, and CompuSyn software was used to determine the type of drug interaction between the agents. Table 2 presents the CIs detected using CompuSyn software after treatment of OVCAR4 cells with different combinations of the different types of P and Vit D. CIs values at IC50 were 0.984, 0.866 and 0.891, for Ger P + Vit D, Egy P + Vit D and Fre P + Vit D, respectively. These results demonstrate a CI value < 1 at IC50, revealing a synergistic relationship between the different types of P and Vit D at IC50 levels in the OVCAR4 cell line (Table 2). Additionally, Table 2 shows that at IC50 (50% inhibition achieved by the combination), the concentration of the different types of P and Vit D in their combinations were reduced by around two folds than their IC50 of each drugs alone, as depicted with the relevant DRI values. These observations support the hypothesis that co-supplementation of Vit D with different types of P, enhance the antitumor activities on OVCAR4 ovarian cancer cell line.
Table 2.
CIs (combination indices) (eq. 1) and DRIs obtained using CompuSyn software to analyse OVCAR4 ovarian cell viability inhibition resulting from treatment with the combination of vit D (0.0015–0.153 μg/mL) and different geographical sources of P (1–8400 μg/mL) for 48 h
| At the level of Effective dose that induce 50% cellular viability inhibition | |||||||
|---|---|---|---|---|---|---|---|
| CI value | Concentration of each drug alone (μM) | Concentration of each drug in combination (μM) | DRI Vit D |
DRI of corresponding P |
|||
| IC50 of Vit D (μg/mL) |
IC50 of selected geographical species of P (μg/mL) |
IC50 of Vit D (μg/mL) |
IC50 of selected geographical species of P (μg/mL) |
||||
| Ger P + Vit D | 0.984 | 0.035 | 100.355 | 0.018 | 47.451 | 2.11 | 1.9 |
| Egy P + Vit D | 0.866 | 0.035 | 86.064 | 0.014 | 38.704 | 2.39 | 2.22 |
| Fre P + Vit D | 0.891 | 0.035 | 75.040 | 0.014 | 36.989 | 2.50 | 2.02 |
Equation 1, combination index32: CI = E (ca.) E (da) + E (cb) E (db)
Where; CI = combination index
E (ca.) = effect for drug a in combination
E (cb) = effect for drug b in combination
E (da) = effect of drug a alone
E (db) = effect of drug b alone
P affected cell proliferation
In an attempt to further clarify whether P treatment co-supplemented or not with Vit D affects the tumorigenicity of OVCAR4 cells, we investigated the expression of Ki67 which is a nuclear protein that is tightly linked to the cell cycle. Ki67 is associated with the proliferative activity of cell populations in malignant tumors, allowing it to be used as a marker for tumor progression [49]. In our experiment, the proliferative activity of OVCAR4 cells treated with P originating from different geographical regions is well manifested by Ki67 immnunofluorescent staining (Fig. 4). Co-supplementation with Vit D inhibits predominately the proliferative activity of cell population with the Fre P as manifested by Ki67 expression, while it reduces considerably Ki67-positive cells, particularly with the Ger P, followed by the Egy P.
Fig. 4.
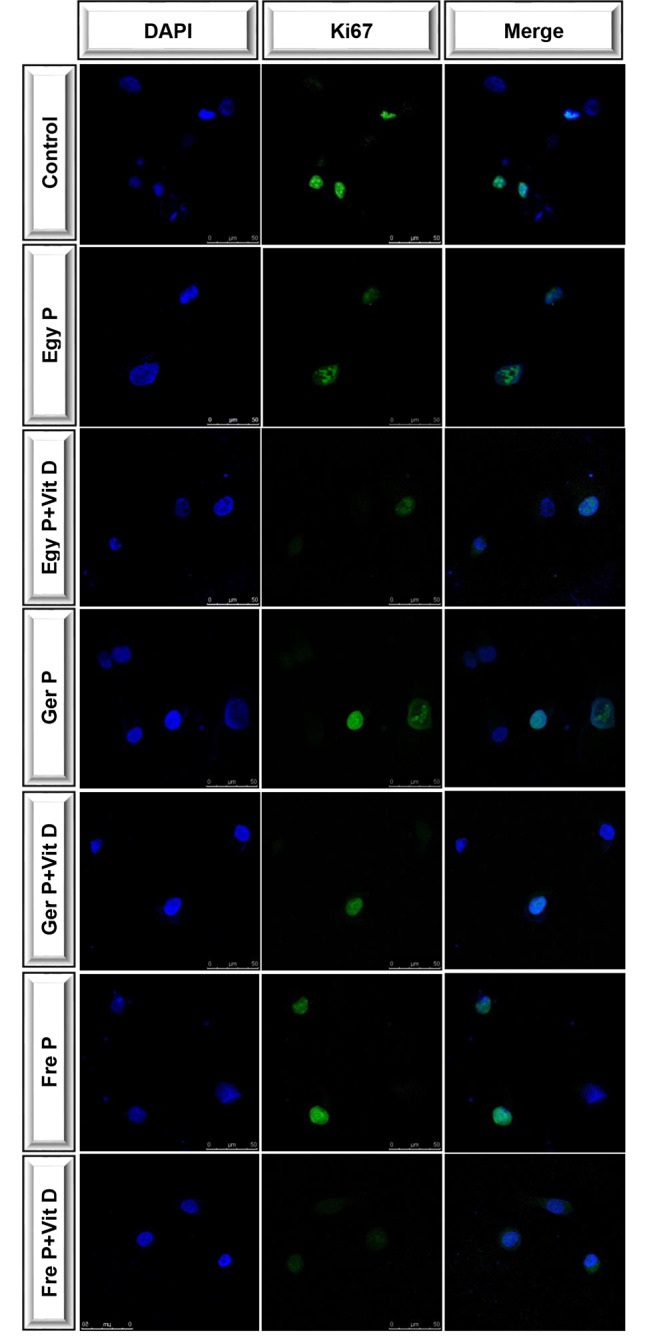
Immunofluorescence with the proliferative marker, Ki67. Human OVCAR4 cells were incubated for 48 h. with the IC50s of P from different geographical origin either alone or co-supplemented with vitamin D using the results obtained from Drug Reduction Indices analysis which were briefly as follow: 38.7045 μg/mL for Egy P + 0.01480 μg/mL for Vit D, 47.4519 μg/mL for Ger P + 0.01815 μg/mL for Vit D, and 36.9895 μg/mL for Fre P + 0.01415 μg/mL for Vit D. The left column was stained with DAPI to indicate the nuclei; the middle column was stained with Ki67 to indicate proliferation; and the right column contains the merged images. Scale bar: 50 μm
Discussion
Globally, ovarian cancer remains among the leading cause of death with regard to gynecological cancers. The standard treatment is cytoreductive surgery combined to chemotherapy. The response rate to first-line therapy is around 80–90%, but most patients relapse and develop chemotherapy resistance and the 5-year survival rate is < 30% [50].
Propolis is undoubtedly a naturally occurring extract with a complex chemical composition that contains a wide range of physiologically active phytochemicals, including flavonoids, terpenes, alcohols, phenolic acids, and their derivatives, which may have a variety of biological potentials [51, 52]. Propolis’ chemical composition is significantly influenced by plant origin, geography, climate, harvest times, and genetic variations across bee races [53–55]. In the current study, the propolis from different geographic regions including Egypt, Germany and France exerts anticancer properties against OVCAR4 cancer cells. The most active extract is from France then Egypt and Germany.
Chemically propolis is composed of more than 180 different types of chemicals. As a result more than 300 different components have been previously identified in propolis collected from different regions. The percentage of diverse material present in propolis depends upon the time of its collection and also on the geographical origin [14, 56, 57]. Our LC-MS/MS analysis resulted in the identification of 57 compounds; 49 of which were actually found in propolis and are shown in Table 1. Each propolis sample was characterized by a number of specific and/or common metabolites (Fig. 5). The number of specific compounds were 11, 24, and 12 (Fig. 5A), classified into 7, 9, and 3 categories (Fig. 5B) for Fre P, Egy P, and Ger P, respectively. Even though flavonoid, cinnamic acid and its derivatives, and terpenoides are common in the different types of propolis, it is important to mention that the most abundant flavonoid is reported in Egy P including 13 metabolites, while the Ger P revealed plentiful of cinnamic acid and its derivatives including 5 compounds (Table S1). Artepillin C and caffeic acid, which were identified in our study only in the Fre P, are among the major anti-cancer ingredients of propolis1. The highest antiproliferative potential of Fre P may be therefore due to the presence of these two compounds. Artepillin C has been shown to exert direct antiproliferative, cytotoxic and apoptotic effects both in vitro on breast [58], colon [59] or lung cancer cells [1] and in vivo by inhibiting the growth of mice xenografts [60–62]. A recent study shows that artepillin C potently sensitized the resistant prostate cancer cells to treatment by inducing apoptotic cell death due to mitochondrial dysfunction [63]. Moreover, caffeic acid and its derivatives have been reported as potential modulators of oncogenic molecular pathways in a huge variety of cancer cells including, but not limited to, melanoma [64], colorectal [65], glioblastoma [66], osteosarcoma [67], and prostate cancer [68]. Similarities and variances in the rest of metabolites among the propolis samples originating from different regions were reported. Previous identification of pinocembrin, galangin, p-coumaric acid, and caffeic acid in Egy P, Ger P, and Fre P were noted [69–71]. Pinocembrin is a compound that was isolated from propolis and has anticancer properties on two different types of human colon cancer cells [72]. Galangin’s anti-cancer properties were shown. Human colon cancer cells were exposed to galangin, which caused apoptosis and DNA condensation in a dose-dependent way [73].
Fig. 5.

Venn diagram illustrating (A) The distribution of the number of specific and/or common metabolites in the different types of propolis analyzed, and (B) The different categories of specific metabolites identified by LC-MS/MS analysis in each type of propolis
Propolis and its derivatives also have anticancer properties. The fundamental mechanisms underlying the development of cancer, including cell proliferation, evading apoptosis, angiogenesis, invasion, and metastasis, can be influenced by both propolis extracts and active chemicals. Propolis anticancer properties rely on its bioactive components, mainly flavonoid, phenolic, and aromatic component composition [70].
Vitamin D, traditionally known as an essential nutrient, is a precursor of a potent steroid hormone that regulates a broad spectrum of physiological processes. Accumulating data reported deficiency and/or dysregulated metabolism and functions of vitamin D in many types of cancer confirming thereby its antitumorigenic effects which are mainly best understood in colorectal, breast, and prostate cancer and much less in ovarian cancer [15, 74] In accordance with previous studies, our results demonstrated that the inhibitory effect of propolis on the proliferative activity of OVCAR4 cell population is augmented by vitamin D co-supplementation (Fre P > Ger P > Egy P). Such a synergism between propolis and vitamin D is confirmed by the decreased expression of ki67 which is a proliferative marker used routinely in the pathologic evaluation for all cancers. Moreover, in agreement with this finding, previous observational studies reported an inverse correlations of serum vitamin D with ki67 expression [75–77]. However, Lawler et al. observed no associations between serum vitamin D and ki67 marker expression in colorectal cancer patients, whereas an inverse association between vitamin D binding protein and tumor Ki67 explains the reduced mortality [78].
Limitations
Although in vitro studies have massively promoted our understanding of mechanism of action of cancer progression and development, our work has some limitations that have to be taken into account: (i) We have tested the effects of the different propolis types on one kind only of human ovarian cancer cell line (OVCAR4). Comparaison between several kinds of ovarian cance cell line will be envisageable in future investigation, (ii) There are difficulties in simulating the consequences of long term treatment in vitro, and finally (iii) We cannot accurately replicate neither the inherent complexity of organ cells in living organisms nor the internal environment of human body.
Conclusions
Ovarian cancer ranks among the deadliest gynecologic malignancy. Natural products were explored as an adjuvant treatment to improve therapeutic outcomes. LC–LTQ–MS/MS analysis of three different propolis originating from Egypt, Germany and France allowed for metabolites characterization as well as the investigation of compositional heterogeneity. Herein, we identified 57 compounds classified into 13 categories, of which flavonoid and cinnamic acid and its derivatives contain the most abundant metabolites. Fre P has shown the highest cell viability inhibition in human OVCAR4 ovarian cancer cells supplemented or not with vitamin D, followed by Egy P, and then, Ger P. This finding may be because the Fre P is the only type that contains artepillin C and caffeic acid which are among the major anti-cancer ingredients of propolis. Moreover, our results provided evidence for the differential antiproliferative efficacy in vitro of each propolis sample (Fre P > Ger P > Egy P) as manifested by Ki67 expression. Also, the demonstrated synergism between P and Vit D in the present investigation will permit further dose reduction of both drugs in future studies while preserving their anticarcinogenic effects. Altogether, propolis seems a valuable anticarcinogenic agent for further consideration. It has also the potential to upgrade ovarian cancer cells chemotherapeutic agents.
Materials and methods
Propolis samples
Liquid vitamin D (Art-Nr 54401) was purchased from Unimedic Pharma (Matfors, Sweden). Three different kinds of P were used in this study: raw Egy P was obtained from the Apiary of Department of Bee Research, Plant Protection Research Institute, Agricultural Research Agriculture Research Center at Dokki, Giza, Egypt. Ger P powder (Art-Nr 1334) was purchased from Aspermühle, Naturwaren-Niederrhein GmbH (Goch-Asperden, Germany), while Fre P powder (Ref. POUPROP40) was obtained from Propolia, Apimab laboratoires (Avenue du Lac, Clermont l’Hérault, France).
Extraction of propolis
Egyptian propolis was extracted using ethanol. In brief, 5 g of the raw material was dissolved three times in 100 mL of ethanol. The suspension was filtered using Whatman filter paper (No. 1). The filtrate was evaporated to near-dryness using a rotary evaporator at low pressure. The propolis extract was stored in the refrigerator until used.
Chemical analysis of propolis extracts
Extracts of propolis were analyzed using LC–MS/MS in positive ion modes. A Shimadzu LC-10 high performance liquid chromatography (HPLC) with a Grace Vydac Everest Narrowbore C18 column (100 mm × 2.1 mm i.d., 5 μm, 300 Å). LC-MS, connected to an LCQ electrospray ion trap MS (Thermo Finnigan, San Jose, CA) was utilized with a mass range of 200–5000 m/z. A 2 μL sample was injected using an autosampler. The solvents used were 95% H2O in formic acid (0.1%) (A) and 95% acetonitrile in formic acid (0.1%) (B). Gradient elution ranged from 5 to 95% solvent (B), then column conditioning to 5% solvent (B) at 300 μL/min flow rate. The elution time was 40 min.
Foundation 3.1 Xcalibur 3.1.6610 was used to analyze the data. Additionally, MS Convert from the ProteoWizard suite (http://proteowizard.sourceforge.net/tools.shtml; access on 12 November 2022) was used to convert the raw data files to mzXML format. GNPS online workflow was used to generate the molecular network [18, 19]. GNPS was generated for the positive ions using the following parameters: parent mass tolerance of 2 Da and an MS/MS fragment ion tolerance of 0.5 Da. The network’s spectra were then validated against the spectral libraries and literature data of GNPS. Cytoscape software was used to analyze and edit the molecular networks. The parent mass of each node served as a label. A pie slice proportionates to the number of MS/MS spectra for each parent mass and a color designating the source of the sample [79].
Cell culture
Human OVCAR4 cells were maintained in Dulbecco’s Modified Eagle Medium (DMEM) with a low content of glucose (1 g/L) and supplemented with 10% fetal bovine serum (FBS), 1 mM glutamine, 1% antibiotics (penicillin-streptomycin) and 1 mM pyruvate at 37 °C under a humidified atmosphere containing 5% CO2. Cells were subcultured using a solution of 0.25% trypsine-0.25 mM ethylene-diaminetetraacetic acid (EDTA) and the medium was changed twice a week. Cell line was checked before the experiment to ensure it is mycoplasma-free. Each treatment group was made of 3 replicas of 3 independent experiments and maintained for 48 h.
MTT assay
Cell viability was measured by MTT assays [80]. A total of 5 × 10³ cells/well was seeded onto a 96-well plate and incubated at 37 °C. After 24 h, the culture medium of each well was replaced with fresh medium and cells were treated with different concentrations (1–400 μg/mL), of P from different geographical sources, and/or Vit D (0.0015–0.15 μg/mL). In each experiment, complete growth medium without any treatment was also used as a control. Cells were incubated at 37 °C for 48 h. Then, cytotoxicity studies were done to determine via the survival curves the concentration of P with or without vitamin D co-supplementation that reaches 50% growth inhibition (IC50) using MTT assay. The media were therefore removed and 200 μL of MTT (3-(4,5-dimethylthiazol-2-yl)-2,5-diphenyltetrazolium bromide) solution at a final concentration of 1 mg/mL was added and left in darkness for 4 h, after which the MTT was removed and 100μL of dimethyl sulfoxide (DMSO) was added. Absorbance was measured in a microplate reader spectrophotometer at 560 nm. Each sample was tested in three independent sets with triplicate points. Values were expressed as the mean ± SEM of at least three independent experiments and represented graphically.
Analysis of the anti-proliferative effect of the drug combination
The hypothesized anti-tumour interaction between P and Vit D on OVCAR4 cells was evaluated using an MTT assay. Cells were incubated with P and/or Vit D using the same concentration ranges used in the former study for 48 h, and the cytotoxicity was assessed. To quantify the interaction synergism or antagonism, the combination index (CI) was determined as described by Chou [50], where CI < 1 indicates synergism, = 1 indicates additive action and > 1 indicates antagonistic effects. Moreover, the dose reduction index (DRI), expressed as the synergy of the combination of two drugs, was calculated as the fold-decrease in the dose of each drug independently related to their dose in combination using CompuSyn software, version 1 [53].
Immunofluorescence Assay
Cells were grown on coverslips coated with poly-L-lysine and incubated for 48 h. with the IC50 concentrations of P from different geographical origin either alone or co-supplemented with vitamin D using the results obtained from Drug Reduction Indices (DRIs) analysis demonstrated in Table 2 which were briefly as follow: (47.4519 μg/mL for Ger P + 0.01815 μg/mL for Vit D, 38.7045 μg/mL for Egy P + 0.01480 μg/mL for Vit D, 36.9895 μg/mL for Fre P + 0.01415 μg/mL for Vit D.
Treated cells were then washed with PBS and fixed in 4% paraformaldehyde for 15 min. After washing 3 times with PBS for 5 min, the samples were air-dried, blocking solution was added to the slides and the cells were incubated for 5 min at room temperature, after which the blocking solution was drained away. The samples were incubated overnight with anti-Ki67 (proliferation marker), 100 μL/slide (1:500 dilution with PBS) at 4 °C. Cells were washed three times with PBS, 5 min each wash, and subsequently incubated for 1 h at room temperature with Alexa-Fluor-488 antibody. Cell nuclei were stained with 4,6-diamidino-2-phenylindole (DAPI) for 3 min at room temperature. Cells stained with DAPI were washed with PBS for 30 min, and fluorescence was observed using a Zeiss Axioplan 2 fluorescence microscope. Images were taken from five visible fields of interest from each immunocytochemical staining slides (×40). The ratio of stained positive nuclei to unstained negative ones was counted in randomly chosen 40× magnification fields.
Statistical analysis
Data were expressed as the mean ± SEM. A one-way analysis of variance (ANOVA) followed by post hoc Tukey’s multiple comparison test was used to analyse multiple comparisons, and the differences were considered significant at p < 0.05. All statistical analyses and graphical data presentations were performed using Graph Pad Prism® software package version 6 (GraphPad Software Inc., CA, USA).
Electronic supplementary material
Below is the link to the electronic supplementary material.
Acknowledgements
The human ovarian cancer cell line, OVCAR4, was a gift from Prof. Håkan Hedman Laboratory at Umeå University, Sweden to Prof. Abeer El Wakil.
Author contributions
L.M.E. and A.E.W.: Conceptualization, project administration, and supervision; E.A., M.W.H., A.A.E., and A.E.W.: Methodology, validation, resources; E.H.R., K.K.A., and L.M.E.: Reviewing the manuscript. M.W.H., A.A.E., and A.E.W.: writing, reviewing and editing the manuscript. All authors have read and agreed to the submitted version of the manuscript.
Funding
Open access funding provided by The Science, Technology & Innovation Funding Authority (STDF) in cooperation with The Egyptian Knowledge Bank (EKB).
Data availability
All data generated and analyzed in this study are included in this article.
Declarations
Ethics approval
Not applicable.
Consent to participate
Not applicable.
Competing interests
The authors declare no competing interests.
Footnotes
Publisher’s note
Springer Nature remains neutral with regard to jurisdictional claims in published maps and institutional affiliations.
References
- 1.Takahashi H, et al. 1,2,3-Triazolyl esterization of PAK1-blocking propolis ingredients, artepillin C (ARC) and caffeic acid (CA), for boosting their anti-cancer/anti-PAK1 activities along with cell-permeability. Drug Discov Ther. 2017;11:104–9. 10.5582/ddt.2017.01009 [DOI] [PubMed] [Google Scholar]
- 2.Abbafati C, et al. Global burden of 369 diseases and injuries in 204 countries and territories, 1990–2019: a systematic analysis for the global burden of Disease Study 2019. Lancet. 2020;396:1204–22. 10.1016/S0140-6736(20)30925-9 [DOI] [PMC free article] [PubMed] [Google Scholar]
- 3.Bray F, et al. Comparing cancer and cardiovascular disease trends in 20 middle- or high-income countries 2000–19: a pointer to national trajectories towards achieving Sustainable Development goal target 3.4. Cancer Treat Rev. 2021;100:102290–7. 10.1016/j.ctrv.2021.102290 [DOI] [PMC free article] [PubMed] [Google Scholar]
- 4.Dumitrescu RG. Interplay between genetic and epigenetic changes in breast cancer subtypes. Cancer Epigenetics Precision Med. 2018;1856:19–34. 10.1007/978-1-4939-8751-1_2 [DOI] [PubMed] [Google Scholar]
- 5.Zhang L, Lu Q, Chang C. Epigenetics in health and disease. Adv Exp Med Biol. 2020;1253:3–55. 10.1007/978-981-15-3449-2_1 [DOI] [PubMed] [Google Scholar]
- 6.Lewandowska AM, Rudzki M, Rudzki S, Lewandowski T, Laskowska B. Environmental risk factors for cancer - review paper. Ann Agric Environ Med. 2019;26:1–7. 10.26444/aaem/94299 [DOI] [PubMed] [Google Scholar]
- 7.Bishop KS, Ferguson LR. The interaction between epigenetics, nutrition and the development of cancer. Nutrients. 2015;7:922–47. 10.3390/nu7020922 [DOI] [PMC free article] [PubMed] [Google Scholar]
- 8.M S. Ovarian cancer: an overview. Radiol Technol. 2020;91:561–75. [PubMed] [Google Scholar]
- 9.El-Seedi HR, et al. Exploring natural products-based cancer therapeutics derived from Egyptian flora. J Ethnopharmacol. 2021;269:113626–61. 10.1016/j.jep.2020.113626 [DOI] [PubMed] [Google Scholar]
- 10.Ouyang Y, et al. Cancer-fighting potentials of algal polysaccharides as nutraceuticals. Food Res Int. 2021;110522–35. 10.1016/j.foodres.2021.110522 [DOI] [PubMed]
- 11.Khan AW, Farooq M, Haseeb M, Choi S. Role of plant-derived active constituents in cancer treatment and their mechanisms of action. Cells. 2022;11:1–48. 10.3390/cells11081326 [DOI] [PMC free article] [PubMed] [Google Scholar]
- 12.Pasupuleti VR, Sammugam L, Ramesh N, Gan SH. Honey, propolis, and royal jelly: A comprehensive review of their biological actions and health benefits. Oxid. Med. Cell. Longev. 2017, (2017). [DOI] [PMC free article] [PubMed]
- 13.Forma E. Anticancer activity of propolis and its compounds. Nutrients. 2021;13:2594–613. 10.3390/nu13082594 [DOI] [PMC free article] [PubMed] [Google Scholar]
- 14.Anjum SI, et al. Composition and functional properties of propolis (bee glue): a review. Saudi J Biol Sci. 2019;26:1695–703. 10.1016/j.sjbs.2018.08.013 [DOI] [PMC free article] [PubMed] [Google Scholar]
- 15.Piatek K, Schepelmann M, Kallay E. The effect of vitamin d and its analogs in ovarian cancer. Nutrients. 2022;14:3867–76. 10.3390/nu14183867 [DOI] [PMC free article] [PubMed] [Google Scholar]
- 16.Carlberg C, Velleuer E. Vitamin D and the risk for cancer: a molecular analysis. Biochem Pharmacol. 2022;196:114735–44. 10.1016/j.bcp.2021.114735 [DOI] [PubMed] [Google Scholar]
- 17.Websky K, Von, Abdallah A, Reichetzeder C, Tsuprykov O. The impact of vitamin D on pregnancy-related disorders and on o ff spring outcome. J Steroid Biochem Mol Biol. 2018;180:51–64. 10.1016/j.jsbmb.2017.11.008 [DOI] [PubMed] [Google Scholar]
- 18.Darwish AMG, et al. Chemical profiling and nutritional evaluation of bee pollen, bee bread, and royal jelly and their role in functional fermented dairy products. Molecules. 2023;28:227–53. 10.3390/molecules28010227 [DOI] [PMC free article] [PubMed] [Google Scholar]
- 19.El-Din MIG, Fahmy NM, Wu F, Salem MM, Khattab OM, El-Seedi HR, Korinek M, Hwang TL, Osman AK, El-Shazly M, Fayez S. Comparative LC–LTQ–MS–MS analysis of the leaf extracts of Lantana camara and Lantana montevidensis growing in Egypt with insights into their anti-inflammatory, and cytotoxic activities. Plants. 2022;11:1699–719. 10.3390/plants11131699 [DOI] [PMC free article] [PubMed] [Google Scholar]
- 20.Abosedera DA, et al. Metabolomic profile and in vitro evaluation of the cytotoxic activity of Asphodelus microcarpus against human malignant melanoma cells A375. Arab J Chem. 2022;15:104174–87. 10.1016/j.arabjc.2022.104174 [DOI] [Google Scholar]
- 21.Hossain R, et al. Propolis: an update on its chemistry and pharmacological applications. Chin Med (United Kingdom). 2022;17:100–59. [DOI] [PMC free article] [PubMed] [Google Scholar]
- 22.Su KY, et al. Taiwanese green propolis and propolin G protect the liver from the pathogenesis of fibrosis via eliminating TGF-β-induced Smad2/3 phosphorylation. J Agric Food Chem. 2014;62:3192–201. 10.1021/jf500096c [DOI] [PubMed] [Google Scholar]
- 23.Corrêa FRS, Schanuel FS, Moura-Nunes N, Monte-Alto-Costa A, Daleprane JB. Brazilian red propolis improves cutaneous wound healing suppressing inflammation-associated transcription factor NFκB. Biomed Pharmacother. 2017;86:162–71. 10.1016/j.biopha.2016.12.018 [DOI] [PubMed] [Google Scholar]
- 24.Li F, He YM, Awale S, Kadota S, Tezuka Y. Two new cytotoxic phenylallylflavanones from Mexican propolis. Chem Pharm Bull. 2011;59:1194–6. 10.1248/cpb.59.1194 [DOI] [PubMed] [Google Scholar]
- 25.Shi H, et al. Isolation and characterization of five glycerol esters from Wuhan propolis and their potential anti-inflammatory properties. J Agric Food Chem. 2012;60:10041–7. 10.1021/jf302601m [DOI] [PubMed] [Google Scholar]
- 26.Agüero MB, et al. Argentinean propolis from Zuccagnia punctata cav. (Caesalpinieae) exudates: phytochemical characterization and antifungal activity. J Agric Food Chem. 2010;58:194–201. 10.1021/jf902991t [DOI] [PubMed] [Google Scholar]
- 27.Picolotto A, et al. Bacterial cellulose membrane associated with red propolis as phytomodulator: improved healing e ff ects in experimental models of diabetes mellitus. Biomed Pharmacother. 2019;112:108640–9. 10.1016/j.biopha.2019.108640 [DOI] [PubMed] [Google Scholar]
- 28.Lotti C, et al. Constituents of hondurian propolis with inhibitory effects on saccharomyces cerevisiae multidrug resistance protein pdr5p. J Agric Food Chem. 2012;60:10540–5. 10.1021/jf302578r [DOI] [PubMed] [Google Scholar]
- 29.Massaro CF, Simpson JB, Powell D, Brooks P. Chemical composition and antimicrobial activity of honeybee (Apis mellifera ligustica) propolis from subtropical eastern Australia. (2015) 10.1007/s00114-015-1318-z [DOI] [PubMed]
- 30.Ristivojević P, Trifković J, Gašić U, Andrić F, Nedić N, Tešić Ž, Milojković-Opsenica D. Ultrahigh-performance liquid chromatography and mass spectrometry (UHPLC–LTQ/Orbitrap/MS/MS) study of phenolic profile of Serbian poplar type propolis. Phytochem Anal. 2015;26:127–36. 10.1002/pca.2544 [DOI] [PubMed] [Google Scholar]
- 31.Ożarowski M, Karpiński TM, Alam R, Łochyńska M. Antifungal properties of chemically defined propolis from various geographical regions. Microorganisms 10, (2022). [DOI] [PMC free article] [PubMed]
- 32.Lotti C, et al. Chemical constituents of red Mexican propolis. J Agric Food Chem. 2010;58:2209–13. 10.1021/jf100070w [DOI] [PubMed] [Google Scholar]
- 33.Athikomkulchai S, Awale S, Ruangrungsi N, Ruchirawat S, Kadota S. Chemical constituents of Thai propolis. Fitoterapia. 2013;88:96–100. 10.1016/j.fitote.2013.04.008 [DOI] [PubMed] [Google Scholar]
- 34.Gardana C, Simonetti P. Evaluation of allergens in propolis by ultra-performance liquid chromatography/tandem mass spectrometry. Rapid Commun Mass Spectrom. 2011;25:1675–82. 10.1002/rcm.5025 [DOI] [PubMed] [Google Scholar]
- 35.Guzmán-Gutiérrez SL, et al. Mexican propolis: a source of antioxidants and anti-inflammatory compounds, and isolation of a novel chalcone and ε-caprolactone derivative. Molecules. 2018;23:334–49. 10.3390/molecules23020334 [DOI] [PMC free article] [PubMed] [Google Scholar]
- 36.Sun LP, et al. Chrysin: a histone deacetylase 8 inhibitor with anticancer activity and a suitable candidate for the standardization of Chinese propolis. J Agric Food Chem. 2012;60:11748–58. 10.1021/jf303261r [DOI] [PubMed] [Google Scholar]
- 37.Moncla BJ, Guevara PW, Wallace JA, Marcucci MC. The inhibitory activity of typifi ed propolis against Enterococcus species. Z für Naturforsch C. 2012;67:249–56. [DOI] [PubMed] [Google Scholar]
- 38.Alanazi S, Alenzi N, Alenazi F, Tabassum H, Watson D. Chemical characterization of Saudi propolis and its antiparasitic and anticancer properties. Sci Rep. 2021;11:5390–8. 10.1038/s41598-021-84717-5 [DOI] [PMC free article] [PubMed] [Google Scholar]
- 39.Nakashima KI, Murakami T, Tanabe H, Inoue M. Identification of a naturally occurring retinoid X receptor agonist from Brazilian green propolis. Biochim Biophys Acta - Gen Subj. 2014;1840:3034–41. 10.1016/j.bbagen.2014.06.011 [DOI] [PubMed] [Google Scholar]
- 40.Nina N, et al. Chemical profiling and antioxidant activity of Bolivian propolis. J Sci Food Agric. 2016;96:2142–53. 10.1002/jsfa.7330 [DOI] [PubMed] [Google Scholar]
- 41.Mavri A, et al. Chemical properties and antioxidant and antimicrobial activities of Slovenian propolis. Chem Biodivers. 2012;9:1545–58. 10.1002/cbdv.201100337 [DOI] [PubMed] [Google Scholar]
- 42.Shimomura K, Sugiyama Y, Nakamura J, Ahn MR, Kumazawa S. Component analysis of propolis collected on Jeju Island, Korea. Phytochemistry. 2013;93:222–9. 10.1016/j.phytochem.2012.02.018 [DOI] [PubMed] [Google Scholar]
- 43.Siheri W, et al. Isolation of a novel flavanonol and an alkylresorcinol with highly potent anti-trypanosomal activity from Libyan propolis. Molecules. 2019;24:1041–50. 10.3390/molecules24061041 [DOI] [PMC free article] [PubMed] [Google Scholar]
- 44.Kardar MN, et al. Characterisation of triterpenes and new phenolic lipids in Cameroonian propolis. Phytochemistry. 2014;106:156–63. 10.1016/j.phytochem.2014.07.016 [DOI] [PubMed] [Google Scholar]
- 45.Nina N, et al. Antibacterial activity, antioxidant effect and chemical composition of propolis from the Región Del Maule, central Chile. Molecules. 2015;20:18144–67. 10.3390/molecules201018144 [DOI] [PMC free article] [PubMed] [Google Scholar]
- 46.Abu-Mellal A, Koolaji N, Duke RK, Tran VH, Duke CC. Prenylated cinnamate and stilbenes from Kangaroo Island propolis and their antioxidant activity. Phytochemistry. 2012;77:251–9. 10.1016/j.phytochem.2012.01.012 [DOI] [PubMed] [Google Scholar]
- 47.Castro C, et al. Identification of phenolic compounds by HPLC-ESI-MS/MS and antioxidant activity from Chilean propolis. Food Res Int. 2014;64:873–9. 10.1016/j.foodres.2014.08.050 [DOI] [PubMed] [Google Scholar]
- 48.Campos JF et al. Antimicrobial, antioxidant, anti-Inflammatory, and Cytotoxic activities of propolis from the stingless bee tetragonisca fiebrigi (Jataí). Evidence-based Complement. Altern. Med. 2015, (2015). [DOI] [PMC free article] [PubMed]
- 49.Menon SS, Guruvayoorappan C, Sakthivel KM, Rasmi RR. Ki-67 protein as a tumour proliferation marker. Clin Chim Acta. 2019;491:39–45. 10.1016/j.cca.2019.01.011 [DOI] [PubMed] [Google Scholar]
- 50.Chou TC. Theoretical basis, experimental design, and computerized simulation of synergism and antagonism in drug combination studies. Pharmacol Rev. 2006;58:621–81. 10.1124/pr.58.3.10 [DOI] [PubMed] [Google Scholar]
- 51.Amr A, et al. UPLC-MS/MS analysis of naturally derived Apis mellifera products and their Promising effects against Cadmium-Induced adverse effects in female rats. Nutrients. 2022;15(1):119. 10.3390/nu15010119 [DOI] [PMC free article] [PubMed] [Google Scholar]
- 52.Omar EM, et al. Reversal effects of Royal Jelly and Propolis Against Cadmium-Induced Hepatorenal toxicity in rats. Biol Trace Elem Res. 2023. 10.1007/s12011-023-03775-0. Advance online publication. 10.1007/s12011-023-03775-0 [DOI] [PMC free article] [PubMed] [Google Scholar]
- 53.Chou TC, Talalay P. A simple generalized equation for the analysis of multiple inhibitions of Michaelis-Menten kinetic systems. J Biol Chem. 1977;252:6438–42. 10.1016/S0021-9258(17)39978-7 [DOI] [PubMed] [Google Scholar]
- 54.Perumal V, et al. Antioxidants profile of Momordica charantia fruit extract analyzed using LC-MS-QTOF-based metabolomics. Food Chem Mol Sci. 2021;2:100012–9. 10.1016/j.fochms.2021.100012 [DOI] [PMC free article] [PubMed] [Google Scholar]
- 55.Bhatti MS, Asiri YI, Uddin J, El-Seedi HR, Musharraf SG. Repurposing of pharmaceutical drugs by high-throughput approach for antihypertensive activity as inhibitors of angiotensin-converting enzyme (ACE) using HPLC-ESI-MS/MS method. Arab J Chem. 2021;14:103279–87. 10.1016/j.arabjc.2021.103279 [DOI] [Google Scholar]
- 56.Bueno-Silva B, Marsola A, Ikegaki M, Alencar SM, Rosalen PL. The effect of seasons on Brazilian red propolis and its botanical source: chemical composition and antibacterial activity. Nat Prod Res. 2017;31(11):1318–24. 10.1080/14786419.2016.1239088 10.1080/14786419.2016.1239088 [DOI] [PubMed] [Google Scholar]
- 57.Dantas Silva RP, Machado BA, Barreto GA, Costa SS, Andrade LN, Amaral RG, Carvalho AA, Padilha FF, Barbosa JD, Umsza-Guez MA. Antioxidant, antimicrobial, antiparasitic, and cytotoxic properties of various Brazilian propolis extracts. PLoS ONE. 12(3), e0172585. 10.1371/journal.pone.0172585 [DOI] [PMC free article] [PubMed]
- 58.Rodrigues DM, et al. Synthesis, antitumor activity and in silico analyses of amino acid derivatives of artepillin C, drupanin and baccharin from green propolis. Bioorg Med Chem. 2021;47:116372–85. 10.1016/j.bmc.2021.116372 [DOI] [PubMed] [Google Scholar]
- 59.Shimizu K, et al. Artepillin C in Brazilian propolis induces G0/G1 arrest via stimulation of Cip1/p21 expression in human colon cancer cells. Mol Carcinog. 2005;44:293–9. 10.1002/mc.20148 [DOI] [PubMed] [Google Scholar]
- 60.Kimoto T, Arai S, Kohguchi M, Aga M, Nomura Y, Micallef MJ, Kurimoto M, Mito K. Apoptosis and suppression of tumor growth by artepillin C extracted from Brazilian propolis. Cancer Detect Prev Prev. 1998;22:506–15. 10.1046/j.1525-1500.1998.00020.x [DOI] [PubMed] [Google Scholar]
- 61.Messerli SM, Ahn MR, Kunimasa K, Yanagihara M, Tatefuji T, Hashimoto K, Mautner V, Uto Y, Hori H, Kumazawa S, Kaji K, Ohta T, Maruta H. Artepillin C (ARC) in Brazilian green propolis selectively blocks oncogenic PAK1 signaling and suppresses the growth of NF tumors in mice. Phyther Res PTR. 2009;23:423–7. 10.1002/ptr.2658 [DOI] [PubMed] [Google Scholar]
- 62.Bhargava P, et al. Anticancer activity of the supercritical extract of Brazilian green propolis and its active component, artepillin C: Bioinformatics and experimental analyses of its mechanisms of action. Int J Oncol. 2018;52:925–32. [DOI] [PubMed] [Google Scholar]
- 63.Ota A, Kawai M, Kudo Y, Segawa J, Hoshi M, Kawano S, Yoshino Y, Ichihara K, Shiota M, Fujimoto N, Matsunaga T, Endo S, Ikari A. Artepillin C overcomes apalutamide resistance through blocking androgen signaling in prostate cancer. Arch Biochem Biophys. 2023;109519:109519. 10.1016/j.abb.2023.109519 [DOI] [PubMed] [Google Scholar]
- 64.Pelinson LP, et al. Antiproliferative and apoptotic effects of caffeic acid on SK-Mel-28 human melanoma cancer cells. Mol Biol Rep. 2019;46:2085–92. 10.1007/s11033-019-04658-1 [DOI] [PubMed] [Google Scholar]
- 65.Chen C, et al. Decyl caffeic acid inhibits the proliferation of colorectal cancer cells in an autophagy-dependent manner in vitro and in vivo. PLoS ONE. 2020;15:e0232832. 10.1371/journal.pone.0232832 [DOI] [PMC free article] [PubMed] [Google Scholar]
- 66.Sucu BO, Koc EB, Ipek S, Mirat O, Almas A, Guzel F, Dogan MA, Uludag B, Karakas D, Durdagi N, S., Guzel M. Design and synthesis of novel caffeic acid phenethyl ester (CAPE) derivatives and their biological activity studies in glioblastoma multiforme (GBM) cancer cell lines. J Mol Graph Model. 2022;113:108160. 10.1016/j.jmgm.2022.108160 [DOI] [PubMed] [Google Scholar]
- 67.Pagnan AL, Pessoa AS, Tokuhara CK, Fakhoury VS, Oliveira GSN, Sanches MLR, Inacio KK, Ximenes VF, Oliveira RC. Anti-tumour potential and selectivity of caffeic acid phenethyl ester in osteosarcoma cells. Tissue Cell. 2022;74:101705. 10.1016/j.tice.2021.101705 [DOI] [PubMed] [Google Scholar]
- 68.Tseng JC, et al. Caffeic acid phenethyl ester suppresses EGFR/FAK/Akt signaling, migration, and tumor growth of prostate cancer cells. Phytomedicine. 2023;116:154860. 10.1016/j.phymed.2023.154860 [DOI] [PubMed] [Google Scholar]
- 69.Ha TK, et al. Galangin induces human colon cancer cell death via the mitochondrial dysfunction and caspase-dependent pathway. Exp Biol Med. 2013;238:1047–54. 10.1177/1535370213497882 [DOI] [PubMed] [Google Scholar]
- 70.Oršolić N, Jazvinšćak Jembrek M. Molecular and cellular mechanisms of propolis and its polyphenolic compounds against cancer. Int J Mol Sci. 2022;23:10479–547. 10.3390/ijms231810479 [DOI] [PMC free article] [PubMed] [Google Scholar]
- 71.Zheng Y, et al. Pinocembrin induces ER stress mediated apoptosis and suppresses autophagy in melanoma cells. Cancer Lett. 2018;431:31–42. 10.1016/j.canlet.2018.05.026 [DOI] [PubMed] [Google Scholar]
- 72.Slavov A, et al. Biologically active compounds with antitumor activity in propolis extracts from different geographic regions. Biotechnol Biotechnol Equip. 2013;27:4010–3. 10.5504/BBEQ.2013.0034 [DOI] [Google Scholar]
- 73.Salatino A, Salatino MLF, Negri G. How diverse is the chemistry and plant origin of Brazilian propolis? Apidologie. 2021;52:1075–97. 10.1007/s13592-021-00889-z [DOI] [PMC free article] [PubMed] [Google Scholar]
- 74.Muñoz A, Grant WB. Vitamin D and cancer: an historical overview of the epidemiology and mechanisms. Nutrients. 2022;14:1448–88. 10.3390/nu14071448 [DOI] [PMC free article] [PubMed] [Google Scholar]
- 75.Juniku-Shkololli A, Manxhuka-Kerliu S, Ahmetaj H, Khare V, Zekaj S. Expression of immunohistochemical markers of progression in pre-cancerous and cancerous human colon: correlation with serum vitamin D levels. Anticancer Res. 2015;35:1513–20. [PubMed] [Google Scholar]
- 76.Song J, et al. The correlation between low vitamin D status and renal interleukin-6/STAT3 hyper-activation in patients with clear cell renal cell carcinoma. Steroids. 2019;150:108445. 10.1016/j.steroids.2019.108445 [DOI] [PubMed] [Google Scholar]
- 77.Mehaoudi RI, et al. Association of vitamin D deficiency and insulin resistance with breast cancer in premenopausal Algerian women: a cross-sectional study. Ann Endocrinol (Paris). 2021;82:597–605. 10.1016/j.ando.2021.05.002 [DOI] [PubMed] [Google Scholar]
- 78.Lawler T, Su T, Cai Q, Steinwandel MD, Zheng W, Blot WJ, Warren, Andersen. Associations between serum vitamin D biomarkers and tumor expression of Ki67, p53, and COX-2 in colorectal cancer cases from the Southern Community Cohort Study. J Steroid Biochem Mol Biol. 2023;225:106201. [DOI] [PMC free article] [PubMed]
- 79.Abosedera DA, et al. Metabolomic profile and in vitro evaluation of the cytotoxic activity of Asphodelus microcarpus against human malignant melanoma cells A375. Arab J Chem. 2022;15:104174. 10.1016/j.arabjc.2022.104174 [DOI] [Google Scholar]
- 80.Mosmann T. Rapid colorimetric assay for cellular growth and survival: application to proliferation and cytotoxicity assays. J Immunol Methods. 1983;65:55–63. [DOI] [PubMed]
Associated Data
This section collects any data citations, data availability statements, or supplementary materials included in this article.
Supplementary Materials
Data Availability Statement
All data generated and analyzed in this study are included in this article.