Abstract
Chlorine exposure can cause severe airway injuries. While the acute effects of chlorine inhalation are well-documented, the structural changes resulting from the post-acute, high-level chlorine exposure remain less understood. Airway sloughing is one of the standards for doctors to evaluate the lung function. Here, we report the application of a high-resolution swept-source optical coherence tomography system to investigate the progression of injury based on airway sloughing evaluation in a chlorine inhalation rabbit model. This system employs a 1.2 mm diameter flexible fiberoptic endoscopic probe via an endotracheal tube to capture in vivo large airway anatomical changes before and as early as 30 min after acute chlorine exposure. We conducted an animal study using New Zealand white rabbits exposed to acute chlorine gas (800 ppm, 6 min) during ventilation and monitored them using optical coherence tomography (OCT) for 6 h. To measure the volume of airway sloughing induced by chlorine gas, we utilized deep learning for the segmentation task on OCT images. The results showed that the volume of chlorine induced epithelial sloughing on rabbit tracheal walls initially increased, peaked around 30 min, and then decreased. Furthermore, we utilized a spectral encoded interferometric microscopy system to study ex vivo airway cilia beating dynamics based on Doppler shift, aiding in elucidating how chlorine gas affects cilia beating function. Cilia movability and beating frequency were decreased because of the epithelium damage. This quantitative approach has the potential to enhance the diagnosis and monitoring of injuries from toxic gas inhalation and to evaluate the efficacy of antidote treatments for these injuries.
I. INTRODUCTION
Chlorine is widely used in a variety of industrial and household applications. Humans can be exposed to chlorine through domestic and occupational accidents or intentional releases. In cases of chlorine injury, inhalation exposures are predominantly observed, potentially causing direct damage to airway tissues, including injuries to the mucosal and submucosal layers and damage to sloughing ciliated cells.1 Furthermore, this can lead to physiological changes, such as changes in airway resistance and an increase in airway pressure. At later stages, severe conditions such as acute respiratory distress syndrome (ARDS), pulmonary edema, and death may occur.2 These characteristics of chlorine gas cause huge casualties when unexpected exposure incidents happen and are even weaponized and considered a major threat to chemical warfare, as seen in Operation Iraqi Freedom.3
Airway sloughing is one of the important criteria that doctors use to grade inhalation injuries. Airway sloughing is a manifestation of the epithelium layer sloughing out. Loss of the epithelium can promote mucostasis and pneumonia. According to the bronchoscopic criteria used to grade inhalation injuries, grade 4 (massive injury) shows evidence of mucosal sloughing, necrosis, or endoluminal obliteration (any combination).4–6 Another study indicated that in patients with inhalation injuries affecting the supraglottic airway, mucosal blisters ranging in size from 2 to 5 mm in diameter were frequently observed. However, this was specifically noted in cases where substantial mucosal edema occurred.4 Therefore, airway sloughing usually occurs in mucosal sloughing-massive injuries.
The size of these airway sloughs is a critical factor in medical decision-making. In particular, the decision to perform a tracheotomy is influenced by observations of this airway sloughing using fiberoptic laryngoscopy. A tracheotomy was performed once blisters in the laryngeal pharynx exceeded the glottis or burn area by >33%.7 By evaluating the size, shape, color, rupture, or state of seepage of the airway sloughing, doctors can ascertain the extent of airway damage. This assessment is vital in guiding the treatment approach for inhalation injury patients.
In clinical practice, fiber bronchoscopy (FOB) and histology are considered the gold standard for diagnosing and assessing airway damage through airway sloughing and pulmonary water. However, FOB has limitations in subjectivity, and the airway sloughing is transparent and difficult to distinguish with a brightfield camera. FOB is unable to assess distal airways and respiratory bronchioles.6 Meanwhile, histology is limited to representing certain tissues taken from and invasive. Therefore, the development of a comparatively non-invasive technique for objectively identifying and quantitatively tracking airway injury changes in patients is a critical clinical need.
In recent times, optical coherence tomography (OCT) has emerged as a valuable tool offering minimally invasive and, in some cases, non-invasive, high-resolution anatomical imaging of various types of tissues and organs.8–13 Flexible endoscopic surgery can take full advantage of the non-contact fiber optic-based OCT technique to provide fast data acquisition and real-time segmentation of airway structure information.14–17 In addition, the latest studies that utilized deep learning for biomedical image analysis showed its capability for precise and accurate segmentation tasks, for example, retinal layer segmentation in a retinal OCT scan,18 airway segmentation in an OCT scan,19,20 and brain tumor segmentation in an MRI.21 The significance of utilizing deep learning for segmentation tasks in biomedical applications lies in its trainability across imaging modalities by learning to extract appropriate features to detect a specific target. The quantitative assessment of airway injury requires high-resolution imaging and precise segmentation; thus, it is advantageous to use endoscopic OCT imaging and deep learning-based segmentation.
Ciliary motion in the upper airway is crucial for expelling foreign particles and maintaining respiratory health. Cilia move mucus and trapped particles away from the lungs in a process called mucociliary clearance, which defends against pathogens and pollutants. Disruption from factors such as toxins can impair this function, causing mucus buildup, chronic infections, and reduced lung function. Recent research emphasizes Cilia Beat Frequency (CBF) as an essential indicator of ciliary health, but current technologies fall short of accurately detecting it.
Visualizing ciliary motion poses a significant challenge since the respiratory cilia are around 6–7 μm in length and 0.2–0.3 μm in diameter. Endoscopic OCT systems, constrained by probe form factor, typically achieve an axial resolution of about 10 μm and a lateral resolution of about 30 μm, making them inadequate for visualizing cilia.22,23
Although Doppler OCT systems offer picometer-scale phase sensitivity,24–28 their en face imaging speed is relatively slow. Since the cilia cells are only present on the tissue surface, depth information is irrelevant to cilia cell motion. Acquiring a 2D enface image of cilia motion using conventional OCT will require a 3D image, which severely limits the imaging speed. To address this limitation, spectral encoded interferometric microscopy (SEIM) was developed,23 which also relies on phase-resolved Doppler methods but utilizes an en face line scan protocol instead of point-by-point scanning to achieve real time 2D en face image speed.
In this study, we report the application of a high-resolution swept-source coherence tomography (SSOCT) system to investigate the progression of injury in a chlorine inhalation rabbit model. We used the SSOCT endoscopic system to capture the cross-sectional structure along the rabbit trachea before chlorine exposure (“baseline”), 30 min after chlorine exposure, and from 1 to 6 h post exposure. The system facilitated the observation of airway sloughing induced by exposure to chlorine gas. Quantitative analysis of airway sloughing was performed by utilizing a segmentation technique based on a deep learning model to achieve accurate and efficient analysis. More importantly, this study is distinguished as the initial research to utilize OCT for the in vivo diagnosis of airway sloughing injuries after chlorine gas exposure. Our study demonstrated that endoscopic OCT imaging combined with deep learning has the potential to enhance the diagnosis and monitoring of airway injuries from toxic gas inhalation. In addition, we utilized the SEIM system to monitor ex vivo airway cilia beating dynamics based on Doppler shift analysis, aiding in elucidating how chlorine gas affects cilia beating function.
II. MATERIALS AND METHODS
A. General preparation
New Zealand white rabbits (N = 15) (Western Oregon Rabbit Company, Philomath, Oregon) weighing 3–4.5 kg were used in this study. The subject will be weighed, and clippers will be used to shave: the inner part of the back legs (placement of catheters in the femoral artery and vein for blood gas and blood collection), the cheek (for pulse O2 saturation), the chest (EKG), and the top of the head (CW). The animals were anesthetized with a 2:1 ratio of ketamine HCl (100 mg/ml) (Ketaject, Phoenix Pharmaceutical Incorporated, Saint Joseph, Missouri) and xylazine (20 mg/ml) (Anased, Lloyd Laboratories, Shenandoah, Iowa), 0.75-cc/kg IM using a 23gauge 5/8-in needle. After the IM injection, a 23gauge, 1-in. catheter was placed in the marginal ear vein to administer an IV maintenance anesthetic of a 1:1 mixture of ketamine and xylazine (10 cc each of ketamine 100 mg/ml and xylazine 20 mg/ml) diluted to 55 ml in saline as a continuous infusion at a rate of 0.17 ml/min. The animals were put into an acrylic box attached to the ventilator orally through a 3.5-mm cuffed endotracheal tube (14 cm in length) and mechanically ventilated (dual phase control respirator, model 613, Harvard Apparatus, Chicago, Illinois) at a respiratory rate of 20/min, a tidal volume of 50 cc, and a FiO2 of 100%. The ventilation rate was monitored by connecting a Philips NM3 respiratory monitor to the Endotracheal (ET) tube and adjusting the ventilator such that we had a respiratory rate of 20 bpm and a tidal volume of 50 ml. On completion of the experiment, the animals were euthanized with 1 cc of an intravenous injection of Eutha-6, administered through the marginal ear vein.
B. Administration of chlorine
To administer chlorine to the animals, the rabbit will be disconnected from the ventilator and transported to a fume hood (ventilating with an Ambu bag). In the fume hood, we created a negative pressure ventilator by modifying a large animal ventilator (Model 613 Volume Control Ventilator, Harvard Apparatus, Holliston, MA) to deliver negative pressure instead of positive pressure during the inhalation drive stroke, allowing rabbits to passively exhale at ambient (room) pressure. This ventilator is connected to a 24 × 24 × 60 cm3 acrylic box. When the rabbit with an Endotracheal Tube (ET tube) inserted is placed inside the box and a connector is attached to the ET tube from outside the box through a tight-fitting hole on the box, we can achieve negative pressure ventilation when the ventilator is turned on, such as “iron lungs.” The rabbit does not breathe from the air within the box but from the outside environment due to a negative pressure placed on its chest wall.
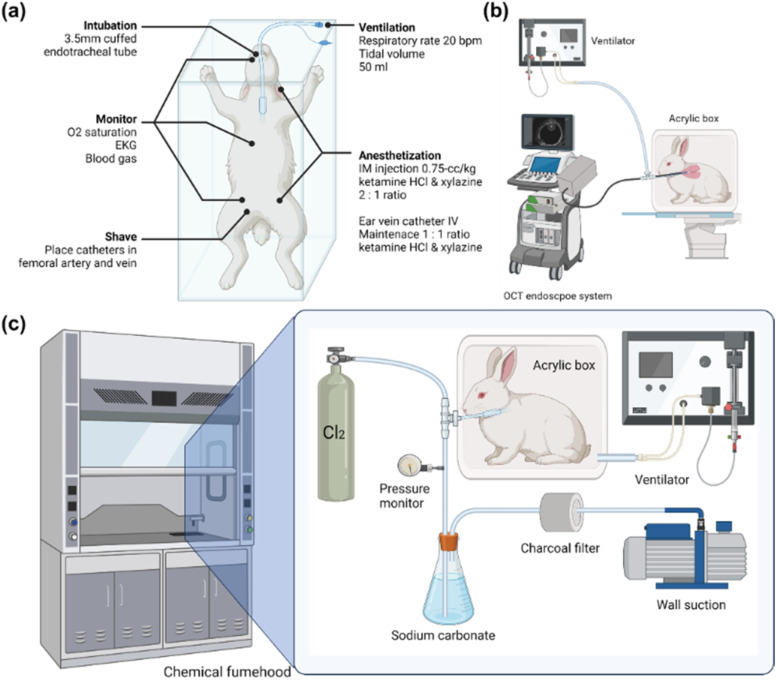
Chlorine Gas Inhalation: A custom inhalation (air/800 ppm Cl2) exhalation (Cl2/absorption) respiratory circuit has been designed to deliver the desired Cl2 (Chlorine gas mixture) concentration and to ensure that the exhaled Cl2 is absorbed by the absorption unit. Chlorine gas is delivered at a concentration of 800 ppm by using a compressed gas cylinder containing a concentration of 800 ppm Cl2 in room air (21% O2) in a specifically designed apparatus. Heart rate and SpO2 are monitored throughout the procedure. Rabbits were given supplemental oxygen if SpO2 dropped below 90%. A summarized experimental setup is shown in Fig. 1.
FIG. 1.
(a) General preparation of New Zealand white rabbits. (b) Baseline endoscope OCT imaging taken in the animal operating room. (c) Experimental setup for chlorine exposure of the intubated subject. A mechanical ventilator provides negative pressure to the chamber, and the chamber acts as “iron lungs.” Chlorine gas enters the circuit as the regulator is turned on. There should be no increase in pressure in the breathing circuit when the chlorine is introduced. A pressure gauge is placed in the circuit to make sure airway pressure stays in the normal range. A sodium carbonate solution was used to absorb and deactivate additional chlorine gas.
C. Optical systems and probes
1. Endoscopic OCT system for in vivo airway 3D imaging
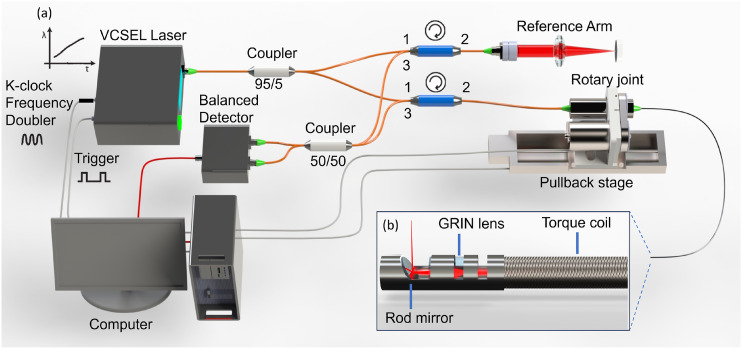
Our OCT imaging system is based on a Fourier domain OCT utilizing a 100 kHz vertical-cavity surface-emitting laser (VCSEL) 1310 nm swept source (Thorlabs Inc.) with a bandwidth of 100 nm. A 95/5 coupler is used to split the output beam from the laser into the OCT sample arm and the reference arm. The reference arm consists of an optical delay line and a mirror to adjust the optical path length and create interference of the light in the sample arm. The sample arm consists of a fiber optic rotary joint, a motorized linear pullback stage, and an endoscopic probe to achieve volumetric scanning of the airway. Circulators direct the reflected light from the sample and reference arm to a 50/50 coupler, and the OCT interference fringe is detected by a balanced detector. Finally, the signal from the detector is sampled using a 12-bit data acquisition card (1.8 GHz, Alazar Technologies Inc., Pointe-Claire, Quebec, Canada). The emitting power of the probe was 12 mW. The imaging probe proximally rotates the entire probe at 3000 rpm to achieve 50 f/s (2000 A-lines per frame). The computer system is equipped with a graphics-processing unit (GPU, RTX4090, Nvidia) for processing and displaying real-time two-dimensional (2D) cross sections due to the high-speed capture of OCT data.
The OCT probe is constructed using a stainless torque coil with a 1.0 mm outer diameter (Asahi Intecc, Santa Ana, California) for translating torque from the proximal end to the distal end of the probe to achieve high rotation speed, as illustrated in the schematic in Fig. 2. A gradient index lens with a 1.0 mm diameter is used to focus the laser beam into a single-mode fiber. The focusing beam is subsequently reflected by a 40° gold-coated rod mirror, resulting in a side-viewing probe. The entire optical assembly at the probe tip is protected by a metal cap that is firmly attached to the torque coil. A brushless DC motor is used to proximally drive, via a fiber optic rotary joint, the aforementioned fiber optic probe assembly within a light walled transparent fluorinated ethylene propylene (FEP) protection sheath (16 AWG, ZEUS Inc.) with an overall diameter of 1.65 mm to achieve cross-sectional airway imaging at 3000 rpm.
FIG. 2.
(a) Overall design of the endoscopic OCT system and (b) OCT imaging probe. VCSEL: vertical cavity surface emitting lasers and GRIN: gradient index.
2. SEIM en face view of cilia motion
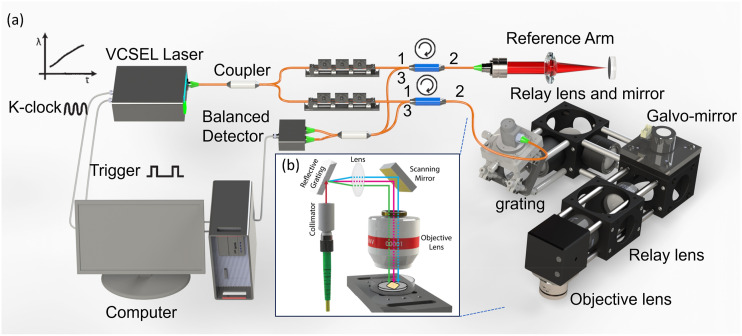
The SEIM system is derived from a swept-source OCT setup, as detailed in a prior publication.24,29 The system setup is detailed in Fig. 3. The system operates at a 1.3 μm center wavelength and a 100 kHz A-line rate. Conventional OCT images tissue point-by-point along the depth direction, making enface imaging relatively slow. Since the cilia cells are only present on the tissue surface, depth information is irrelevant to cilia cell motion. Acquiring a 2D enface image of cilia motion using conventional OCT will require a 3D image, which severely limits the imaging speed. To address this limitation, SEIM utilizes an enface line scan protocol instead of point-by-point scanning to enhance the en face image speed. To generate a line pattern for en face optical imaging, the system employs diffraction gratings and a 1D galvanometer mirror for scanning. Optical relays are utilized to ensure precise alignment, thus maintaining a consistently flat scanning plane on the sample surface. The system is capable of real-time en face displacement imaging at speeds of up to 100 frames per second (FPS), covering a field of view (FOV) of ∼480 × 750 μm2. It achieves a lateral resolution of 1.2 μm and boasts a displacement sensitivity of 0.3 nm.
FIG. 3.
(a) Overall design of the SEIM system and (b) SEIM illustration. A broadband light source is diffracted by a grating. The colors do not represent the wavelengths.
When preparing the cilia sample for SEIM imaging, rabbit tracheal samples were harvested from freshly euthanized male New Zealand white rabbits 3-h post chlorine exposure and a healthy control rabbit. After harvest, the tissue was immediately immersed in Hanks Balanced Salt Solution (HBSS) and maintained at body temperature (∼38 °C). The soft tissue surrounding the trachea was meticulously removed to ensure a smooth imaging surface. The tracheal tissue was then longitudinally cut to expose the mucosal surface for imaging and secured onto a silicone-lined Petri dish using pins. A layer of HBSS was applied to the dish to replicate the natural tissue environment and reduce interference with ciliary motion. A microscope cover glass was placed on top of the tissue to provide a flat surface for SEIM imaging and to reduce movement caused by the water surface.
D. OCT data acquisition
15 New Zealand white rabbits were divided into two groups: control (N = 2) and gas exposure (N = 13), including one rabbit suffering an unexpected death at 3 h post exposure. Once a rabbit was properly anesthetized, the OCT endoscopic probe protected with FEP tubing was inserted and advanced to the rabbit’s trachea through the ventilator connector and ET tube. After the probe passes the carina and reaches the primary bronchi, the probe will rotate at 3000 rpm to capture the cross-sectional image. A pullback stage was used to pull the probe backward at 5 mm/s to obtain 2D cross-sectional images of the trachea and bronchi along the longitudinal axis of the endoscopic probe. Only trachea data were analyzed. In all groups, OCT measurements were taken just before the start of chlorine exposure (“baseline”), 30 min, and from 1 to 6 h after chlorine exposure. Starting from carina to the ET tube, unwrapped images with a size of 2048 × 2000 pixels at each time point were selected for analysis. The whole dataset consists of 114 independent measurements of the airway from 15 rabbits, resulting in 29 610 OCT scan images.
E. Segmentation of airway sloughing using deep learning and analysis
The airway sloughing on the mucosa layer in the unwrapped OCT images requires accurate segmentation to determine the size of the edema. To achieve the quantitative value of airway sloughing, we utilized a deep learning algorithm for the segmentation of airway sloughing in OCT images. The dataset for training, validation, and testing was prepared by manual masking of randomly selected 924 OCT images across the whole dataset. To perform precise localization of airway sloughing that is relatively small compared to epithelium layers in OCT images, we have approached small patch-based segmentation. Manually segmented OCT images and corresponding masks for airway sloughing localization were divided into the train-validation group (824 OCT images) and the test group (100 OCT images). The images in the train-validation group were augmented into the training and validation datasets by applying weighted random cropping to generate small patches with a size of 512 × 512 pixels, resulting in 70% with airway sloughing and 30% without it. Additional treatments, including random brightness, random contrast, random rotation, and Gaussian noise, were applied to OCT patches to secure a broad range of image quality for OCT measurements. A total of 40 000 OCT-mask patch pairs were generated for the training set and 10 000 for the validation set. For the architecture, we employed the attention U-Net, which introduced the attention gate into the U-Net, and for advancement in the segmentation task.30 Training of the model was performed with the pixelwise binary cross entropy loss and the Adam optimizer.31
The performance of the trained network was validated by measuring three metrics for the segmentation task, i.e., the pixel accuracy, the mean intersection of unions (mIoUs), and the dice score between the manual mask and model prediction. Evaluation of model performance was conducted based on a test dataset consisting of 1500 patches of size 512 × 512, which were generated from independent 100 test images by random cropping with airway sloughing in a cropped region.
The prediction of airway sloughing in each OCT cross section image was performed by tile-by-tile prediction with 50% overlap and merged into a large mask for an original OCT image size of 2048 × 2000 pixels. A predicted mask is transformed into a rotated form and used for quantitative assessment of airway sloughing volume. A series of OCT images from a single acquisition stacked into 3D-volume and the quantification of airway sloughing performed by counting the number of voxels corresponding to airway sloughing. The counted voxel is converted to real scale by multiplying 5.4 × 10⁻⁴ μl/voxel.
The training and testing of the deep learning model with post analysis were conducted by custom software in MATLAB (MathWorks, version R2023b) and Python programming language (version 3.11.5) with its open-source libraries: Tensorflow (version 2.12.0), OpenCV-Python (version 4.8.0), and Albumentation (version 1.3.1).
F. Statistical analysis and validation
Further statistical analysis of the results of airway sloughing measurements was conducted. Since the number of OCT images (cross section) that were acquired from each measurement was different, we summarized our observation of airway sloughing as the average volume per section. To validate statistical significance in airway sloughing volume per OCT section scan between the control and the chlorine gas exposed group, we performed the Student’s t-test between rabbits in a one-to-one manner using randomly selected 30 measurements from each rabbit at each time point. The analysis was performed based on the Python programming language with the open-source libraries scipy (version 1.11.1) and pandas (version 2.0.3).
III. RESULTS
A. 3D OCT scan of rabbit airway
OCT scan images were obtained once the probe reached the carina region. For each 3D scan image set, around 300 OCT images were selected for analysis for each rabbit. The selected OCT images correspond to roughly a 30-mm section of the lower trachea, between the carina and the distal end of the ET tube.
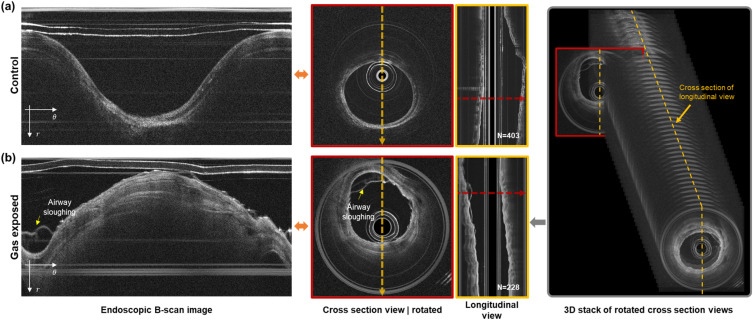
Figure 4 presents the outcome of OCT endoscopic imaging of a rabbit’s trachea both at baseline and 30 min following exposure to chlorine gas. The images, including an unwrapped and correspondingly rotated cross section view, originate from the same longitudinal position, as indicated by a red arrow in the longitudinal depiction. The longitudinal view was derived from the cross sections along an orange arrow in a sequentially rotated image. In the control group, the inner lumen of the airway appears smooth and clean, with no evidence of sloughing or detachment of the epithelial layer at this juncture. However, 30 min after exposure to chlorine gas, noticeable sloughing and detachment of the airway epithelium were observed, indicating significant acute injury and damage to the airway structure due to chlorine gas.
FIG. 4.
Representative results of an endoscopic SSOCT scan of the rabbit airway. (a) Control case and (b) with chlorine injury after 30 mins of gas exposure. Endoscopic B-scan images are transformed into a cross section view of the airway (red colored box, red colored arrow), and stacks of these cross sections enable the visualization of a longitudinal view of the scanned airway (yellow box, yellow colored arrow). The number of cross section images needed to build a 3D stack of airways is represented in longitudinal view images. Airway sloughing on rabbit airways induced by chlorine gas exposure is well captured in the OCT scan.
The histology of the 6-h post chlorine exposure sample was obtained and compared with the images obtained from the OCT system for histological confirmation. To make sure histology co-registered with the OCT image, we harvested the airway from one of the 6 h post chlorine exposure rabbits and fixed it in 10% formalin. As shown in Fig. 5, in the in vivo OCT image, the sloughing of the epithelial layer can be observed, which is confirmed by histology.
FIG. 5.
Representative examples showing airway sloughing during exposure by OCT (a) and after exposure by histology (b) and (c). Trachea tissue folds inward during fixation where there is no cartilage support. (c) Enlarged view of the dashed box. Yellow boxes indicate the sloughing of the epithelial layer.
B. Quantitative analysis of airway sloughing
To analyze airway sloughing in a quantitative manner, a deep learning model was trained. We utilized the attention of U-Net for accurate localization of airway sloughing caused by chlorine gas inhalation. The performance of the trained network is validated by measuring the pixel accuracy, the intersection of unions, and the dice score using an independent test dataset. The model performance was confirmed at 99.1% for the pixel accuracy, 74.2% for the intersection of unions, and 85.1% for the dice score from the test dataset.
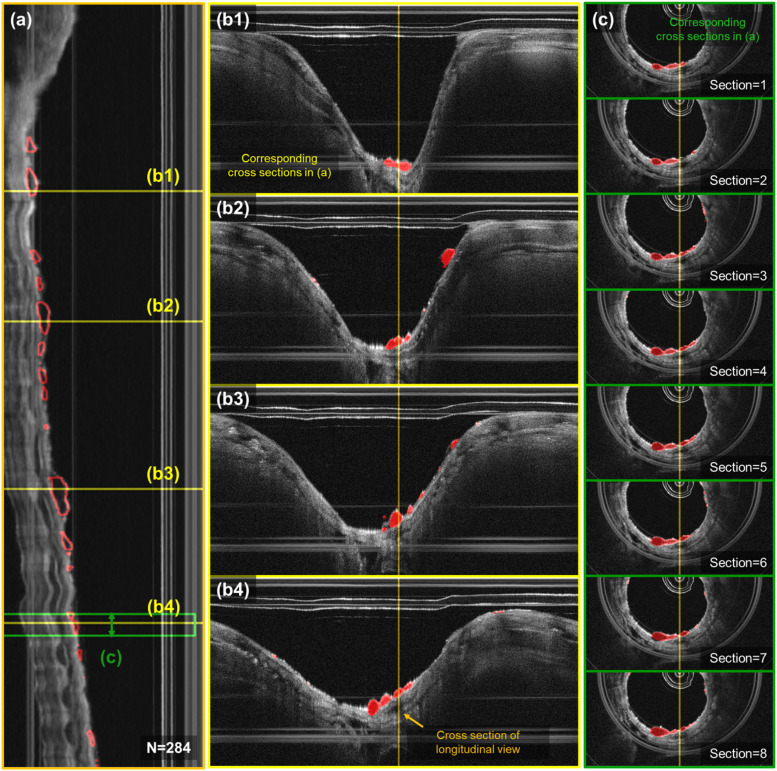
Example results of localized airway sloughing are represented and confirm that the trained model can accurately predict from the OCT scan of the airway in unwrapped images, as shown in Fig. 6. Segmented airway sloughing is highlighted within the red circled areas. Airway sloughing resulting from chlorine gas inhalation injuries can manifest at various positions along the longitudinal axis of the rabbit airway, as illustrated in panel (a). Panels (b1)–(b4) display the distinct OCT unwrapped images at specific longitudinal sites, correlating with the yellow lines marked in (a). Furthermore, panels (c1)–(c8) showcase sequential OCT cross-sections within the green box in (a), thereby providing a comprehensive view of the injury’s impact at different airway locations.
FIG. 6.
Localization of airway sloughing in a 3D OCT scan of the airway. (a) Longitudinal cross section of the airway of a sample rabbit after 30 mins of chlorine gas exposure. (b1)–(b4) Representative results of localization of bubbles from the trained network in unwrapped images that correspond to the yellow lines in (a). (c) Visualization of bubble localization in 8 sequential cross sections corresponding to the green colored box regions in (a).
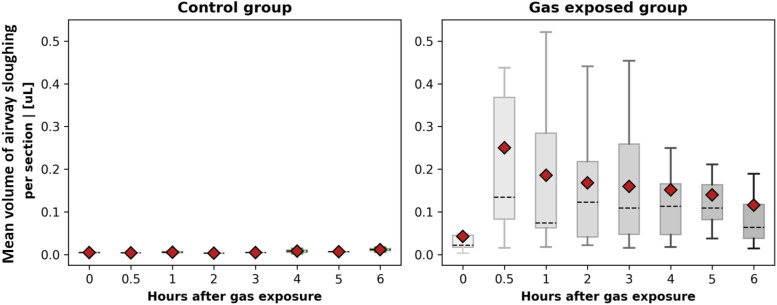
Quantitative analysis was conducted on the segmentation results to calculate the mean volume of airway sloughing per cross section in OCT images for both the control group and the group exposed to chlorine gas, as shown in Fig. 7. A significant difference was observed between the experimental group and the control group. The data indicate a pattern of initial increases followed by a decrease in airway sloughing volume. The peak airway sloughing volume for most rabbits occurred at 30 min post-chlorine gas exposure, after which a decreasing trend was noted. In certain cases, a rapid escalation in tissue sloughing of the airway tissue was observed, beginning as early as 30 min following exposure to chlorine gas. By contrast, the control group exhibited minimal changes, with the majority of the animals showing little to no alteration. Animals tolerated the 6 h of OCT monitoring well, and no significant complications were caused by the OCT catheter. To validate statistical significance, we further conducted a statistical test between measurements of rabbits in the control and gas exposed groups in a one-to-one manner. The t-test between pairs of rabbits from the control and chlorine gas exposed groups confirms the statistical significance of injury to the airway by chlorine gas inhalation. A summary of the statistical analysis of airway sloughing can be found in the supplementary material.
FIG. 7.
Box plot of the mean volume of airway sloughing per cross section in OCT images for control samples and samples that were exposed to chlorine gas. Red colored points indicate the averaged value of overall observations, and the dashed line represents the median.
C. Quantitative assessment of airway cilia motion
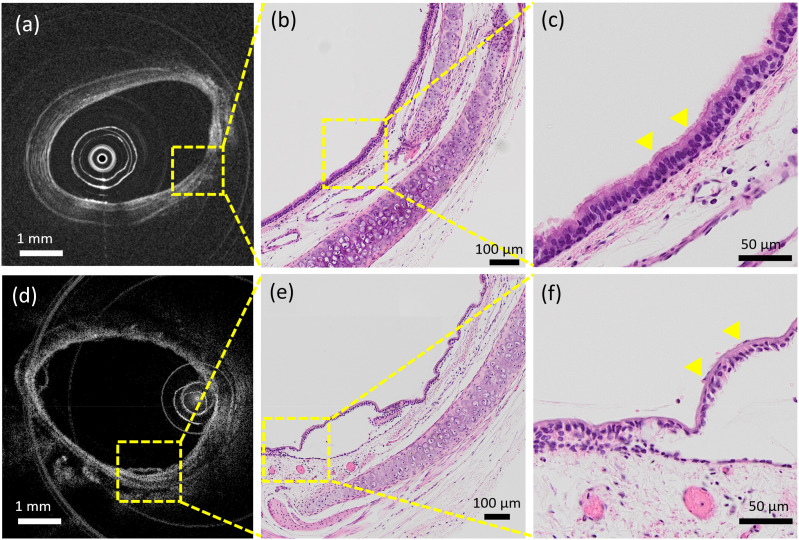
The inhalation of chlorine gas can have detrimental effects on cilia function. This assertion is vividly illustrated in Fig. 8, which presents a histological comparison of cilia in a healthy rabbit trachea (b) and (c) and those in a trachea subjected to chlorine-induced injury (e) and (f) with corresponding OCT images (a) and (d). In the detailed view provided in (c), the cilia structure remains intact and clearly visible, affirming the typical histological features of a healthy trachea. Conversely, the magnified section in (f) illustrates the aftermath of chlorine exposure, where the cilia structure becomes barely discernible, indicating significant histological alteration. Building upon this comparison, our study aims to quantitatively analyze chlorine’s toxic effect on the ciliary beating function. We harvested the rabbit tracheas after 3 h of chlorine exposure and used the SEIM system to image ciliary motion. We obtained a total of 500 en face images at 50 f/s, with each en face image size of 2000 × 2000 pixels. Bulk motion and bulk phase correction were applied to the image sequence before being fed into a phase-resolved Doppler (PR-D) algorithm.23
FIG. 8.
Endoscope OCT image of healthy rabbit trachea (a) and corresponding histology (b) and (c). Endoscope OCT image of rabbit trachea after chlorine injury (d) and corresponding histology (e) and (f). (c) Enlarged view of (b), cilia structure is intact. (f) Enlarged view of (e), cilia structure is hard to distinguish.
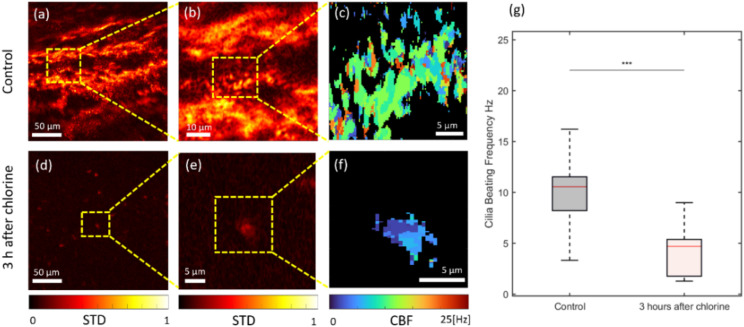
The phase difference standard deviation map from the SEIM image sequence is shown in Figs. 9(a), 9(b), 9(d), and 9(e), where areas of active cilia can be visualized in the heat maps based on the normalized variation in phase values over time. Cilia beating frequency maps shown in Figs. 9(c) and 9(f) were generated based on the dominant frequency determined by the Fourier transform along the time axis at each pixel. The distribution of cilia beating frequency within the selected ROIs for the control and chlorine exposure groups is shown in Fig. 9(g).
FIG. 9.
En face cilia beating analysis results of a rabbit tracheal tissue explant. (a) and (b) Standard deviation of the SEIM image set from a control rabbit tracheal tissue. (c) Cilia beating frequency map of control rabbit tracheal tissue. (d) and (e) Standard deviation of the SEIM image set from rabbit tracheal tissue after 3-h chlorine exposure. (f) Cilia beating frequency map of rabbit tracheal tissue after 3-h chlorine exposure. (g) Distribution of cilia beating frequency for both the control and chlorine exposure groups. STD: standard deviation and CBF: cilia beating frequency.
Notable ciliary activity is present in the control group, as depicted in Figs. 9(a) and 9(b). Conversely, in animals exposed to chlorine, as demonstrated in (d) and (e), while ciliary motion persists, there is a significant reduction in ciliary mobility, with only minimal observable movement in certain areas. In addition, in (c), (f), and (g), ciliary activity is notably diminished. Following chlorine exposure, there is a pronounced decrease in ciliary beating frequency.
IV. DISCUSSION AND CONCLUSION
This study demonstrates the feasibility and capability of endoscopic OCT, which can assess airway injury and detect acute changes in large airway sloughing occurring following chlorine-inhalation exposure in vivo in a clinically relevant animal model. Statistically significant changes in the airway sloughing of the airway are observed in those animals that received chlorine exposure when compared to control animals that did not receive chlorine exposure.
Flexible fiberoptic OCT is a critically important clinical tool for assessing airway inhalation injuries since it can be carried out repeatedly and reliably in a non-contact, minimally invasive manner. This methodology’s feasibility and capabilities were illustrated. In addition, after going through fixation during the histology procedure, the tissue sample lost most of the hyperemia and edema features during the preparation of the histologic specimens. Because OCT data were collected in vivo, it provides the best snapshots of tissues. This is another benefit of in vivo OCT imaging.
Although bronchoscopy with or without biopsy is the gold standard in clinical use, this method has its limitations as it does not provide objective and quantitative information about airway edema, including hyperemia, edema, and sloughing of the tracheal ciliated epithelium. When doing bronchoscopy, it can be challenging to tell whether or how much airway mucosal swelling is present, especially in the initial stages after a chlorine inhalation injury. Utilizing endoscopic OCT without performing invasive biopsies may improve patient care, enable more thorough monitoring of inhalation injuries, shorten the diagnostic time, and possibly even serve as a sensitive tool for providing guidance and evaluating antidote development.
Furthermore, the study underlines the destructive impact of chlorine gas on the respiratory system. Upon inhalation, chlorine gas interacts with the mucosal water in the airways, leading to the formation of hypochlorous acid and hydrogen chloride.32 These compounds can penetrate the fine, hair-like structures of the respiratory membrane, compromising its integrity and permeability. This disruption often results in tissue inflammation, edema, congestion, and, in severe cases, necrosis. Furthermore, the increased permeability of capillaries within the alveolar walls leads to the destruction of the air–blood and gas–liquid barriers. Consequently, a substantial amount of interstitial fluid leaks into the pulmonary interstitium and alveoli, causing pulmonary edema. Moreover, chlorine exposure at levels sufficient to induce acute lung injury results in the death and exfoliation of a majority of pseudostratified epithelial cells, encompassing virtually all club and ciliary cells.1 This is also confirmed by SEIM, who observed a decrease in cilia beating frequency.
There are several limitations to these studies. First, since we cannot ensure which exact stem of the bronchus the OCT probe was inserted into, it is impossible to precisely place the OCT probe in the same bronchus at each time point. Therefore, in this study, we only analyzed the main trachea. Our 1.2 mm (excluding protection sheath) minimized OCT probe can reach the bronchioles. Future developments in probe guidance technology, such as CT image guidance or position tracking sensors, can be applied to address this problem. Second, because of the safety concerns of chlorine gas, the exposure circuit needs to be placed in a chemical fume hood. This makes OCT imaging and chlorine exposure in different rooms and animals require about 2-min of transportation and reconnection of the ventilator. This may introduce extra displacement of the trachea. Although the distal end of the endotracheal tube has a bloom structure that will hold the ET tube in place, the bending of the entire trachea and the position of the rabbit will cause a shift of the OCT image from the baseline to the post exposure dataset. Finally, the SEIM system used in this study only provides ex vivo cilia beating analysis. The complexity of the optical design presents additional challenges for integration into endoscopic probes. In addition, we need to overcome the motion artifacts introduced by heartbeat and airflow. We are currently working on adapting the SEIM setup for in vivo use.
The study shows that it is feasible to use minimally invasive flexible fiberoptic OCT to assess airway acute chlorine inhalation injury in vivo. Changes in the epithelial and mucosal airway structures were noticeable as soon as 30 min after exposure to chlorine inhalation. SEIM provides a method to observe a decrease in cilia movability and beating frequency after a chlorine inhalation injury. Future studies will include identifying the reasons for possible variations in response to chlorine among regions and individuals, as well as compliance studies and in vivo spectrally encoded interferometric endoscope development. Most importantly, in both animal models and patients with inhalation chlorine injury, long-term studies will be crucial to investigate the correlation between acute airway changes and the later development of airway compromise.
SUPPLEMENTARY MATERIAL
The results of the statistical analysis are provided in the supplementary material.
ACKNOWLEDGMENTS
This work was supported by the National Institute of Health (Grant Nos. R01EB-030558, R01HL-125084, and R01EB-030024), Air Force Office Scientific Research (Grant No. FA9550-23-1-0685), the NIH CounterACT Program, and the National Institute of Environmental Health Sciences (Grant No. U54 ES027698) (CWW). Dr. Hyunmo Yang is a visiting scholar from the Department of Biomedical Engineering, Ulsan National Institute of Science and Technology (UNIST), supported by the grant of the Korea Health Technology R&D Project through the Korea Health Industry Development Institute (KHIDI), funded by the Ministry of Health and Welfare, Republic of Korea (Grant No. HI19C1095), and by the Korea Medical Device Development Fund grant funded by the Korea government (the Ministry of Science and ICT, the Ministry of Trade, Industry, and Energy, the Ministry of Health and Welfare, the Ministry of Food and Drug Safety) (Project Nos. 1711194191 and RS-2020-KD000024).
Note: This paper is part of the APL Photonics Special Topic on Photonics in Biomedicine.
Contributor Information
Woonggyu Jung, Email: mailto:wgjung@unist.ac.kr.
Zhongping Chen, Email: mailto:z2chen@uci.edu.
AUTHOR DECLARATIONS
Conflict of Interest
The authors have no conflicts to disclose.
Ethics Approval
This study was approved by the University of California Irvine (UCI) Accreditation of Laboratory Animal Care (AAALAC) accredited Animal Research Committee (ARC) and the Department of Defense ARC in compliance with all state and federal animal welfare regulations.
Author Contributions
Z.Z. and H.Y. contributed equally to this work.
Zhikai Zhu: Data curation (equal); Investigation (equal); Methodology (equal); Writing – original draft (equal). Hyunmo Yang: Data curation (equal); Formal analysis (equal); Methodology (equal); Writing – original draft (equal). Hongqiu Lei: Data curation (supporting); Formal analysis (supporting); Writing – original draft (supporting). Yusi Miao: Methodology (supporting). George Philipopoulos: Investigation (supporting). Melody Doosty: Investigation (supporting). David Mukai: Investigation (supporting). Yuchen Song: Writing – original draft (supporting). Jangwoen Lee: Investigation (supporting). Sari Mahon: Supervision (supporting). Matthew Brenner: Supervision (supporting). Livia Veress: Supervision (supporting). Carl White: Supervision (supporting). Woonggyu Jung: Supervision (equal). Zhongping Chen: Supervision (equal).
DATA AVAILABILITY
The data underlying the results presented in this paper are not publicly available at this time but may be obtained from the authors upon reasonable request.
REFERENCES
- 1.Hoyle G. W. and Svendsen E. R., “Persistent effects of chlorine inhalation on respiratory health,” Ann. N. Y. Acad. Sci. 1378, 33–40 (2016). 10.1111/nyas.13139 [DOI] [PMC free article] [PubMed] [Google Scholar]
- 2.Achanta S. and Jordt S. E., “Toxic effects of chlorine gas and potential treatments: A literature review,” Toxicol. Mech. Methods 31, 244–256 (2021). 10.1080/15376516.2019.1669244 [DOI] [PMC free article] [PubMed] [Google Scholar]
- 3.Jones R., Wills B., and Kang C., “Chlorine gas: An evolving hazardous material threat and unconventional weapon,” West J Emerg Med. 11(2), 151–156 (2010). [PMC free article] [PubMed] [Google Scholar]
- 4.Hunt J. L., Agee R. N., and B. A. Pruitt, Jr., “Fiberoptic bronchoscopy in acute inhalation injury,” J. Trauma: Inj. Infection Crit. Care 15, 641 (1975). 10.1097/00005373-197508000-00004 [DOI] [PubMed] [Google Scholar]
- 5.Endorf F. W. and Gamelli R. L., “Inhalation injury, pulmonary perturbations, and fluid resuscitation,” J Burn Care Res. 28(1), 80–83 (2007). 10.1097/BCR.0B013E31802C889F [DOI] [PubMed] [Google Scholar]
- 6.Walker P. F., Buehner M. F., Wood L. A., Boyer N. L., Driscoll I. R., Lundy J. B., Cancio L. C., and Chung K. K., “Diagnosis and management of inhalation injury: An updated review,” Crit. Care 19, 351 (2015). 10.1186/s13054-015-1077-4 [DOI] [PMC free article] [PubMed] [Google Scholar]
- 7.Fang-Gang N., Yang C., Yu-Xuan Q., Yan-Hua R., Wei-Li D., Cheng W., Chun-Quan W., and Guo-An Z., “Laryngeal morphologic changes and epidemiology in patients with inhalation injury: A retrospective study,” Burns 41, 1340–1346 (2015). 10.1016/j.burns.2015.02.003 [DOI] [PubMed] [Google Scholar]
- 8.Li Y., Zhu Z., Chen J. J., Jing J. C., Sun C.-H., Kim S., Chung P.-S., and Chen Z., “Multimodal endoscopy for colorectal cancer detection by optical coherence tomography and near-infrared fluorescence imaging,” Biomed. Opt. Express 10, 2419–2429 (2019). 10.1364/boe.10.002419 [DOI] [PMC free article] [PubMed] [Google Scholar]
- 9.Luo S., Holland G., Mikula E., Bradford S., Khazaeinezhad R., Jester J. V., and Juhasz T., “Dispersion compensation for spectral domain optical coherence tomography by time-frequency analysis and iterative optimization,” Opt. Continuum 1, 1117–1136 (2022). 10.1364/optcon.455242 [DOI] [Google Scholar]
- 10.Luo S., Holland G., Khazaeinezhad R., Bradford S., Joshi R., and Juhasz T., “Iridocorneal angle imaging of a human donor eye by spectral-domain optical coherence tomography,” Sci. Rep. 13, 13861 (2023). 10.1038/s41598-023-37248-0 [DOI] [PMC free article] [PubMed] [Google Scholar]
- 11.Qiu S., Arthur A., Jiang Y., Miao Y., Li Y., Wang J., Tadir Y., Lane F., and Chen Z., “OCT angiography in the monitoring of vaginal health,” APL Bioeng. 7, 046112 (2023). 10.1063/5.0153461 [DOI] [PMC free article] [PubMed] [Google Scholar]
- 12.Luo S., Mikula E. R., Khazaeinezhad R., Bradford S. M., Zhang F., Jester J. V., and Juhasz T., “Evaluating the effect of pulse energy on femtosecond laser trabeculotomy (FLT) outflow channels for glaucoma treatment in human cadaver eyes,” Lasers Surg. Med. 56, 382–391 (2024). 10.1002/lsm.23783 [DOI] [PMC free article] [PubMed] [Google Scholar]
- 13.Zhang F., Li R., Li Y., Zhu Z., Zhou Q., and Chen Z., “Quantitative optical coherence elastography of the optic nerve head in vivo,” IEEE Trans. Biomed. Eng. 71, 732–737 (2024). 10.1109/tbme.2023.3316606 [DOI] [PMC free article] [PubMed] [Google Scholar]
- 14.Brenner M., Kreuter K., Ju J., Mahon S., Tseng L., Mukai D., Burney T., Guo S., Su J., Tran A., Batchinsky A., Cancio L. C., Narula N., and Chen Z., “In vivo optical coherence tomography detection of differences in regional large airway smoke inhalation induced injury in a rabbit model,” J. Biomed. Opt. 13, 034001 (2008). 10.1117/1.2939400 [DOI] [PMC free article] [PubMed] [Google Scholar]
- 15.Miao Y., Jing J. C., Desai V., Mahon S. B., Brenner M., Veress L. A., White C. W., and Chen Z., “Automated 3D segmentation of methyl isocyanate-exposed rat trachea using an ultra-thin, fully fiber optic optical coherence endoscopic probe,” Sci. Rep. 8, 8713 (2018). 10.1038/s41598-018-26389-2 [DOI] [PMC free article] [PubMed] [Google Scholar]
- 16.Miao Y., Brenner M., and Chen Z., “Endoscopic optical coherence tomography for assessing inhalation airway injury: A technical review,” Otolaryngology (Sunnyvale, Calif.) 9, 366 (2019). 10.4172/2161-119X.1000366 [DOI] [PMC free article] [PubMed] [Google Scholar]
- 17.Miao Y., Choi J. H., Chou L.-D., Desai V., Roberts T. R., Beely B. M., Wendorff D. S., Espinoza M., Sieck K., Cancio L. C. et al. , “Automatic proximal airway volume segmentation using optical coherence tomography for assessment of inhalation injury,” J. Trauma Acute Care Surg. 87, S132–S137 (2019). 10.1097/ta.0000000000002277 [DOI] [PubMed] [Google Scholar]
- 18.Kugelman J., Allman J., Read S. A., Vincent S. J., Tong J., Kalloniatis M., Chen F. K., Collins M. J., and Alonso-Caneiro D., “A comparison of deep learning U-Net architectures for posterior segment OCT retinal layer segmentation,” Sci. Rep. 12, 14888 (2022). 10.1038/s41598-022-18646-2 [DOI] [PMC free article] [PubMed] [Google Scholar]
- 19.Sreeramachandra Murthy R., Miao Y., Chou L.-D., Batchinsky A., and Chen Z., “Deep learning-based assessment of acute respiratory distress syndrome (ARDS) using optical coherence tomography (OCT),” Proc. SPIE 12354, 123540K (2023). 10.1117/12.2670002 [DOI] [Google Scholar]
- 20.Sreeramachandra Murthy R., Chou L.-D., Batchinsky A., and Chen Z., “Assessment of proximal airway volume (PAV) in acute respiratory distress syndrome (ARDS) using optical coherence tomography (OCT) through deep learning,” Proc. SPIE PC12818, (2024). 10.1117/12.3003599 [DOI] [Google Scholar]
- 21.Işın A., Direkoğlu C., and Şah M., “Review of MRI-based brain tumor image segmentation using deep learning methods,” Procedia Comput. Sci. 102, 317–324 (2016). 10.1016/j.procs.2016.09.407 [DOI] [Google Scholar]
- 22.Duadi D., Shabairou N., Primov-Fever A., and Zalevsky Z., “Non-contact optical in-vivo sensing of cilia motion by analyzing speckle patterns,” Sci. Rep. 12, 16614 (2022). 10.1038/s41598-022-20557-1 [DOI] [PMC free article] [PubMed] [Google Scholar]
- 23.He Y., Qu Y., Jing J. C., and Chen Z., “Characterization of oviduct ciliary beat frequency using real time phase resolved Doppler spectrally encoded interferometric microscopy,” Biomed. Opt. Express 10, 5650–5659 (2019). 10.1364/boe.10.005650 [DOI] [PMC free article] [PubMed] [Google Scholar]
- 24.Jing J. C., Chen J. J., Chou L., Wong B. J. F., and Chen Z., “Visualization and detection of ciliary beating pattern and frequency in the upper airway using phase resolved Doppler optical coherence tomography,” Sci. Rep. 7, 8522 (2017). 10.1038/s41598-017-08968-x [DOI] [PMC free article] [PubMed] [Google Scholar]
- 25.Zhao Y., Chen Z., Saxer C., Xiang S., de Boer J. F., and Nelson J. S., “Phase-resolved optical coherence tomography and optical Doppler tomography for imaging blood flow in human skin with fast scanning speed and high velocity sensitivity,” Opt. Lett. 25, 114–116 (2000). 10.1364/ol.25.000114 [DOI] [PubMed] [Google Scholar]
- 26.Chen Z., Milner T. E., Srinivas S., Wang X. J., Malekafzali A., van Gemert M. J. C., and Nelson J. S., “Noninvasive imaging of in vivo blood flow velocity using optical Doppler tomography,” Opt. Lett. 22, 1119–1121 (1997). 10.1364/ol.22.001119 [DOI] [PubMed] [Google Scholar]
- 27.Chen Z., Milner T. E., Dave D., and Nelson J. S., “Optical Doppler tomographic imaging of fluid flow velocity in highly scattering media,” Opt. Lett. 22, 64–66 (1997). 10.1364/ol.22.000064 [DOI] [PubMed] [Google Scholar]
- 28.Song Y., Wei S., Li Y., Zhang F., Zhu Z., Chou L., Jia W., Li R., Zhou Q., and Chen Z., “Real-time mapping of photo-sono therapy induced cavitation using Doppler optical coherence tomography,” Opt. Lett. 49(17), 4843–4846 (2024). 10.1364/OL.532993 [DOI] [PMC free article] [PubMed] [Google Scholar]
- 29.He Y., Jing J. C., Qu Y., Wong B. J., and Chen Z., “Spatial mapping of tracheal ciliary beat frequency using real time phase-resolved Doppler spectrally encoded interferometric microscopy,” ACS Photonics 7, 128–134 (2019). 10.1021/acsphotonics.9b01235 [DOI] [PMC free article] [PubMed] [Google Scholar]
- 30.Oktay O., Schlemper J., Folgoc L. L., Lee M., Heinrich M., Misawa K., Mori K., McDonagh S., Hammerla N. Y., and Kainz B., “Attention U-Net: Learning where to look for the pancreas,” arXiv:1804.03999 (2018).
- 31.Kingma D. P. and Ba J., “Adam: A method for stochastic optimization,” arXiv:1412.6980 (2014).
- 32.White C. W. and Martin J. G., “Chlorine gas inhalation: Human clinical evidence of toxicity and experience in animal models,” Proc. Am. Thorac. Soc. 7, 257–263 (2010). 10.1513/pats.201001-008sm [DOI] [PMC free article] [PubMed] [Google Scholar]
Associated Data
This section collects any data citations, data availability statements, or supplementary materials included in this article.
Data Availability Statement
The data underlying the results presented in this paper are not publicly available at this time but may be obtained from the authors upon reasonable request.


