

Abstract
Background:
The cost-to-charge ratio reflects the markup of hospital services. A lower cost-to-charge ratio indicates lower costs and/or greater charges. This study examines factors associated with cost-to-charge ratio trends to determine whether decreasing cost-to-charge ratio is associated with worse surgical outcomes.
Methods:
The Florida Agency for Healthcare Administration Inpatient database (2018–2020) was queried for common surgical procedures and linked to the Distressed Communities Index, RAND Corporation Hospital data, Center for Medicare Services Cost Reports, and American Hospital Association data. Only hospitals with monotonically increasing or decreasing cost-to-charge ratio were included in the study. Univariable analysis compared these hospitals. Using patient-level data, interpretable machine learning predicted cost-to-charge ratio trend while identifying influential factors.
Results:
The cohort had 67 hospitals (27 increasing cost-to-charge ratio and 40 decreasing cost-to-charge ratio) with 35,661 surgeries. Decreasing cost-to-charge ratio hospitals were more often proprietarily owned (78% vs 33%, P = .01) and had greater mean total charges ($134,349 ± $114,510 vs $77,185 ± $82,027, P < .01) with marginally greater mean estimated costs ($14,863 ± $12,343 vs $14,458 ± $15,440, P < .01). Patients from decreasing cost-to-charge ratio hospitals had greater rates of most comorbidities (P < .05) but no difference in mortality or overall complications. Machine-learning models revealed charges rather than clinical factors as most influential in cost-to-charge ratio trend prediction.
Conclusions:
Decreasing cost-to-charge ratio hospitals charge vastly more despite minimally greater estimated costs and no difference in outcomes. Although differences in case-mix existed, charges were the predominant differentiators. Patient clinical factors had far less of an impact.
Introduction
US health expenditures are predicted to outpace the growth in gross domestic product throughout this decade.1 As a result, the pricing of hospital services continues to be a contentious topic within health care finance.2 The cost-to-charge ratio (CCR) is a measure that assesses the markup of hospital services and is calculated by dividing total Medicare-allowable expenses for all patients (ie, total cost) by total hospital charges.3 Hospitals strive for a lower CCR, as this indicates lower costs relative to charges billed. CCR varies widely between hospitals depending on hospital ownership, size, region, teaching status, and patient demographics.4–8 More specifically, surgical charges have been found to vary by geography, hospital ownership, and procedure type.7–11
In most states, hospitals have historically set their own markup prices without governmental restrictions. Although multiple studies have shown the average procedure markup to be 3 times the Medicare-allowable costs, Bai and Anderson12 and Gani et al4 found the most expensive hospitals charge more than 9 times the Medicare-allowable costs. Although public insurers can set reimbursement rates and in-network private insurers can negotiate final reimbursements, uninsured patients, privately insured out-of-network patients, and workers compensation insurers can be left paying full markup charges.2,12,13 This inequitable pricing practice has left the most vulnerable patients with the greatest charges, leading to public outrage and attempts at achieving price transparency and prohibition of surprise billing.14,15
Previous studies have shown that more expensive hospitals do not provide better surgical outcomes.4,16 Although charges and costs have each been used to assess differences in patient outcomes, to our knowledge, the association of CCR trends with surgical outcomes has not been investigated. Thus, this study compared hospitals with increasing CCR to those with decreasing CCR to determine how these changes are associated with surgical outcomes. In addition, interpretable machine learning was applied to predict CCR trend using surgical patient data with the goal of identifying influential factors.
Methods
This study was exempt from the institutional review board, as it used a state-level deidentified database. The 2018–2020 Florida Agency for Healthcare Administration Inpatient database was queried for open, laparoscopic (or thoracoscopic), and robotic hysterectomy, sleeve gastrectomy, gastric bypass, antireflux surgery, colectomy, ventral hernia repair, and pulmonary lobectomy in adult patients (≥18 year old). These inpatient procedures were chosen as they are common, wide-ranging, and performed by all 3 surgical approaches. International Classification of Diseases, Tenth Revision, Procedure Coding System codes were used for querying procedure type and open or laparoscopic approach. Robotic approaches were captured if a robotic qualifier was present with the primary procedure code.
The resulting cohort was linked to the Distressed Communities Index17 by hospital ZIP code and to RAND Corporation Hospital data, Center for Medicare Services Cost Reports, and American Hospital Association data by hospital Medicare number. Hospitals with less than 3 years of data were excluded. Yearly trends in CCR were examined, and hospitals with monotonically increasing or decreasing CCR were kept for further analysis. As individual cost data are unavailable, patient charge data were used in conjunction with hospital CCR to calculate estimated costs.3 Univariate analysis was performed using t tests and χ2 tests. A P < .05 was considered significant. Data preprocessing and descriptive statistical analysis were performed using STATA, Version 17 (StataCorp, College Station, TX).
Light Gradient Boosting Machine (LightGBM) models were employed for predicting CCR trend using patient-level factors including demographics, comorbidities, complications, length of stay, type of procedure, and charges. An 80:20 train/test split was used. LightGBM is an advanced gradient boosting framework designed for uncovering complex, nonlinear relationships.18 SHapley Additive exPlanations (SHAP) was then used for interpretation. SHAP is a tool derived from Shapley values, a game theory concept that determines the average marginal contributions of players in a coalition game.19 When applied to machine-learning models, SHAP explains a model by assessing the contribution of each variable to individual predictions.20 The unit of SHAP values is the model’s predicted log odds. The sum of all SHAP values for a given patient equals the difference between that patient’s predicted log odds and the average predicted log odds from the model.21 Mean absolute SHAP values were calculated to determine the most influential variables for all predictions. Modeling and SHAP analysis were completed in R Studio Statistical Analysis software (Version 2023.03.0 Build 386) with the ‘lightgbm’ (version 3.3.5) and ‘SHAPforxgboost’ (version 0.1.3) packages.
Results
Study population
There were 83,979 surgeries included from 146 hospitals. Analysis of CCR trends revealed 27 hospitals with monotonically increasing CCR, 40 with monotonically decreasing CCR, and 79 with fluctuating CCR. Hospitals with fluctuating CCR were excluded from further analysis and modeling. The final cohort had 35,661 surgeries—15,809 surgeries from the 27 increasing CCR hospitals and 19,852 from the 40 decreasing CCR hospitals. Most patients were female (74.8%), aged 31–50 years (38.8%), and White (70.5%). The priority of admissions was 79.1% elective, 15.1% emergent, 5.4% urgent, and 0.3% trauma (Table I).
Table I.
Patient demographics and presenting characteristics*
| Total (n = 35,661) | Increasing CCR (n = 15,809) | Decreasing CCR (n = 19,852) | P value | |
|---|---|---|---|---|
| Age, yr, mean ± SD | 54 ± 16 | 53 ± 16 | 55 ± 16 | <.01 |
| Patient sex | <.01 | |||
| Female | 26,665 (74.8%) | 12,054 (76.2%) | 14,611 (73.6%) | |
| Male | 8,996 (25.2%) | 3,755 (23.8%) | 5,241 (26.4%) | |
| Ethnicity | <.01 | |||
| Non-Hispanic | 27,370 (76.8%) | 11,149 (70.5%) | 16,221 (81.7%) | |
| Hispanic Latino | 8,291 (23.2%) | 4,660 (29.5%) | 3,631 (18.3%) | |
| Race | <.01 | |||
| White | 25,142 (70.5%) | 11,062 (70.0%) | 14,080 (70.9%) | |
| Black | 7,627 (21.4%) | 4,114 (26.0%) | 3,513 (17.7%) | |
| Asian | 267 (0.7%) | 134 (0.8%) | 133 (0.7%) | |
| American Indian | 46 (0.1%) | 20 (0.1%) | 26 (0.1%) | |
| Hawaiian Pacific | 20 (0.1%) | 12 (0.1%) | 8 (0.0%) | |
| All other races | 2,559 (7.2%) | 467 (3.0%) | 2,092 (10.5%) | |
| Payer types | <.01 | |||
| Medicare | 11,988 (33.6%) | 4,611 (29.2%) | 7,377 (37.2%) | |
| Medicaid | 3,215 (9.0%) | 1,653 (10.5%) | 1,562 (7.9%) | |
| Commercial | 16,364 (45.9%) | 7,284 (46.1%) | 9,080 (45.7%) | |
| All others | 2,093 (5.9%) | 1,131 (7.2%) | 962 (4.8%) | |
| Self-pay | 2,001 (5.6%) | 1,130 (7.1%) | 871 (4.4%) | |
| Admission priority | <.01 | |||
| Emergency | 5,402 (15.1%) | 2,198 (13.9%) | 3,204 (16.1%) | |
| Urgent | 1,931 (5.4%) | 314 (2.0%) | 1,617 (8.1%) | |
| Elective | 28,212 (79.1%) | 13,252 (83.8%) | 14,960 (75.4%) | |
| Trauma | 116 (0.3%) | 45 (0.3%) | 71 (0.4%) | |
| Admission source | <.01 | |||
| Nonhealth care facility (ie, home) | 25,679 (72.0%) | 12,103 (76.6%) | 13,576 (68.4%) | |
| Clinic or physician’s office | 9,657 (27.1%) | 3,572 (22.6%) | 6,085 (30.7%) | |
| Transfers | 325 (0.9%) | 134 (0.8%) | 191 (1.0%) | |
| Day of admission | <.01 | |||
| Weekday | 33,916 (95.1%) | 15,133 (95.7%) | 18,783 (94.6%) | |
| Weekend | 1,745 (4.9%) | 676 (4.3%) | 1,069 (5.4%) | |
| Charlson Comorbidity Index | <.01 | |||
| 0 | 18,526 (52.0%) | 8,188 (51.8%) | 10,338 (52.1%) | |
| 1 | 8,836 (24.8%) | 4,060 (25.7%) | 4,776 (24.1%) | |
| ≥2 | 8,299 (23.3%) | 3,561 (22.5%) | 4,738 (23.9%) | |
| Comorbidities | ||||
| Myocardial infarction | 60 (0.2%) | 11 (0.1%) | 49 (0.2%) | <.01 |
| Congestive heart failure | 1,495 (4.2%) | 589 (3.7%) | 906 (4.6%) | <.01 |
| Peripheral vascular disease | 866 (2.4%) | 317 (2.0%) | 549 (2.8%) | <.01 |
| Stroke | 165 (0.5%) | 58 (0.4%) | 107 (0.5%) | .02 |
| Dementia | 347 (1.0%) | 127 (0.8%) | 220 (1.1%) | <.01 |
| Chronic pulmonary disease | 5,930 (16.6%) | 2,405 (15.2%) | 3,525 (17.8%) | <.01 |
| Rheumatic disease | 721 (2.0%) | 290 (1.8%) | 431 (2.2%) | .03 |
| Peptic ulcer disease | 315 (0.9%) | 108 (0.7%) | 207 (1.0%) | <.01 |
| Mild liver condition | 2,799 (7.8%) | 1,570 (9.9%) | 1,229 (6.2%) | <.01 |
| Uncomplicated diabetes | 6,495 (18.2%) | 3,058 (19.3%) | 3,437 (17.3%) | <.01 |
| Complicated diabetes | 1,825 (5.1%) | 756 (4.8%) | 1,069 (5.4%) | .01 |
| Paralysis | 53 (0.1%) | 21 (0.1%) | 32 (0.2%) | .49 |
| Renal disease | 2,110 (5.9%) | 778 (4.9%) | 1,332 (6.7%) | <.01 |
| Cancer | 1,407 (3.9%) | 558 (3.5%) | 849 (4.3%) | <.01 |
| Severe liver condition | 98 (0.3%) | 31 (0.2%) | 67 (0.3%) | .01 |
| Metastatic solid tumor | 1,642 (4.6%) | 805 (5.1%) | 837 (4.2%) | <.01 |
| HIV | 39 (0.1%) | 17 (0.1%) | 22 (0.1%) | .93 |
| Asthma | 3,115 (8.7%) | 1,376 (8.7%) | 1,739 (8.8%) | .85 |
| Diagnoses present on admission | ||||
| Pneumonia | 199 (0.6%) | 62 (0.4%) | 137 (0.7%) | <.01 |
| Pleural effusion | 258 (0.7%) | 102 (0.6%) | 156 (0.8%) | .12 |
| Pneumothorax | 130 (0.4%) | 28 (0.2%) | 102 (0.5%) | <.01 |
| Respiratory failure | 460 (1.3%) | 143 (0.9%) | 317 (1.6%) | <.01 |
| Pulmonary edema | 43 (0.1%) | 14 (0.1%) | 29 (0.1%) | .12 |
| Arrhythmia | 2,348 (6.6%) | 855 (5.4%) | 1,493 (7.5%) | <.01 |
| Congestive heart failure | 1,245 (3.5%) | 473 (3.0%) | 772 (3.9%) | <.01 |
| Angina pectoris | 19 (0.1%) | 8 (0.1%) | 11 (0.1%) | .85 |
| Myocardial infarction | 60 (0.2%) | 11 (0.1%) | 49 (0.2%) | <.01 |
| Cardiac arrest | 27 (0.1%) | 9 (0.1%) | 18 (0.1%) | .25 |
| Cardiogenic shock | 10 (0.0%) | 4 (0.0%) | 6 (0.0%) | .78 |
| Sepsis | 313 (0.9%) | 122 (0.8%) | 191 (1.0%) | .06 |
| Surgical-site infection | 46 (0.1%) | 20 (0.1%) | 26 (0.1%) | .91 |
| Urinary tract infection | 613 (1.7%) | 233 (1.5%) | 380 (1.9%) | <.01 |
| Intestinal infection | 7 (0.0%) | 3 (0.0%) | 4 (0.0%) | .94 |
| Meningitis | 1 (0.0%) | 1 (0.0%) | 0 (0.0%) | .26 |
| Pericarditis | 30 (0.1%) | 10 (0.1%) | 20 (0.1%) | .23 |
| Clostridium difficile | 32 (0.1%) | 9 (0.1%) | 23 (0.1%) | .07 |
| Wound breakdown | 28 (0.1%) | 10 (0.1%) | 18 (0.1%) | .36 |
| Pulmonary embolism | 75 (0.2%) | 28 (0.2%) | 47 (0.2%) | .22 |
| Deep vein thrombosis | 115 (0.3%) | 38 (0.2%) | 77 (0.4%) | .02 |
| Delirium | 28 (0.1%) | 9 (0.1%) | 19 (0.1%) | .19 |
| Cerebrovascular accident | 165 (0.5%) | 58 (0.4%) | 107 (0.5%) | .02 |
| Pressure ulcer | 10 (0.0%) | 2 (0.0%) | 8 (0.0%) | .12 |
| Acute kidney injury | 1,245 (3.5%) | 428 (2.7%) | 817 (4.1%) | <.01 |
| Septic shock | 2 (0.0%) | 0 (0.0%) | 2 (0.0%) | .21 |
CCR, cost-to-charge ratio; HIV, human immunodeficiency virus; SD, standard deviation.
All displayed as n (%) unless specified.
Univariable analysis
Increasing CCR hospitals had a greater percentage of Hispanic (29.5% vs 18.3%, P < .01), uninsured (7.1% vs 4.4%, P < .01), Medicaid (10.5% vs 7.9%, P < .01), and patients undergoing elective surgery (83.8% vs 75.4%, P < .01). Decreasing CCR hospitals had greater rates of most comorbidities (P < .05) and had greater rates of acute diagnoses present on admission including pneumonia, pneumothorax, respiratory failure, urinary tract infection, deep vein thrombosis, stroke, acute kidney injury, arrythmias, congestive heart failure, and myocardial infarction (all P < .05; Table I). Decreasing CCR hospitals performed a greater percentage of open and robotic cases (41% and 27% vs 36% and 17%, respectively, P < .01). In addition, increasing CCR hospitals performed a greater percentage of sleeve gastrectomy (36.8% vs 25.1%, P < .01) while decreasing CCR hospitals performed a greater percentage of all other surgeries (Table II).
Table II.
Surgical volumes by procedure*
| Total (n = 35,661) | Increasing CCR (n = 15,809) | Decreasing CCR (n = 19,852) | P value | |
|---|---|---|---|---|
| Surgery approach | <.01 | |||
| Open | 13,881 (38.9%) | 5,735 (36.3%) | 8,146 (41.0%) | |
| Laparoscopic | 13,751 (38.6%) | 7,389 (46.7%) | 6,362 (32.0%) | |
| Robotic | 8,029 (22.5%) | 2,685 (17.0%) | 5,344 (26.9%) | |
| Surgery type | <.01 | |||
| Hysterectomy | 8,619 (24.2%) | 3,776 (23.9%) | 4,843 (24.4%) | |
| Sleeve | 10,808 (30.3%) | 5,819 (36.8%) | 4,989 (25.1%) | |
| Gastric bypass | 2,919 (8.2%) | 1,187 (7.5%) | 1,732 (8.7%) | |
| Antireflux | 659 (1.8%) | 253 (1.6%) | 406 (2.0%) | |
| Colectomy | 6,084 (17.1%) | 2,501 (15.8%) | 3,583 (18.0%) | |
| Ventral hernia | 4,303 (12.1%) | 1,457 (9.2%) | 2,846 (14.3%) | |
| Lobectomy | 2,269 (6.4%) | 816 (5.2%) | 1,453 (7.3%) | |
| Surgery | <.01 | |||
| Open hysterectomy | 6,582 (18.5%) | 3,085 (19.5%) | 3,497 (17.6%) | |
| Lap hysterectomy | 590 (1.7%) | 243 (1.5%) | 347 (1.7%) | |
| Robotic hysterectomy | 1,447 (4.1%) | 448 (2.8%) | 999 (5.0%) | |
| Laparoscopic sleeve | 8,087 (22.7%) | 4,812 (30.4%) | 3,275 (16.5%) | |
| Robotic sleeve | 2,721 (7.6%) | 1,007 (6.4%) | 1,714 (8.6%) | |
| Open gastric bypass | 381 (1.1%) | 136 (0.9%) | 245 (1.2%) | |
| Laparoscopic gastric bypass | 1,573 (4.4%) | 764 (4.8%) | 809 (4.1%) | |
| Robotic gastric bypass | 965 (2.7%) | 287 (1.8%) | 678 (3.4%) | |
| Open antireflux | 37 (0.1%) | 13 (0.1%) | 24 (0.1%) | |
| Laparoscopic antireflux | 423 (1.2%) | 190 (1.2%) | 233 (1.2%) | |
| Robotic antireflux | 199 (0.6%) | 50 (0.3%) | 149 (0.8%) | |
| Open colectomy | 3,413 (9.6%) | 1,389 (8.8%) | 2,024 (10.2%) | |
| Laparoscopic colectomy | 1,733 (4.9%) | 821 (5.2%) | 912 (4.6%) | |
| Robotic colectomy | 938 (2.6%) | 291 (1.8%) | 647 (3.3%) | |
| Open ventral hernia | 2,869 (8.0%) | 942 (6.0%) | 1,927 (9.7%) | |
| Laparoscopic ventral hernia | 802 (2.2%) | 335 (2.1%) | 467 (2.4%) | |
| Robotic ventral hernia | 632 (1.8%) | 180 (1.1%) | 452 (2.3%) | |
| Open lobectomy | 599 (1.7%) | 170 (1.1%) | 429 (2.2%) | |
| Thoracoscopic lobectomy | 543 (1.5%) | 224 (1.4%) | 319 (1.6%) | |
| Robotic lobectomy | 1,127 (3.2%) | 422 (2.7%) | 705 (3.6%) |
CCR, cost-to-charge ratio.
All displayed as n (%) unless specified.
Despite differences in case mix, there was no difference in mortality or overall complication rate. There were, however, minor differences in a few specific postoperative complications: increasing CCR hospitals had greater rates of pleural effusions (0.9% vs 0.7%, P = .04) and pulmonary embolisms (0.3% vs 0.2%, P = .03), and decreasing CCR hospitals had greater rates of myocardial infarctions (0.3% vs 0.1%, P = .03). Decreasing CCR hospitals also had a longer average length of stay (3.9 ± 5.5 vs 3.5 ± 5.2 days, P < .01) and were less likely to be discharged home (82.5% vs 87.8%, P < .01; Table III).
Table III.
Patient outcomes*
| Total (n = 35,661) | Increasing CCR (n = 15,809) | Decreasing CCR (n = 19,852) | P value | |
|---|---|---|---|---|
| Length of stay, d, mean ± SD | 3.7 ± 5.4 | 3.5 ± 5.2 | 3.9 ± 5.5 | <.01 |
| Patient discharge status | <.01 | |||
| Home | 30,273 (84.9%) | 13,888 (87.8%) | 16,385 (82.5%) | |
| Skilled nursing facility | 994 (2.8%) | 323 (2.0%) | 671 (3.4%) | |
| Intermediate care facility | 263 (0.7%) | 119 (0.8%) | 144 (0.7%) | |
| Home health care | 3,423 (9.6%) | 1,215 (7.7%) | 2,208 (11.1%) | |
| Left against medical advice | 58 (0.2%) | 14 (0.1%) | 44 (0.2%) | |
| Died | 265 (0.7%) | 114 (0.7%) | 151 (0.8%) | |
| Hospice | 205 (0.6%) | 57 (0.4%) | 148 (0.7%) | |
| Inpatient rehabilitation facility | 180 (0.5%) | 79 (0.5%) | 101 (0.5%) | |
| In-hospital mortality | 265 (0.7%) | 114 (0.7%) | 151 (0.8%) | .67 |
| Postoperative complication | 2,815 (7.9%) | 1,217 (7.7%) | 1,598 (8.0%) | .22 |
| Pneumonia | 338 (0.9%) | 150 (0.9%) | 188 (0.9%) | .99 |
| Pleural effusion | 267 (0.7%) | 135 (0.9%) | 132 (0.7%) | .04 |
| Pneumothorax | 262 (0.7%) | 110 (0.7%) | 152 (0.8%) | .44 |
| Respiratory failure | 775 (2.2%) | 341 (2.2%) | 434 (2.2%) | .85 |
| Pulmonary edema | 71 (0.2%) | 36 (0.2%) | 35 (0.2%) | .28 |
| Congestive heart failure | 102 (0.3%) | 44 (0.3%) | 58 (0.3%) | .81 |
| Angina pectoris | 1 (0.0%) | 1 (0.0%) | 0 (0.0%) | .26 |
| Myocardial infarction | 80 (0.2%) | 23 (0.1%) | 57 (0.3%) | <.01 |
| Cardiac arrest | 92 (0.3%) | 35 (0.2%) | 57 (0.3%) | .22 |
| Cardiogenic shock | 30 (0.1%) | 12 (0.1%) | 18 (0.1%) | .63 |
| Sepsis | 410 (1.1%) | 163 (1.0%) | 247 (1.2%) | .06 |
| Surgical-site infection | 131 (0.4%) | 65 (0.4%) | 66 (0.3%) | .22 |
| Urinary tract infection | 187 (0.5%) | 92 (0.6%) | 95 (0.5%) | .18 |
| Intestinal infection | 4 (0.0%) | 1 (0.0%) | 3 (0.0%) | .44 |
| Meningitis | 0 (0.0%) | 0 (0.0%) | 0 (0.0%) | n/a |
| Pericarditis | 8 (0.0%) | 3 (0.0%) | 5 (0.0%) | .7 |
| Clostridium difficile | 44 (0.1%) | 25 (0.2%) | 19 (0.1%) | .01 |
| Wound breakdown | 95 (0.3%) | 38 (0.2%) | 57 (0.3%) | .39 |
| Postoperative bleeding | 124 (0.3%) | 55 (0.3%) | 69 (0.3%) | 1 |
| Pulmonary embolism | 92 (0.3%) | 51 (0.3%) | 41 (0.2%) | .03 |
| Deep vein thrombosis | 148 (0.4%) | 62 (0.4%) | 86 (0.4%) | .55 |
| Delirium | 91 (0.3%) | 39 (0.2%) | 52 (0.3%) | .78 |
| Cerebrovascular accident | 49 (0.1%) | 19 (0.1%) | 30 (0.2%) | .43 |
| Pressure ulcer | 5 (0.0%) | 0 (0.0%) | 5 (0.0%) | .05 |
| Acute kidney injury | 771 (2.2%) | 346 (2.2%) | 425 (2.1%) | .76 |
| Septic shock | 11 (0.0%) | 4 (0.0%) | 7 (0.0%) | .59 |
| Arrhythmia | 553 (1.6%) | 244 (1.5%) | 309 (1.6%) | .92 |
CCR, cost-to-charge ratio; n/a, not available; SD, standard deviation.
All displayed as n (%) unless specified.
Decreasing CCR hospitals had a lower average CCR (0.12 ± 0.06 vs 0.19 ± 0.08, P < .01). These hospitals also had greater current ratios (total assets/total liabilities; P < .01), operating margins (P < .01), and Medicare margins (P < .01). Decreasing CCR hospitals were more likely to be proprietarily owned (78% vs 33%, P < .01) and more likely to be a teaching hospital (55% vs 26%, P = .02; Table IV). Decreasing CCR hospitals had greater mean total charges ($134,349 ± $114,510 vs $77,185 ± $82,027, P < .01), with marginally greater mean estimated costs ($14,863 ± $12,343 vs $14,458 ± $15,440, P < .01; Table V). When we compared specific surgery types, decreasing CCR hospitals had significantly greater total charges for all procedures except robotic gastric bypass and robotic and open antireflux surgery (Supplementary Table S1).
Table IV.
Hospital financial metrics and characteristics*
| Total (n = 67) | Increasing CCR (n = 27) | Decreasing CCR (n = 40) | P value | |
|---|---|---|---|---|
| Financial metrics, mean ± SD | ||||
| Cost-to-charge ratio | 0.15 ± 0.08 | 0.19 ± 0.08 | 0.12 ± 0.06 | <.01 |
| Operating margin | 0.07 ± 0.20 | −0.01 ± 0.23 | 0.12 ± 0.15 | <.01 |
| Medicare margin | 0.02 ± 0.18 | −0.06 ± 0.17 | 0.07 ± 0.18 | <.01 |
| Current ratio | 1.19 ± 2.06 | 0.57 ± 2.14 | 1.61 ± 1.93 | .04 |
| Hospital location | .53 | |||
| Rural | 2 (3%) | 1 (4%) | 1 (3%) | |
| Small town | 13 (19%) | 7 (26%) | 6 (15%) | |
| Suburban | 37 (55%) | 15 (56%) | 22 (55%) | |
| Urban | 15 (22%) | 4 (15%) | 11 (28%) | |
| DCI quintiles | .19 | |||
| Prosperous | 12 (18%) | 2 (7%) | 10 (25%) | |
| Comfortable | 17 (25%) | 8 (30%) | 9 (23%) | |
| Midtier | 18 (27%) | 6 (22%) | 12 (30%) | |
| At risk | 11 (16%) | 5 (19%) | 6 (15%) | |
| Distressed | 9 (13%) | 6 (22%) | 3 (8%) | |
| Ownership type | .02 | |||
| Nonprofit | 19 (28%) | 13 (48%) | 6 (15%) | .01 |
| Proprietary | 40 (60%) | 9 (33%) | 31 (78%) | <.01 |
| Governmental | 8 (12%) | 5 (19%) | 3 (8%) | 1 |
| Joint Commission accreditation | 66 (99%) | 27 (100%) | 39 (98%) | .41 |
| Teaching hospital | 0 (0%) | 7 (26%) | 22 (55%) | .02 |
| Minor teaching hospital† | 24 (36%) | 4 (15%) | 20 (50%) | <.01 |
| Major teaching hospital† | 5 (7%) | 3 (11%) | 2 (5%) | .35 |
| ACS Cancer Program | 23 (34%) | 6 (22%) | 17 (43%) | .09 |
| Affiliated medical school | 24 (36%) | 9 (33%) | 15 (38%) | .73 |
| Council of Teaching Hospital member | 3 (4%) | 2 (7%) | 1 (3%) | .34 |
| Catholic Church operated | 6 (9%) | 4 (15%) | 2 (5%) | .17 |
| Critical access hospital | 1 (1%) | 1 (4%) | 0 (0%) | .22 |
| Rural referral center | 7 (10%) | 3 (11%) | 4 (10%) | .88 |
| Sole community provider | 1 (1%) | 1 (4%) | 0 (0%) | .22 |
ACS, American College of Surgeons; CCR, cost-to-charge ratio; DCI, Distressed Communities Index; n/a, not available; SD, standard deviation.
All displayed as n (%) unless indicated.
Minor teaching hospital: intern and resident to bed ratio 0–0.25; major teaching hospital: intern and resident to bed ratio >0.25.
Table V.
Patient cost and charge variables*
| Total (n = 35,661) | Increasing CCR (n = 15,809) | Decreasing CCR (n = 19,852) | Relative difference | P value | |
|---|---|---|---|---|---|
| Total estimated costs | 14,684 ± 13,803 | 14,458 ± 15,440 | 14,863 ± 12,343 | 3% | <.01 |
| Total charges | 109,008 ± 105,302 | 77,185 ± 82,027 | 134,349 ± 114,510 | 74% | <.01 |
| Room | 4,985 ± 8,354 | 3,636 ± 6,100 | 6,059 ± 9,651 | 67% | <.01 |
| ICU | 4,328 ± 15,413 | 3,828 ± 14,748 | 4,727 ± 15,912 | 23% | <.01 |
| Coronary care | 853 ± 5,062 | 872 ± 5,476 | 837 ± 4,707 | −4% | .52 |
| Pharmacy | 13,519 ± 27,203 | 10,667 ± 22,596 | 15,789 ± 30,184 | 48% | <.01 |
| Supply | 16,319 ± 17,232 | 11,649 ± 14,039 | 20,038 ± 18,581 | 72% | <.01 |
| Lab | 8,663 ± 16,333 | 5,857 ± 12,086 | 10,898 ± 18,751 | 86% | <.01 |
| Radiology | 4,231 ± 11,226 | 2,828 ± 7,678 | 5,348 ± 13,290 | 89% | <.01 |
| Operating room | 37,191 ± 32,299 | 24,948 ± 22,283 | 46,940 ± 35,556 | 88% | <.01 |
| Anesthesia | 8,966 ± 7,638 | 6,438.6 ± 4,415 | 10,978 ± 8,951 | 71% | <.01 |
| Respiratory therapy | 1,507 ± 7,971 | 1,298 ± 8,426 | 1,672 ± 7,585 | 29% | <.01 |
| Physical therapy | 469 ± 1,311 | 302 ± 1,042 | 603 ± 1,478 | 100% | <.01 |
| Occupational therapy | 146 ± 785 | 72 ± 555 | 206 ± 923 | 186% | <.01 |
| Speech therapy | 30 ± 315 | 15 ± 176 | 41 ± 391 | 173% | <.01 |
| Emergency room | 612 ± 1,775 | 373 ± 1,161 | 801 ± 2,122 | 115% | <.01 |
| Cardiology | 416 ± 2,859 | 276 ± 1,688 | 528 ± 3,519 | 91% | <.01 |
| Trauma | 35 ± 914 | 8 ± 242 | 56 ± 1,204 | 600% | <.01 |
| Recovery room | 5,056 ± 4,543 | 2,880 ± 2,929 | 6,787 ± 4,844 | 136% | <.01 |
| Observation | 187 ± 995 | 162 ± 901 | 207 ± 1,064 | 28% | <.01 |
| Other | 1,493 ± 6,415 | 1,071 ± 7,097 | 1,830 ± 5,794 | 71% | <.01 |
CCR, cost-to-charge ratio; ICU, intensive care unit; SD, standard deviation.
All displayed in US dollars as mean ± SD.
Modeling
The LightGBM model used patient-level factors including demographics, comorbidities, complications, length of stay, type of procedure, and charges to predict whether a patient was cared for at an increasing or decreasing CCR hospital. The model had an accuracy of 0.95, sensitivity of 0.96, specificity of 0.93, precision of 0.94, F1 score of 0.95, and an area under the curve of 0.99, indicating extremely high predictive ability. Variables with the greatest mean absolute SHAP values were predominantly types of charges, with recovery room charges being the greatest (1.45; Figure 1). As individual charges may be more reflective of differences in hospital characteristics rather than differences in patient populations, a second model was generated without charge data. Metrics from this model were inferior, with an accuracy of 0.7, sensitivity of 0.94, specificity 0.39, precision 0.66, F1 score 0.78, and an area under the curve of 0.79. Mean absolute SHAP values revealed type of procedure (0.33), ethnicity (0.32), race (0.25), and origin (0.19) and priority of admission (0.17) as most influential in predictions (Figure 2). Thus, individual charges rather than patient clinical factors were most influential in predictions.
Figure 1.

Top 20 mean absolute SHapley Additive exPlanations (SHAP) values: charges included.
Figure 2.
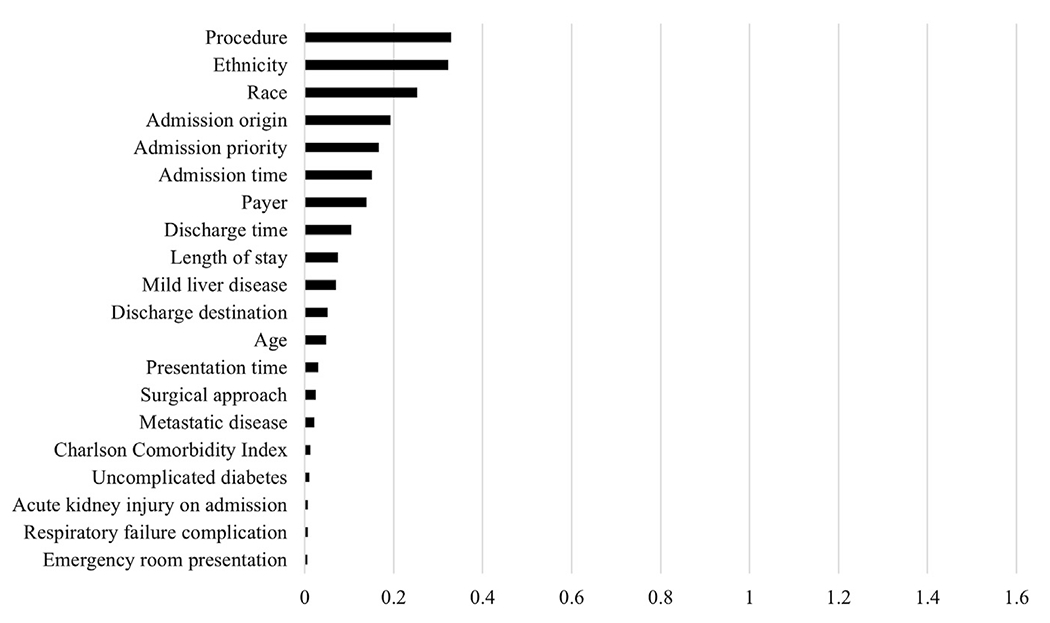
Top 20 mean absolute SHapley Additive exPlanations (SHAP) values: charges excluded.
Discussion
Parity in surgical pricing is crucial for equal access to care. Understanding the relationship between CCR trends, surgical outcomes, and hospital financials can better inform fair pricing initiatives. Discerning the effect of costs and charges on CCR variability is the first step. We compared hospitals with increasing CCR to those with decreasing CCR to understand the factors associated with CCR trends. Within our surgical cohort, greater charges rather than lower costs appear to be the driver of variability in CCR. Despite similar outcomes and minimal differences in estimated costs, the charges billed to payors differed remarkably. Even when accounting for type of surgery and approach, decreasing CCR hospitals charged 56% more on average.
Our results indicate that although differences in case-mix existed, charges were the predominant differentiator when machine learning was used to predict where a patient’s care was provided. More specifically, recovery room charges were the most influential in the model, likely as the result of its high relative difference and use by most patients. Although charges such as trauma, emergency department, and occupational and speech therapy had greater relative differences, only a fraction of patients used these services. In addition, we suspect that recovery room charges are less convoluted by differences in case mix and more representative of hospital pricing practices as opposed to other charges such as operating room and anesthesia. Although charges are not generally the amount reimbursed, the association between decreasing CCR and better hospital financial performance, indicated by operating margin and current ratio, suggests that hospitals with decreasing CCR are receiving greater reimbursements relative to the costs they are incurring. This finding is consistent with Bai and Anderson,2 who found that lower CCR was associated with greater patient care revenue per adjusted discharge. These hospitals, most of which are proprietarily owned, appear to leverage their pricing more effectively and may reap a reward for doing so.
Although we found no difference in mortality or overall complications associated with CCR trends, Gani et al4 found greater perioperative morbidity and in-hospital mortality at hospitals with the greatest markups for cardiothoracic and gastrointestinal procedures. Our study may be underpowered, as the morbidity and mortality rates for our procedures were significantly lower. In addition, Wakeam et al16 investigated 5 common surgical procedures and found that high-cost hospitals had greater rates of complications, mortality, and length of stay. Unfortunately, several studies have also shown hospitals may financially benefit from select surgical complications.22–24 Knechtle et al23 examined hepatectomies, pancreaticoduodenectomies, and colectomies at a single center and found that as complications and cost increased so did charges and reimbursement. Although complications did not significantly change net profits for hepatectomies or pancreaticoduodenectomies, it did increase net profits for colectomies. Krupka et al24 came to a similarly concerning finding: if complications are reduced and surgical volume does not grow, the resulting cash flow is negative. This misalignment of incentives iterates the need for reimbursement that does not reward inferior care but also does not punish hospitals for caring for high-risk patients.
Several policy measures have been suggested to achieve parity in markups, including limits on CCR, price disclosures, and unified rate setting.6 In 2021, a federal mandate requiring hospitals to publish their negotiated prices took effect. One estimate placed potential savings from the measure between $17.6 and $80.7 billion by 2025.25 Unfortunately, recent studies have highlighted noncompliance and irregularities, limiting the utility of price transparency.26–30 In addition, effective in 2022, the No Surprises Act seeks to protect out-of-network patients from surprise medical bills by restricting charges to the amount that would be charged for an in-network provider for emergency services, air-ambulance transport, and out-of-network nonemergency services at in-network facilities.31,32 The act also adds protections for uninsured patients by requiring providers to supply a good faith estimate of expected charges in elective settings.33 As the future implications of these policies are studied, our analysis can be used to understand surgical pricing before implementation, as both measures took effect after our study period.
Although our results showed greater surgical charges at hospitals with decreasing CCR, it does not elucidate the causative factors of greater charges. Further research is needed to determine how much CCR variability is warranted as the result of differing case mix. Several limitations exist in our analysis. Our cohort is limited to specific surgical patients during a 3-year period at a subset of Florida hospitals and may not be representative of all surgical procedures at hospitals across the country. As an administrative database review, our analysis does not account for procedure-specific factors such as disease severity, malignancy stage, or operative time. It also only includes in-hospital mortality and complications. Furthermore, individual cost data are not available and were estimated by applying hospital CCR, which may oversimplify and overestimate surgical costs.34 Finally, our machine learning analysis was limited only to patient-level data, as the number of hospitals was not amenable to applying LightGBM. Despite these limitations, our analysis helps inform the discussion on fair pricing and quality of care while acknowledging opportunities for further research and policy measures.
In conclusion, rather than cutting costs, decreasing CCR hospitals appear to maximize their pricing strategy while maintaining outcomes similar to increasing CCR hospitals. Price transparency and the No Surprises Act are hopeful attempts at parity in health care pricing, but the long-term effects are still to be determined. Future research may determine the causative factors of markup variability using both patient and hospital data as well as identifying and eliminating obstacles to practical price transparency and fair pricing.
Supplementary Material
Funding/Support
Research reported in this publication was supported by the Ruth L. Kirschstein Institutional National Research Service Award of the National Institutes of Health under award number T32GM144274, which funds Dr Zander’s fellowship. The content is solely the responsibility of the authors and does not necessarily represent the official views of the National Institutes of Health.
Footnotes
Presented at the 19th Annual Meeting of the Academic Surgical Congress, Washington, DC, February 6–8, 2024.
Conflicts of Interest/Disclosures
The authors have no related conflicts of interest to declare.
CRediT authorship contribution statement
Tyler Zander: Writing – review & editing, Writing – original draft, Visualization, Methodology, Formal analysis, Data curation. Melissa A. Kendall: Writing – review & editing, Methodology. Haroon M. Janjua: Writing – review & editing, Methodology, Formal analysis, Data curation, Conceptualization. Paul C. Kuo: Writing – review & editing, Methodology, Conceptualization. Emily A. Grimsley: Writing – review & editing, Methodology, Conceptualization.
Supplementary materials
Supplementary material associated with this article can be found, in the online version, at [https://doi.org/10.1016/j.surg.2024.06.018].
References
- 1.Centers for Medicare & Medicaid Services. National Health Expenditure Projections 2022-2031: Forecast Summary 2022. https://www.cms.gov/data-research/statistics-trends-and-reports/national-health-expenditure-data/projected. Accessed December 1, 2023. [Google Scholar]
- 2.Bai G, Anderson GF. US hospitals are still using chargemaster markups to maximize revenues. Health Aff (Millwood). 2016;35:1658–1664. [DOI] [PubMed] [Google Scholar]
- 3.Pickens G, Liang L, Roemer M. HCUP cost-to-charge ratio methodologies. HCUP Methods Series Report # 2021-05 2021. https://hcup-us.ahrq.gov/reports/methods/methods.jsp. Accessed December 13, 2023.
- 4.Gani F, Ejaz A, Makary MA, Pawlik TM. Hospital markup and operation outcomes in the United States. Surgery. 2016;160:169–177. [DOI] [PubMed] [Google Scholar]
- 5.Gani F, Makary MA, Pawlik TM. The price of surgery: markup of operative procedures in the United States. J Surg Res. 2017;208:192–197. [DOI] [PubMed] [Google Scholar]
- 6.Robinson E, Trivedi P, Neifert S, et al. Surgical markup in lung cancer resection, 2015-2020. JTCVS Open. 2023;14:538–545. [DOI] [PMC free article] [PubMed] [Google Scholar]
- 7.Cerullo M, Chen SY, Dillhoff M, Schmidt CR, Canner JK, Pawlik TM. Variation in markup of general surgical procedures by hospital market concentration. Am J Surg. 2018;215:549–556. [DOI] [PubMed] [Google Scholar]
- 8.Burkhart RJ, Acuna AJ, Zhu KY, Kamath AF. The markup on orthopaedic services: an analysis of 2014-2019 Medicare data and the potential for surprise billing. J Bone Joint Surg Am. 2023;105:330–338. [DOI] [PubMed] [Google Scholar]
- 9.Bu DD, Schwam ZG, Neifert SN, et al. The price of otologic procedures: variation in markup by surgical procedure and geography in the United States. Otol Neurotol. 2021;42:1184–1191. [DOI] [PubMed] [Google Scholar]
- 10.Abdelsattar ZM, Birkmeyer JD, Wong SL. Variation in Medicare payments for colorectal cancer surgery. J Oncol Pract. 2015;11:391–395. [DOI] [PMC free article] [PubMed] [Google Scholar]
- 11.Miller JR, Frick KD, Gourin CG. Hospital markup in head and neck cancer surgery in the US. JAMA Otolaryngol Head Neck Surg. 2022;148:1147–1155. [DOI] [PMC free article] [PubMed] [Google Scholar]
- 12.Bai G, Anderson GF. Extreme markup: the fifty US hospitals with the highest charge-to-cost ratios. Health Aff (Millwood). 2015;34:922–928. [DOI] [PubMed] [Google Scholar]
- 13.Anderson GF. From ‘soak the rich’ to ‘soak the poor’: recent trends in hospital pricing. Health Aff (Millwood). 2007;26:780–789. [DOI] [PubMed] [Google Scholar]
- 14.Kliff S, Katz J, Taylor R. Hospitals and Insurers Didn’t Want You to See These Prices. Here’s Why. New York (NY): The New York Times; 2021. [Google Scholar]
- 15.Arvisais-Anhalt S, McDonald S, Park JY, Kapinos K, Lehmann CU, Basit M. Survey of hospital chargemaster transparency. Appl Clin Inform. 2021;12:391–398. [DOI] [PMC free article] [PubMed] [Google Scholar]
- 16.Wakeam E, Molina G, Shah N, et al. Variation in the cost of 5 common operations in the United States. Surgery. 2017;162:592–604. [DOI] [PubMed] [Google Scholar]
- 17.Economic Innovation Group. Distressed Communities Index (DCI): methodology; 2017. https://eig.org/distressed-communities/2022-dci-methodology/. Accessed February 5, 2024.
- 18.Ke GL, Meng Q, Finley T, et al. LightGBM: a highly efficient gradient boosting decision tree. Advances in Neural Information Processing Systems 30 (NIPS 2017). In: San Diego (CA): Neural Information Processing Systems; 2017. [Google Scholar]
- 19.Shapley LS. A Value for n-Person Games. Santa Monica (CA): RAND Corporation; 1952. [Google Scholar]
- 20.Lundberg SM, Lee S-I. A unified approach to interpreting model predictions. In: Proceedings of the 31st International Conference on Neural Information Processing Systems. Long Beach, CA: Curran Associates Inc; 2017:4768–4777. [Google Scholar]
- 21.Lundberg SM, Erion GG, Lee S-I. Consistent individualized feature attribution for Tree ensembles. arXiv 2018. 10.48550/arXiv.1802.03888. [DOI] [Google Scholar]
- 22.Eappen S, Lane BH, Rosenberg B, et al. Relationship between occurrence of surgical complications and hospital finances. JAMA. 2013;309:1599–1606. [DOI] [PubMed] [Google Scholar]
- 23.Knechtle WS, Perez SD, Medbery RL, et al. The association between hospital finances and complications after complex abdominal surgery: deficiencies in the current health care reimbursement system and implications for the future. Ann Surg. 2015;262:273–279. [DOI] [PubMed] [Google Scholar]
- 24.Krupka DC, Sandberg WS, Weeks WB. The impact on hospitals of reducing surgical complications suggests many will need shared savings programs with payers. Health Aff (Millwood). 2012;31:2571–2578. [DOI] [PubMed] [Google Scholar]
- 25.Parente ST. Estimating the impact of new health price transparency policies. Inquiry. 2023;60:469580231155988. [DOI] [PMC free article] [PubMed] [Google Scholar]
- 26.Askinas C, Shih S, Puyana S, Chaffin AE, Jansen DA. Investigation of hospital pricing information for plastic surgery procedures reveals widespread violation of the CMS price transparency act. Plast Reconstr Surg. 2023;152:455–462. [DOI] [PubMed] [Google Scholar]
- 27.Gaffney KA, Bloom JA, Moon T, et al. Poor accessibility to consumer pricing exists for elective hernia repair surgery. Am J Surg. 2023;226:610–615. [DOI] [PubMed] [Google Scholar]
- 28.Hart SA, Wiencek JR, Booth GS. The healthcare price transparency illusion: does anyone know what laboratory tests cost? J Pediatr. 2024;264:113755. [DOI] [PubMed] [Google Scholar]
- 29.Issa TZ, Lee Y, Mazmudar AS, et al. Evaluation of hospital compliance with federal price transparency regulations and variability of negotiated rates for spinal fusion. J Am Acad Orthop Surg. 2023;31:677–686. [DOI] [PubMed] [Google Scholar]
- 30.Burkhart RJ, Hecht CJ 2nd, Acuna AJ, Kamath AF. Less than one-third of hospitals provide compliant price transparency information for total joint arthroplasty procedures. Clin Orthop Relat Res. 2022;480:2316–2326. [DOI] [PMC free article] [PubMed] [Google Scholar]
- 31.Chhabra kR, Fuse Brown E, Ryan AM. No more surprises—new legislation on out-of-network billing. N Engl J Med. 2021;384:1381–1383. [DOI] [PubMed] [Google Scholar]
- 32.Richman B, Hall M, Schulman K. The No Surprises Act and informed financial consent. N Engl J Med. 2021;385:1348–1351. [DOI] [PubMed] [Google Scholar]
- 33.Seitz AJ, Nicksic PJ, Rao VK. The No Surprises Act: what do plastic surgeons need to know? Plast Reconstr Surg Glob Open. 2022;10:e4406. [DOI] [PMC free article] [PubMed] [Google Scholar]
- 34.Childers CP, Dworsky JQ, Russell MM, Maggard-Gibbons M. Comparison of cost center–specific vs hospital-wide cost-to-charge ratios for operating room services at various hospital types. JAMA Surg. 2019;154:557. [DOI] [PMC free article] [PubMed] [Google Scholar]
Associated Data
This section collects any data citations, data availability statements, or supplementary materials included in this article.