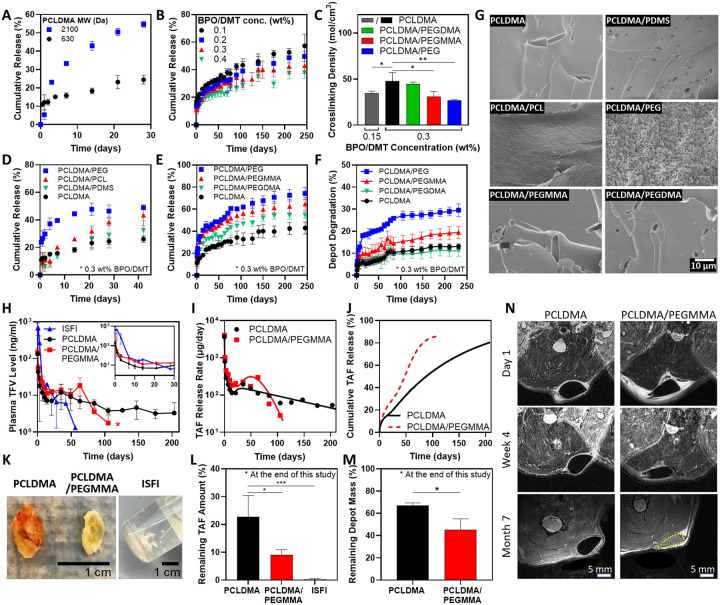
Figure 3. Tailoring the drug release kinetics and degradation of ISCDs in vitro and in vivo.
A. In vitro release profiles of TAF in PBS (37°C) from ISCDs prepared with PCLDMA of different molecular weights (630 Da and 2100 Da). B. In vitro release profiles of TAF in PBS (37°C) from ISCDs prepared with varying BPO/DMT concentrations. C. Crosslinking density of unmodified ISCD prepared with different concentrations of BMP/DMT and ISCD containing different external polymer additives (25 wt%) (*P<0.05 and **P<0.01). D. In vitro release profiles of TAF in PBS (37°C) from unmodified ISCD (prepared using PCLDMA only) or ISCD containing 25 wt% of an external polymer additive (PEG, PCL, or PDMS) alongside PCLDMA. E. In vitro release profiles of TAF and F. and percentage depot degradation in PBS (37°C) for unmodified ISCD or ISCD containing 25 wt% of PEG with varying degrees of methacrylation. G. SEM images of unmodified ISCD or ISCD containing different external polymer additives (25 wt%) showing the cross-section of depot structure at week 1 post-incubation in PBS (37°C). H. Plasma level of TFV in rats injected with 500 μl of TAF-loaded ISFI (control) or TAF-loaded unmodified ISCDs of ISCD containing 25 wt% PEGMMA. All depots were loaded with 90 mg/mL of TAF. The inset shows plasma levels up to day 30. (*P<0.05 for the overall comparison of plasma levels of the two ISCDs over the entire study duration). I. In vivo daily release rate and J. cumulative release of TAF from unmodified ISCD or ISCD containing 25 wt% of PEGMMA, as determined by PK modeling. K. Camera images of TAF-loaded ISFI or TAF-loaded unmodified ISCD or ISCD containing 25 wt% of PEGMMA, retrieved from rats at month 7 post-injection, and L. Remaining TAF amount in the depots (*P<0.05 and ***P<0.001) and M. Remaining mass of the depot (*P<0.05). Due to the disintegration of ISFI within the animal, the remaining mass of the ISFI depots could not be measured. N. MRI images of subcutaneously injected unmodified ISCD or ISCD containing 25 wt% PEGMMA at different time points. Data in A, B, C, E, F, and G are presented as mean ± standard deviation (n=3, experiments performed at least twice). Data in H, L, and M are presented as mean ± standard deviation of technical repeats (n=3, experiment performed twice). Data in I and J present predictions from PK modeling of the average plasma levels of TFV obtained experimentally. P-value in H was determined using two-way ANOVA with Bonferroni correction, with time and different ISCD formulations as the two variables. The P-value in C and L was determined using one-way ANOVA with Tukey’s post hoc analysis. The P-value in M was determined using Student’s t-test.

