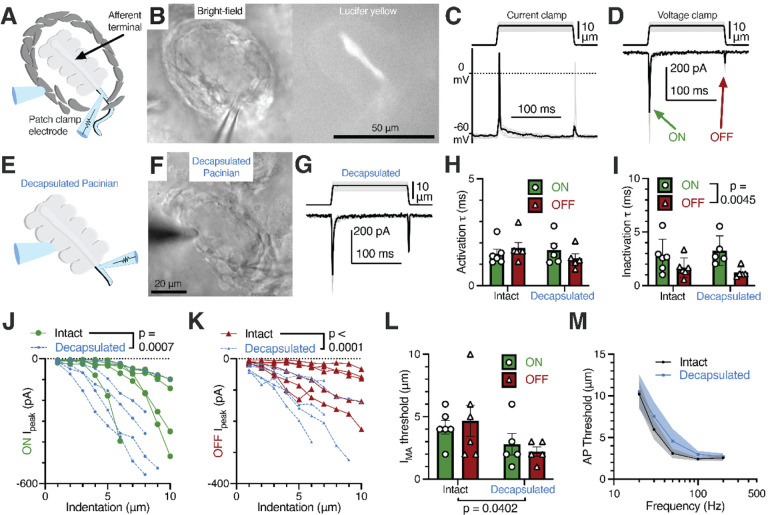
Figure 4. Rapid adaptation and frequency tuning of the Pacinian terminal is independent of the outer core.
(A) Illustration of the patch-clamp recording approach of the Pacinian afferent terminal.
(B) Bright-field image of the experimental setup under the microscope (left) and lucifer yellow fluorescence in the afferent terminal alone (right).
(C) Recordings with the mechanical step stimulus applied with a glass probe (top) and exemplar voltage responses and action potentials (APs) in the terminal in current-clamp mode (bottom).
(D) The mechanical stimulus (top) and representative mechanically activated (MA) current responses in the terminal while voltage-clamped at −60 mV (bottom).
(E) Illustration of patch-clamp recordings of the terminal of a decapsulated Pacinian corpuscle.
(F) Bright-field image of a decapsulated Pacinian.
(G) The mechanical stimulus (top) and exemplar MA current responses in a decapsulated Pacinian terminal (bottom).
(H, I) Quantification of the kinetics of MA current response activation (H) and inactivation (I) during the ON and OFF phases in intact and decapsulated Pacinian corpuscles. Symbols are values from individual corpuscles. Data shown as mean ± SEM. Statistics: two-way ANOVA. No difference was detected between intact and decapsulated activation (p=0.5409) nor inactivation (p=0.9418)
(J, K) The peak current recorded in the ON (J) and OFF (K) phases in relation to the indentation depth of the probe. Each line represents one cell. Statistics: two-way ANOVA.
(L) Comparison of the current response threshold of the ON and OFF phases between terminals of intact and decapsulated corpuscles. Symbols are values from individual corpuscles. Data shown as mean ± SEM. Statistics: two-way ANOVA.
(M) Population tuning curve of intact and decapsulated Pacinians measured via single-fiber recording. Data shown as mean ± SEM from 6 corpuscles. No effect of decapsulation was detected (two-way repeated measures ANOVA, p=0.3842).

