Abstract
In order to describe the signs of acromegaly in cats, a case-control study was done based on computed tomography (CT) scans of the heads of 68 cats with hypersomatotropism and 36 control cats. All cats with a diagnosis of hypersomatotropism had diabetes mellitus, serum insulin-like growth factor-1 >1000 ng/ml and a pituitary mass. Measurements of bones and soft tissues were done by two independent observers without knowledge of the diagnosis. Pituitary masses were identified in CT images of 64 (94%) cats with hypersomatotropism. Analysis of variance found a moderate effect of gender on the size of bones and a large effect of hypersomatotropism on the size of bones and thickness of soft tissues. In cats with hypersomatotropism the frontal and parietal bones were, on average, 0.8 mm thicker (P <0.001); the distance between the zygomatic arches was, on average, 5.4 mm greater (P <0.001); and the mandibular rami were, on average, 1.1 mm thicker (P <0.001) than in control cats. The skin and subcutis dorsal to the frontal bone were, on average, 0.4 mm thicker (P = 0.001); lateral to the zygomatic arch were, on average, 0.7 mm thicker (P <0.001); and ventral to the mandibular rami were, on average, 1.1 mm thicker (P = 0.002) in cats with hypersomatotropism than in control cats. The cross-sectional area of the nasopharynx was, on average, 11.1 mm2 smaller in cats with hypersomatotropism than in control cats (P = 0.02). Prognathia inferior and signs of temporomandibular joint malformation were both observed more frequently in cats with hypersomatotropism than in control cats (P = 0.03). Overall, differences between affected and unaffected cats were small. Recognising feline acromegaly on the basis of facial features is difficult.
Introduction
Hypersomatotropism (excessive secretion of growth hormone by the pituitary gland) leads to insulin resistance and, gradually, progressive physical changes, such as enlargement of the head and extremities, which is a clinical syndrome known as acromegaly. 1 Nearly all humans with acromegaly exhibit thickening of the soft tissues of the face, including the nasolabial folds, lips and nose.1,2 In severely affected humans, there may be protrusion of the frontal bones or lower jaw (prognathia inferior).1,2 Co-morbidities often include diabetes mellitus, hypertension, carpal tunnel syndrome, arthritis, sleep apnoea, goitre and gonadal dysfunction.1–3
Hypersomatotropism is increasingly recognised in cats.4–9 As in humans, this is usually the result of a functional pituitary tumour. Excessive growth hormone causes various metabolic effects, including increased production of insulin-like growth factor-1 (IGF-1) predominantly by the liver. Clinical diagnosis of hypersomatotropism in cats is based on a combination of a compatible findings, including diabetes mellitus, increased serum total IGF-1 and enlargement of the pituitary gland. IGF-1 radioimmunoassay is used rather than determining serum feline growth hormone levels because IGF-1 has excellent species homology, it is not secreted in a pulsatile fashion and because there is no commercially available assay for feline growth hormone.5,6 Growth hormone and IGF-1 both have anabolic effects that cause gradual enlargement of a variety of tissues resulting in acromegaly. Reported clinical features of acromegaly in cats include broad face, prognathia inferior, enlarged paws, abdominal organomegaly, cardiomyopathy, respiratory stridor and increased body weight.4–9 However, these features appear gradually and the only abnormality recognised initially may be the presence of diabetes mellitus. Growth hormone decreases sensitivity to insulin; hence, many cats with hypersomatotropism have insulin-resistant diabetes mellitus and present with polyuria and polydipsia, rather than with signs of acromegaly.8,9
Computed tomography (CT) and magnetic resonance imaging (MRI) have been used to document the presence of pituitary tumours in cats with insulin-resistant diabetes mellitus and/or hypersomatotropism.5,10–12 In addition to pituitary morphology, a recent report described CT findings compatible with acromegaly affecting the head in six cats with hypersomatotropism. 12 These signs included thickening of the frontal and parietal bones, thickening of the lining of the nasal cavity and paranasal sinuses, thickening of soft tissue around the pharynx and subcutaneous thickening. 12 The aim of the present study was to describe in more detail the signs of acromegaly based on CT scans of a larger series of cats with hypersomatotropism.
Materials and methods
Medical records at the Royal Veterinary College for the period 2005–2012 were searched for cats that had diabetes mellitus, serum IGF-1 >1000 ng/ml, and a pituitary mass identified by CT, MRI or at necropsy. These cats were considered to have hypersomatotropism as a result of a functional pituitary tumour or hyperplasia.
A control group of skeletally mature cats without hypersomatotropism was collected by a backward chronological search of medical records from December 2012 for cats that had a CT scan of the head for reasons other than suspected intracranial disease. Cats with diabetes mellitus, cats with suspected lesions affecting the sites of measurement (see below) and cats of breeds not included in the hypersomatotropism group were excluded. For each cat, age, gender, breed and diagnosis were recorded.
CT scans were done with cats in sternal recumbency under anaesthesia or sedation. Scans prior to August 2009 were done using a single-slice helical scanner (PQ5000; Philips); scans from August 2009 were done using a 16-slice scanner (Mx8000 IDT; Philips). Transverse CT images of the head with 1.0–3.0 mm slices reconstructed using a standard (ie, neither smooth nor sharp) algorithm were available for all cats. Post-contrast images of the brain were available for all cats with hypersomatotropism. The pituitary gland in cats with hypersomatotropism was measured by one observer (CRL) in post-contrast, transverse CT images using different windows for the dorsal and ventral aspects of the pituitary. 13 The dorsal and lateral aspects of the pituitary were considered to be the interface between contrast-enhanced tissue occupying the pituitary fossa and the midbrain in images with a soft tissue window (width 200, level 80). The ventral aspect of the pituitary was considered to be in contact with the dorsal aspect of the basisphenoid bone forming the pituitary fossa, which was identified in images with a bone window (width 2500, level 500). Diagnosis of pituitary mass in CT images was based on observing a dorsoventral dimension of the pituitary >4.0 mm and/or transverse dimension >6.0 mm. 14
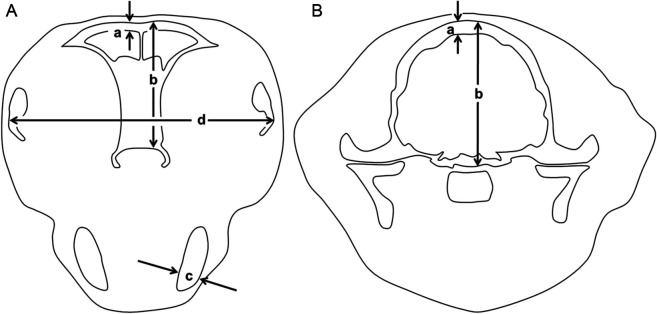
All other measurements were made on pre-contrast CT images viewed using a bone window (width 2500, level 500) by independent observers without knowledge of the diagnosis. Measurements of bones were made by an observer (TCC) using similar methods to those described by Fischetti et al 12 (Figure 1). Frontal bone thickness on both the left and right was measured in a transverse image immediately caudal to the internal nares. Parietal bone thickness on both the left and right was measured in a transverse image through the pituitary fossa. Maximal width of the mandibular rami and the distance between the lateral aspects of the zygomatic bones were measured in the same image used for frontal bone measurements. In a sagittal image on the midline, the horizontal distance between the most rostral aspects of the incisive bone and mandible was measured, with prognathia inferior recorded as a positive number and prognathia superior as a negative number. In addition, the temporomandibular joints (TMJs) were examined subjectively for signs of malformation or arthropathy.
Figure 1.
Diagrams to illustrate method of measurements of bones. (A) In transverse image immediately caudal to the internal nares: thickness of the frontal bone approximately 4 mm lateral to midline (a); depth of skull at same position (b); thickness of ventral part of mandible perpendicular to its long axis (c); distance between lateral aspects of the zygomatic bones (d). (B) In transverse image at the level of the pituitary fossa: thickness of the parietal bone approximately 4 mm lateral to midline (a); depth of skull at same position (b)
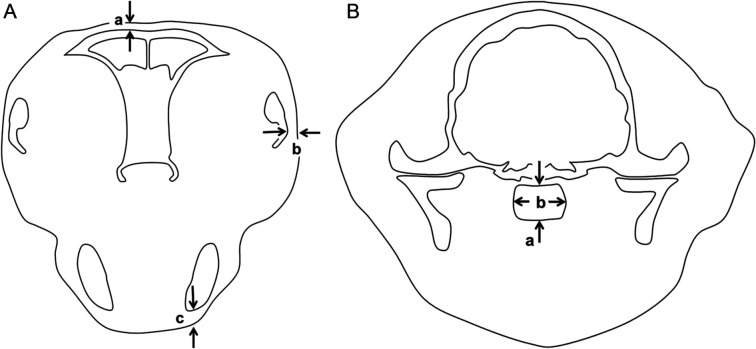
Measurements of soft tissues were made by another observer (PM). Measurements of the thickness of tissues between the skin surface and the bone were made on both left and right dorsal to the frontal bone, lateral to the zygomatic arches and ventral to the mandibular rami in the same image used for frontal bone measurements (Figure 2). The maximal left–right dimension of the head was measured in the same image. The maximal dorsoventral and left–right dimensions of the nasopharynx were measured in the same image used for parietal bone measurements. Measurements of the nasopharynx in control cats with suspected nasal or nasopharyngeal conditions were omitted.
Figure 2.
Diagrams to illustrate method of measurements of soft tissues. (A) In transverse image immediately caudal to the internal nares: thickness of soft tissue dorsal to the frontal bone approximately 4 mm lateral to midline (a); thickness of soft tissue lateral to the zygomatic bones (b); thickness of soft tissue on ventral aspect of mandible (c). (B) In transverse image at the level of the pituitary fossa: depth of nasopharynx on midline (a); maximal width of nasopharynx (b)
For each cat, the results of left and right measurements were averaged for analysis. The results of measurements of bones and soft tissues were tested separately using a mixed between-within subjects analysis of variance (ANOVA) with gender and presence/absence of hypersomatotropism as fixed effects and cat as a random effect. The difference in median age between cats with hypersomatotropism and control cats was tested using the Mann–Whitney test. Differences in gender ratio and breed distribution between cats with hypersomatotropism and control cats were tested using Fisher’s exact test. Differences of P <0.05 were considered significant.
Results
Records were found of 68 cats that satisfied the inclusion criteria for hypersomatotropism and 36 cats that were suitable as controls. There were no significant differences in median age, gender ratio or breed distribution between cats with hypersomatotropism and control cats (Table 1). All cats were neutered.
Table 1.
Summary of cats
| n | Control group | Cats with hypersomatotropism | P |
|---|---|---|---|
| 36 | 68 | ||
| Median (range) age, years | 7 (2–17) | 9 (3–15) | 0.35 |
| Male:female ratio | 22:14 | 48:20 | 0.38 |
| Breeds* | |||
| Domestic shorthair | 30 | 49 | 0.24 |
| Domestic longhair | 0 | 3 | |
| British Shorthair | 0 | 1 | |
| Burmese | 3 | 2 | |
| Siamese | 3 | 1 | |
| Maine Coon | 0 | 3 | |
Breed not recorded in nine cats
CT images of control cats were considered normal in eight cases and compatible with otitis media in six cats, rhinitis in six cats, retrobulbar mass in three cats, nasopharyngeal mass in three cats, nasal mass in two cats, oral neoplasia in two cats, aural neoplasia in two cats, and one cat each with dental disease, cutaneous fistula, mandible fracture and mandibular neoplasia.
Pituitary masses were identified in CT images of 64 (94%) cats with hypersomatotropism. Pituitary masses had a median (range) dorsoventral dimension of 6.1 mm (4.2–16.0 mm). Masses extended dorsal to the rim of the sella turcica by a median (range) 2.5 mm (0.5–13.4 mm), thus satisfying a criterion for pituitary macroadenoma. Of the four cats without a pituitary mass on CT, two had a mass found by MRI (4.6 mm and 5.3 mm diameter, respectively) and two had pituitary enlargement at necropsy, consistent with acidophilic hyperplasia.
Measurement data were normally distributed and satisfied criteria for equality of error variances (Levene’s test, P >0.18). There was no significant interaction between presence/absence of hypersomatotropism and gender (Wilks’ Lambda >0.94, P >0.37). ANOVA found a moderate effect of gender on measurements of bones (P = 0.001, partial η2 = 0.15) and a large effect of hypersomatotropism on measurements of bones (P <0.001, partial η2 = 0.41) and soft tissues (P <0.001, partial η2 = 0.22).
Significant differences were found between the results of measurements in male and female cats, but the differences were relatively small. In male cats, the parietal bone was, on average, 0.5 mm thicker (P <0.001), the depth of the skull was, on average, 1.3 mm greater (P <0.006) and the width of the head was, on average, 4.1 mm greater (P = 0.005) than in females.
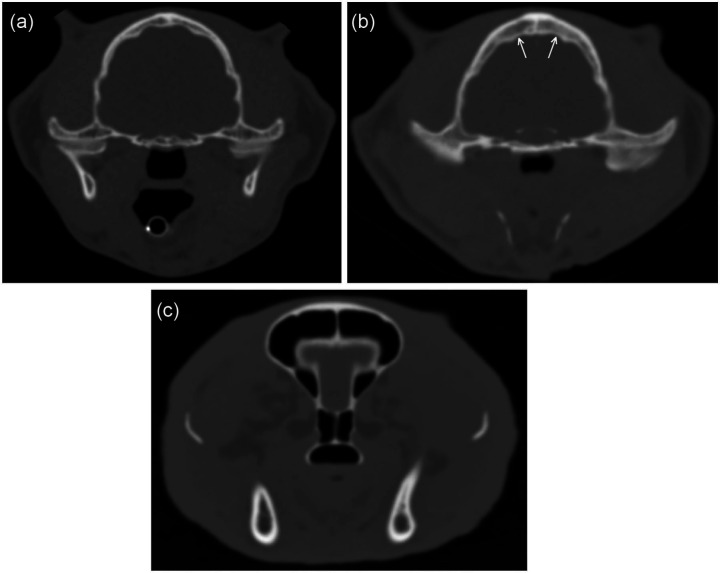
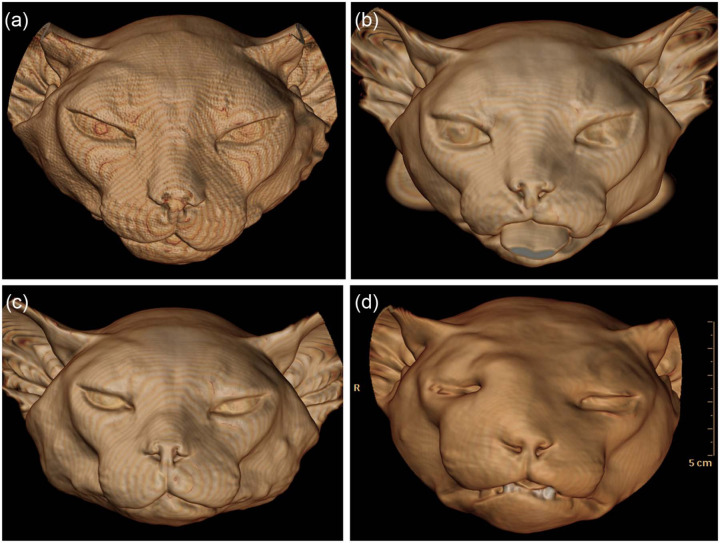
In cats with hypersomatotropism the frontal and parietal bones were, on average, 0.8 mm thicker (P <0.001); the mandibular rami were, on average, 1.1 mm thicker (P <0.001); and the distance between the zygomatic arches was, on average, 5.4 mm greater (P <0.001) than in control cats (Figures 3 and 4). In cats with hypersomatotropism the soft tissues (skin and subcutis) dorsal to the frontal bone were, on average, 0.4 mm thicker (P = 0.001); lateral to the zygomatic arches were, on average, 0.7 mm thicker (P <0.001); and ventral to the mandibular rami were, on average, 1.1 mm thicker (P = 0.002) than in control cats. The product of the maximal dorsoventral and left–right dimensions of the nasopharynx, which is an estimate of the cross-sectional area of the nasopharynx, was, on average, 11.1 mm2 smaller in cats with hypersomatotropism than in control cats (P = 0.02). The results of measurements are summarised in Tables 2 and 3.
Figure 3.
Examples of findings compatible with acromegaly. (a) Transverse computed tomography (CT) image of a control cat showing normal parietal bone (average thickness 3.2 mm) and nasopharynx (depth 7.8 mm, width 10.5 mm). (b) Transverse CT image of a cat with hypersomatotropism showing thickened parietal bone (arrows) (average thickness 6.4 mm). The cross-sectional area of the nasopharynx is reduced (depth 3.6 mm, width 8.5 mm). Also, the head is relatively wider than the cat in (a). (c) Transverse CT image of another cat with hypersomatotropism showing slightly thickened soft tissues over the frontal bones (average thickness 2.5 mm), and marked thickening lateral to the zygomatic bones (average thickness 7.0 mm). The head is relatively wide (89 mm). All cats were domestic shorthairs
Figure 4.
Examples of three-dimensional surface-rendered computed tomography images. (a) Control cat. (b–d) Cats with hypersomatotropism. Signs of acromegaly are widening of the head, uneven thickening of soft tissues and, in (d), prognathism inferior. Distinguishing affected and unaffected cats on the basis of their facial features is difficult. All cats were domestic shorthairs
Table 2.
Results of measurements of selected bones of the head
| Control group | Normal range | Cats with hypersomatotropism | Proportion of cats with hypersomatotropism above normal range (%) | P | |
|---|---|---|---|---|---|
| Frontal bone thickness | 1.4 (0.6) mm | 0.2–2.6 mm | 2.2 (1.1) mm | 16 | <0.001 |
| Depth of skull at level of frontal bone measurement | 24.2 (1.6) mm | 21.0–27.4 mm | 25.3 (1.5) mm | 11 | 0.005 |
| Frontal bone thickness as a proportion of skull depth | 5.8 (2.7) % | 5.2–6.3% | 8.4 (4.3) % | 66 | 0.002 |
| Parietal bone thickness | 2.9 (0.6) mm | 2.3–3.5 mm | 3.9 (0.9) mm | 57 | <0.001 |
| Depth of skull at level of parietal bone measurement | 34.2 (1.9) mm | 30.5–37.9 mm | 35.6 (1.6) mm | 10 | <0.001 |
| Parietal bone thickness as a proportion of skull depth | 8.4 (1.4) % | 5.6–11.0% | 10.5 (2.0) % | 36 | <0.001 |
| Thickness of mandibular rami | 5.7 (0.9) mm | 4.0–7.4 mm | 6.8 (0.9) mm | 27 | <0.001 |
| Distance between the lateral aspects of zygomatic bones | 65.5 (4.1) mm | 57.3–73.6 mm | 70.9 (4.4) mm | 24 | <0.001 |
Values are mean (SD); normal range = mean ± 1.96 SD
Table 3.
Results of measurements of selected soft tissues of the head
| Control group | Normal range | Cats with hypersomatotropism | Proportion of cats with hypersomatotropism outside normal range (%) | P | |
|---|---|---|---|---|---|
| Skin and subcutis dorsal to frontal bone | 1.3 (0.5) mm | 0.4–2.3 mm | 1.7 (0.5) mm | 5 a | 0.001 |
| Skin and subcutis lateral to zygomatic arch | 2.4 (0.7) mm | 1.0–3.8 mm | 3.1 (0.8) mm | 8 a | <0.001 |
| Skin and subcutis ventral to mandibular rami | 2.6 (1.0) mm | 0.6–4.6 mm | 3.7 (1.7) mm | 19 a | 0.002 |
| Depth of nasopharynx | 5.4 (1.4) mm | 2.7–8.1 mm | 4.6 (1.9) mm | 12 b | 0.66 |
| Width of nasopharynx | 10.6 (1.4) mm | 7.7–13.4 mm | 9.9 (1.4) mm | 8 b | 0.70 |
| Cross-sectional area of nasopharynx (depth × width) | 57.6 (18.6) mm2 | 21.1–94.1 mm2 | 46.4 (20.3) mm2 | 9 b | 0.02 |
Values are mean (SD); normal range = mean ± 1.96 SD
Above normal range
Below normal range
Depending on the site of measurement, the proportion of cats with hypersomatotropism that had values outside the normal range was up to 66% for bone measurements and up to 19% for soft tissue measurements. Hence, in cats with hypersomatotropism increased thickness of bone was identified more frequently than increased thickness of soft tissues. Of the four cats in which no pituitary enlargement was identified by CT, three had parietal bone thickening and one had no head measurements outside the normal range.
As a result of the increase in the distance between the zygomatic arches (average difference + 5.4 mm) and the less marked increase in the thickness of overlying skin and subcutis at this site (average difference + 0.7 × 2 sides = 1.4 mm), the head in cats with hypersomatotropism was, on average, 6.8 mm wider than in control cats. The potential use of head width as a diagnostic test for acromegaly was examined with data split by gender. Optimal cut-off values for head width as a test for acromegaly were 70 mm for female cats (sensitivity 100%, specificity 86%) and 76 mm for male cats (sensitivity 63%, specificity 86%).
Assessment of prognathia inferior was compromised because a large proportion of CT images in cats with hypersomatotropism did not include the most rostral part of the head. Prognathia inferior was identified in 4/17 (24%) cats with hypersomatotropism compared with 1/36 (3%) control cats (P = 0.03).
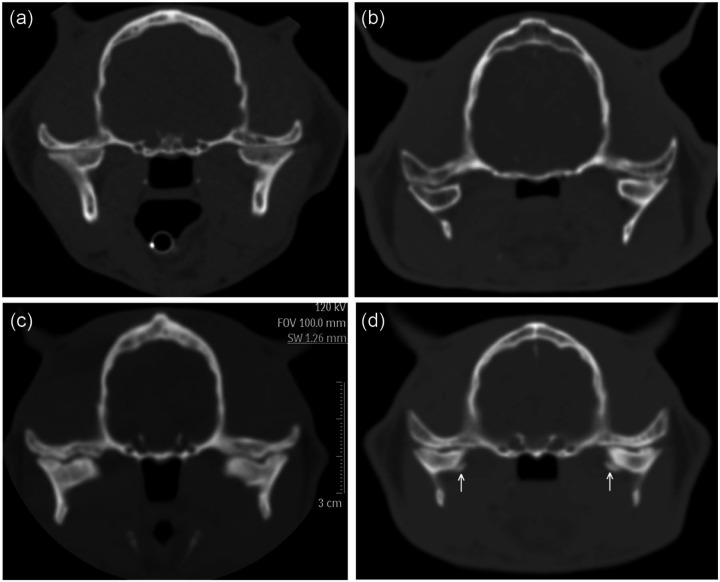
Signs compatible with TMJ malformation were observed in 15/64 (23%) cats with hypersomatotropism compared with 2/35 (6%) control cats (P = 0.03). Abnormal appearances of the TMJs were concave mandibular condyle, uneven joint space and periarticular osteophytes (Figure 5). Review of the medical records of the 15 cats affected by TMJ malformation found no mention of pain on opening the mouth or other signs referable to the TMJ.
Figure 5.
Examples of temporomandibular joint (TMJ) malformation in cats with hypersomatotropism. (a) Transverse computed tomography (CT) image of a control cat with hypersomatotropism showing smooth straight surface of the mandibular condyles and narrow TMJ spaces. (b) Transverse CT image of a cat with hypersomatotropism showing concave surface of the mandibular condyles. The nasopharynx is markedly narrowed in this cat. (c) Transverse CT image of a cat with hypersomatotropism with symmetrical focal indentations in the mandibular condyles. The TMJ space is uneven in width. The parietal bone is thickened. (d) Transverse CT image of another cat with hypersomatotropism showing abnormal curvature of the mandibular condyles, widened TMJ space and bilateral angular osteophytes (arrows) affecting the medial aspects of the mandibular condyles
Discussion
The majority (94%) of cats with hypersomatotropism had CT signs compatible with pituitary macroadenoma. The absence of a demonstrable pituitary mass by CT in four cats with hypersomatotropism emphasises that, although CT is a useful clinical method for examining the pituitary gland in cats, a small proportion of affected individuals has pituitary tumours that are too small to be identified by CT.
Cats with hypersomatotropism had significantly thicker skull bones, and thicker skin and subcutis than unaffected cats. Apparently as a result of thickening of surrounding soft tissues, the nasopharynx was narrower in cats with hypersomatotropism than control cats. These findings, which represent signs of feline acromegaly, are in agreement with previous reports.7,12 Inclusion of a larger number of subjects in the present study enabled more powerful statistical testing of differences between affected and control cats.
Difficulties recognising signs of acromegaly in humans are exacerbated by their insidious onset because gradually progressive changes may go unnoticed by the patient or their family. 2 In humans, the significance of facial changes may also be missed if they are attributed to aging. 2 In cats, additional difficulties recognising signs of acromegaly may occur because of the presence of facial hair and the tendency for owners to examine their pet’s face less frequently or thoroughly than their own. One advantage of three-dimensional surface-rendered CT images over direct visual inspection of a feline head is the ability to display the skin surface without hair, which enables a truer view of the surface contours (Figure 4). Even so, distinguishing affected and unaffected cats on the basis of their facial features is difficult.
Up to 66% of cats with hypersomatotropism had bone measurements that exceeded the normal range calculated on the basis of 36 control cats. A small proportion of cats (up to 19%) had soft tissue measurements outside the normal ranges and, in some instances, the differences were not significant. The divergence in results of measurements of bones and of soft tissues in the present study may reflect greater individual variations in soft tissues occurring because of positioning for CT. For example, resting the head on a pad or in a trough will tend to flatten soft tissues on the ventral aspect of the head. Also, the position of the endotracheal tube and the variable presence of an oesophageal stethoscope in cats scanned under anaesthesia will affect the dimensions of the nasopharynx by displacing the soft palate.
Variations in skull conformation with breed complicate assessment of signs of acromegaly in cats.15,16 For this reason, we excluded feline breeds from the control group that were not present in the hypersomatotropism group. Certain breeds associated with variable frontal sinus anatomy (eg, Persians) 15 could have introduced unwanted variability into the control group if they had not been excluded. Variations in size associated with certain feline breeds were not avoided in the present study. There were three Maine Coon cats with hypersomatotropism, and one of these had the widest head of any cat (91 mm). The large majority of cats in this study were domestic shorthairs; however, this is not a perfectly homogeneous breed with regard to skull conformation, and variations in frontal sinus conformation and head size were observed in the control group. The frontal sinus may be relatively larger in male cats than females, 16 hence, we distinguished males and females in the analysis.
Of the various differences identified in the present study, increased width of the head may be the most readily identified by physical examination. In female cats, at the optimal cut-off value for head width measured in a transverse CT image immediately caudal to the internal nares (70 mm), sensitivity was 100%, and specificity was 86%. At the optimal cut-off value for head width in male cats (76 mm), sensitivity was only 63%, reflecting a greater degree of overlap in head width between male control cats and male cats with hypersomatotropism. Hence, use of head width as a physical test for acromegaly appears to be potentially more accurate in female cats than in males. Effect of reproductive status could not be assessed in the present study because all cats were neutered. It seems likely that average head width in entire male cats will be greater than in neutered male cats, and hence the overlap between normal entire male cats and male cats with hypersomatotropism may be greater, further reducing sensitivity of this test.
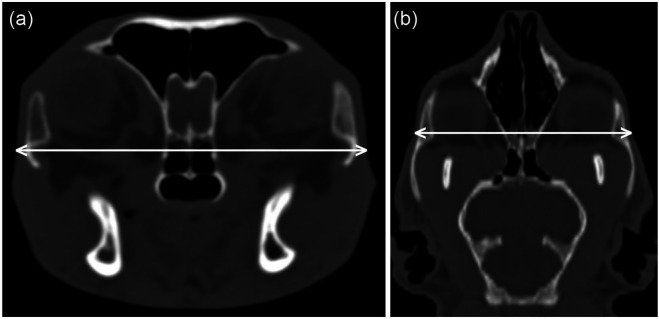
The site of measurement chosen for head width measurement in the present study was that used by previous investigators 12 to measure the frontal bone thickness. This site does not correspond to the maximal head width, which is 1–2 cm further caudal. Clinicians wishing to make head width measurements during physical examination that are comparable to our CT measurements should place their calliper across the head just rostral to the orbital processes of the frontal bones, at a point where the zygomatic bones are relatively flat on their lateral aspects (Figure 6).
Figure 6.
The site used for head width measurement was immediately caudal to the internal nares in a transverse computed tomography image (a). This corresponds to a point in a dorsal image (b) where the zygomatic bones are relatively flat on their lateral aspects, which is rostral to the widest part of the head
Measurements of the bones and soft tissues of the head required observers to select transverse CT images at the level of the pituitary fossa. It was not possible to optimally blind observers to the status of the cats because many cats with hypersomatotropism had large pituitary masses that were visible in pre-contrast CT images, although use of a bone window for all bone and soft tissue measurements meant that pituitary masses in many affected cats were relatively inconspicuous, which allowed the possibility that observers would not notice the pituitary mass. Observers made bone and soft tissue measurements independently in an effort to reduce bias.
A large proportion of CT images in cats with hypersomatotropism did not include the most rostral part of the head because they were done to examine the brain for signs of pituitary mass. This prevented optimal estimation of the prevalence of prognathia inferior in cats with hypersomatotropism. We included this measurement in an attempt to address a limitation in assessing the mandible identified by other investigators. 12 In retrospect, clinical assessment of prognathia may be sufficiently accurate that there is no advantage for CT. Although the observed prevalence of prognathia inferior (24%) was significantly greater than in control cats, it is less than in earlier studies,4,5 in which prognathia inferior affected 10/14 (71%) and 8/17 (47%) cats, respectively. The lower prevalence in the present study might reflect a reduced severity of clinical signs of acromegaly associated with earlier diagnosis of hypersomatotropism than 20 years ago; this could occur because of the recently increased awareness of this condition in cats or, perhaps, an increase in prevalence.5,6 Also, our institution actively promotes the screening of diabetic cats for hypersomatotropism, thus potentially enabling an earlier diagnosis of this condition. Compared with thickening of the skull bones or soft tissues, prognathia inferior is potentially more readily detectable by physical examination; however, a low prevalence would limit its usefulness as a sign of acromegaly.
Prevalence of TMJ malformation was greater in cats with hypersomatotropism than unaffected cats. The significance of this finding is uncertain because affected cats had no documented clinical signs of TMJ disease. One acromegalic cat in a previous study 12 had a marked irregularity in shape of the articular surfaces of the TMJ, but also had no associated clinical signs.
Conclusions
Attempts to estimate prevalence of the various signs of acromegaly in cats with hypersomatotropism will be confounded by various factors, including duration of the condition prior to diagnosis, variations in the level of endocrine dysfunction by pituitary neoplasms, the gradually progressive nature of the condition and individual variations in head conformation that overlap with the spectrum of acromegalic changes. Knowledge of the approximate prevalence of acromegaly in cats with hypersomatotropism is less important than the knowledge that clinical signs, such as a wide head, prognathia inferior or stertor, could, in combination with other signs, be sentinels of a treatable endocrinopathy. The current study emphasises that when hypersomatotropism is suspected in diabetic cats, CT has a role beyond mere assessment of pituitary morphology.
Acknowledgments
We thank Yu-Mei Chang for advice about the statistical analysis.
Footnotes
Funding: This research received no grant from any funding agency in the public, commercial or not-for-profit sectors
The authors do not have any potential conflicts of interest to declare.
Accepted: 19 June 2013
References
- 1. Melmed S. Acromegaly. New Engl J Med 2006; 355: 2558–2573. [DOI] [PubMed] [Google Scholar]
- 2. Reid TJ, Post KD, Bruce JN, et al. Features at diagnosis of 324 patients with acromegaly did not change from 1981 to 2006: acromegaly remains under-recognized and under-diagnosed. Clin Endocrinol (Oxf) 2010; 72: 203–208. [DOI] [PMC free article] [PubMed] [Google Scholar]
- 3. Mestron A, Webb SM, Astorga R, et al. Epidemiology, clinical characteristics, outcome, morbidity and mortality in acromegaly based on the Spanish Acromegaly Registry (Registro Espanol de Acromegalia, REA). Eur J Endocrinol 2004; 151: 439–446. [DOI] [PubMed] [Google Scholar]
- 4. Peterson ME, Taylor RS, Greco DS, et al. Acromegaly in 14 cats. J Vet Intern Med 1990; 4: 192–201. [DOI] [PubMed] [Google Scholar]
- 5. Niessen SJM, Petrie G, Gaudiano F, et al. Feline acromegaly: an underdiagnosed endocrinopathy? J Vet Intern Med 2007; 21: 899–905. [DOI] [PubMed] [Google Scholar]
- 6. Peterson ME. Acromegaly in cats: Are we only diagnosing the tip of the iceberg? J Vet Intern Med 2007; 21: 889–891. [PubMed] [Google Scholar]
- 7. Niessen SJ. Feline acromegaly: an essential differential diagnosis for the difficult diabetic. J Feline Med Surg 2010; 12: 15–23. [DOI] [PMC free article] [PubMed] [Google Scholar]
- 8. Berg RI, Nelson RW, Feldman EC, et al. Serum insulin-like growth factor-I concentration in cats with diabetes mellitus and acromegaly. J Vet Intern Med 2007; 21: 892–898. [DOI] [PubMed] [Google Scholar]
- 9. Elliott DA, Feldman EC, Koblik PD, et al. Prevalence of pituitary tumors among diabetic cats with insulin resistance. J Am Vet Med Assoc 2000; 216: 1765–1768. [DOI] [PubMed] [Google Scholar]
- 10. Meffert FJ, Brown JS. Acromegaly diagnosed by increased IGF-1 levels and MRI findings in two cats. Austr Vet Pract 2009; 39: 152–155. [Google Scholar]
- 11. Posch B, Dobson J, Herrtage M. Magnetic resonance imaging findings in 15 acromegalic cats. Vet Radiol Ultrasound 2011; 52: 422–427. [DOI] [PubMed] [Google Scholar]
- 12. Fischetti AJ, Gisselman K, Peterson ME. CT and MRI evaluation of skull bones and soft tissues in six cats with presumed acromegaly versus 12 unaffected cats. Vet Radiol Ultrasound 2012; 53: 535–539. [DOI] [PubMed] [Google Scholar]
- 13. Auriemma E, Voorhout G, Barthez PY. Determination of optimal window width and level for measurement of the canine pituitary gland height on computed tomographic images using a phantom. Vet Radiol Ultrasound 2007; 48: 113–117. [DOI] [PubMed] [Google Scholar]
- 14. Tyson R, Graham JP, Bermingham E, et al. Dynamic computed tomography of the normal feline hypophysis cerebri (glandula pituitaria). Vet Radiol Ultrasound 2005; 46: 33–38. [DOI] [PubMed] [Google Scholar]
- 15. Kunzel W, Breit S, Oppel M. Morphological characteristics of the paranasal sinuses in brachycephalic cats and their functional relevance. Wien Tierärztl Monatsschr 2002; 89: 334–340. [Google Scholar]
- 16. Koch R, Schroder H, Waibl H. Topography and imaging methods (x-rays and computertomography) on the paranasal sinuses of the cat. Kleintierpraxis 2002; 47: 213–219. [Google Scholar]


