Figure 2.
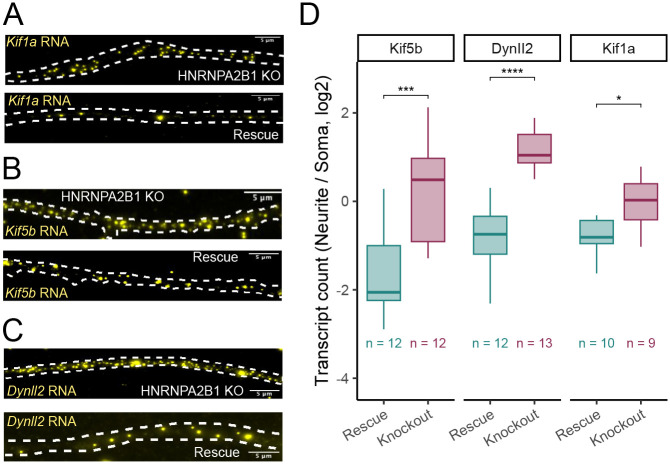
Validation of HNRNPA2B1-dependent RNA localization using smFISH. (A-C) smFISH visualization of Kif1a (A), Kif5b (B), and Dynll2 (C) RNA in neurites of HNRNPA2B1 knockout and rescue cells. Smaller puncta are RNA molecules. Large, bright blotches are aggregates of fluor. These are ignored on the basis of their size and intensity during computational spot calling procedures. (D) Quantitation of smFISH results. RNA molecules are counted in both soma and neurites and compared across conditions. P-values were calculated using a t-test. NS (not significant) represents p > 0.05, * p < 0.05, ** p < 0.01, *** p < 0.001, and **** represents p < 0.0001.

