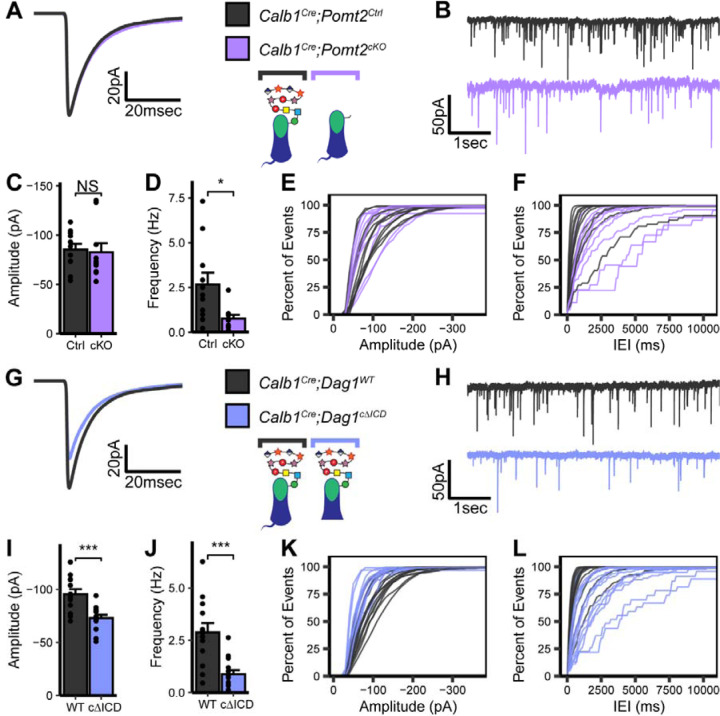
Figure 5. Impaired inhibitory synapse function in Calb1Cre;Pomt2cKO and Calb1Cre;Dag1cΔICD Purkinje cells.
(A-F) mIPSC analysis in Calb1Cre;Pomt2cKO and littermate control Purkinje cells at P25. (A) Average mIPSC event. (B) Representative 15 second trace of mIPSCs. (C-D) mIPSC amplitude (C) and frequency (D); error bars are presented as mean + SEM. (E-F) Cumulative frequency histogram for individual mIPSC amplitudes (E) and inter-event intervals (IEI) (F). (G-L) mIPSC analysis in Calb1Cre;Dag1cΔICD and littermate control Purkinje cells at P25. (G) Average mIPSC event. (H) Representative 15 second trace of mIPSCs. (I-J) mIPSC amplitude (I) and frequency (J); error bars are presented as mean + SEM. (K-L) Cumulative frequency histogram for individual mIPSC amplitudes (K) and inter-event intervals (IEI) (L). Calb1Cre;Pomt2Ctrl N = 11 cells, 3 animals. Calb1Cre;Pomt2cKO N = 10 cells , 4 animals. Calb1Cre;Dag1WT N = 13 cells, 4 animals. Calb1Cre;Dag1cΔICD N = 14 cells , 4 animals.

