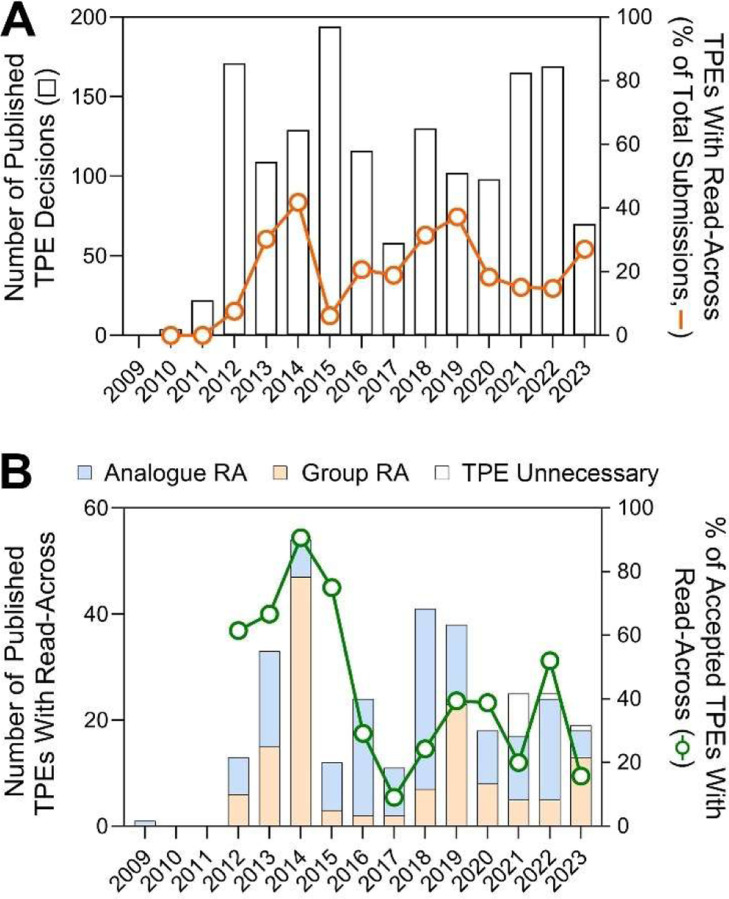
Figure 3.
Time-trend plots for when TPE decisions were published. (A) The number of all published TPE decisions per calendar year (bars, left y-axis) and a fraction of TPEs that contained read-across (RA) adaptations (line, right y-axis). (B) The number of published TPE decisions per calendar year indicating the type of read-across (stacked bar plots, left y-axis) and a fraction of these that was accepted (line, right y-axis).

