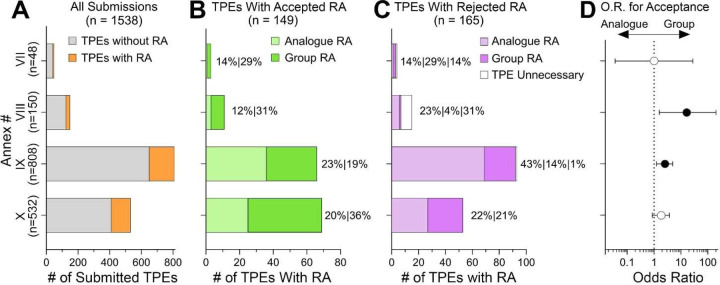
Figure 5.
Analysis of the publicly available TPE decisions by REACH Annex number (substance tonnage). (A) Stacked bar plots show the number of substances in each Annex category for which publicly available TPEs were examined. Gray color represents TPEs without read-across adaptations and orange represents those with read-across adaptations. (B-C) The number of substances with accepted (B) and rejected (C) read-across adaptations. Within each stacked bar plot, submissions that used analogue (lighter shade) or group (darker shade) read-across are shown. In some instances of rejected read-across, the type of read-across could not be determined (white). (D) For each Annex number, odd ratios (OR) and 95% confidence intervals for Acceptance in Group vs. Analogue (i.e. an OR>1.0 corresponds to greater odds of Acceptance for Group). The intervals for Annex #IX and VIII do not contain the null OR=1.0, corresponding to a significantly greater odds of Acceptance for Group (p<0.05).

