

Abstract
Aim: The authors set out to assess if the presence and the degree of severity of the abrasion, as a consequence of the occlusal dysfunction, determine further morphological changes in the dental pulp. Materials and Methods: Study group included teeth dental pulp from 45 cases with occlusal dysfunction, subsequently divided into two subgroups: 24 cases with abrasion (AB) and 21 cases without abrasion (NONAB). The set of morphological parameters of dental pulp were thicknesses of the outer layer, inner layer and entire peripheral pulp zone, the presence of pulpal calcifications and their extent within the dental pulp, the presence of interstitial fibrosis and its extent within the dental pulp and the vascular density (VD) of pulpal capillary network. Tissue samples were fixed in 10% buffered formalin, embedded in paraffin, and sectioned off at 4 μm. Serial slides were stained with Hematoxylin–Eosin (HE), Masson’s trichrome (MT) and anti-cluster of differentiation 34 (CD34) antibodies labeled with 3,3’-Diaminobenzidine (DAB) and transformed into virtual slides on which the above-mentioned parameters were studied comparatively with the help of a dedicated in-house software, realized in MATLAB (MathWorks, USA). The numerical values of the assessed parameters were also stratified in classes, thus obtaining score scales for each parameter. Statistical tools used were Lilliefors test, t-test (two-sample assuming equal variances), Mann–Whitney test, Pearson’s correlation test, one-way analysis of variance (ANOVA) test and χ2 (chi-squared) test. Results and Discussions: Both peripheral zone (PZ) and its layers individually tended to be thicker in the teeth with abrasion than in those without abrasion. Also, teeth with abrasion tended to develop larger amounts of calcium deposits in their dental pulp than teeth without abrasion. On the other hand, fibrotic tissue in dental pulp had no relationship with the presence or absence of abrasion. PZ as a whole and its layers evolved together in the same way, with a stronger correlation in the group of teeth without abrasion. Deposits of calcium evolved in the opposite direction to both the amount of fibrous tissue and the capillaries density of the dental pulp. Consequently, the amount of fibrous tissue and VD evolved together in the same way, more pronounced in the teeth without abrasion. Conclusions: Our preliminary study pointed out that different components of the dental pulp showed slight to moderate changes depending on the degree of abrasion in teeth with occlusal dysfunction.
Keywords: occlusal dysfunction , abrasion , dental pulp , morphometry
Introduction
The dental-maxillary apparatus through all its elements contributes to the achievement of the homeostasis for this anatomical region, thus achieving a necessary and mandatory balance for the activity of the stomatognathic system within functional limits. Any change that occurs causes a chain reaction from these elements that is specific to occlusal dysfunction [1].
The stability of the occlusion contributes, together with the other dental determinants, to ensuring the normal function of the dental-maxillary apparatus. It is influenced by the size of the dental units, the morphology and the inclination of the dental crowns associated with a certain masticatory stereotype.
The integrity of the three types of existing joints (dental-dental, dental-alveolar, and temporo-mandibular) allows the forces triggered during the act of mastication to be neutralized by a specific periodontal mechanism so that the functional mechanical stresses contribute to the stimulatory character for all components of the dental-maxillary system.
Occlusal dysfunction is a consequence of altered dental relationships. Extrusions, egressions, migrations such as tilting or translation, and damage to the marginal periodontium determine the modification of mandibular dynamics which will, in turn, cause coronal or coronal-radicular lesions.
In the case of high intensity occlusal constraints, the compensation of overloads can be done with the appearance of irreversible lesions, such as coronary alterations in the form of dental abrasion.
Dental abrasion, a consequence, as we mentioned above, of occlusal dysfunction, caused by factors other than those that determine the appearance of carious processes, can manifest itself through a quantitative reduction in the thickness of the enamel and dentin layer to varying degrees, which irreversibly determines the modification of the anatomy of the dental units involved [2, 3].
In general, the abrasion affects the dental–dental contact areas, especially the supporting cusps, when we refer to the lateral areas of the dental arches, but it can also be present within the frontal group, depending on the type of occlusion, both in the maxillary and mandible [4].
The consequence determined by the presence of abrasion can be highlighted at the coronal-radicular level by the appearance of dentinal hypersensitivity [5, 6], with changes in the orientation and number of dentinal tubules and those with the dental pulp [7, 8].
Depending on the degree of damage to the dental unit (degree of abrasion), studies on the behavior of the dental pulp have demonstrated the presence of calcifications with a reduction in the volume of pulp tissue [9, 10, 11, 12], simultaneously with a decrease in vascular density [13, 14, 15, 16, 17].
It can be highlighted that the dental pulp and dentin form a structural and functional complex that tends to constitute a reparative unit, the pulp maintaining the vitality of the dentin and this, through positioning, fulfills the role of protection [16, 17, 18, 19, 20, 21].
Aim
In our study, we intended to analyze the behavior of some important morphological features of the dental pulp in relation to the abrasion phenomenon, as the presence and degree of severity in teeth with occlusal dysfunction.
Materials and Methods
Our study is based on a series of 45 teeth coming from patients discovered with occlusal dysfunction. The initial group was divided in two subgroups depending on the presence of the abrasion phenomenon, as follows:
▪ Group 1 – with abrasion (AB): 24 cases;
▪ Group 2 – without abrasion (NONAB): 21 cases.
The studied material consisted of medical records of patients treated for occlusal dysfunction and the biological material, represented by dental pulp collected from these patients.
The study was of retrospective type consisting of examination of the dental pulp morphological status on histological samples.
The set of parameters taken into consideration included:
▪ Thickness of the outer layer of peripheral zone described by Weil/basal layer (WZ);
▪ Thickness of the inner layer of peripheral zone/the cell-rich layer (CZ);
▪ Thickness of the entire peripheral pulp zone, excepting odontoblasts (PZ);
▪ Presence of pulpal calcifications and their extent (%) (C);
▪ Presence of interstitial fibrosis and its extent (%) within the dental pulp (F);
▪ Vascular density (capillaries/mm2) of dental pulp capillary network (VD).
Each of these parameters was assessed depending on the presence of abrasion phenomenon.
The tissue samples were processed using the classical histopathological (HP) technique (formalin fixation and paraffin embedding), cut, and mounted in serial slides and stained with two classical procedures [Hematoxylin–Eosin (HE) and Masson’s trichrome (MT)] in order to identify the PZ layers, the calcifications, and the collagen fibers and immunomarked with anti-cluster of differentiation 34 (CD34) antibodies to identify the dental pulp’s capillaries, as presented in Table 1.
Table 1.
The staining protocol and results
|
Staining type |
Description |
||||
|
HE |
General orientation on the samples. |
||||
|
Measuring of WZ, CZ and PZ thicknesses. | |||||
|
Measuring of calcifications percentage. | |||||
|
MT |
Identification of collagen fibers; measuring of fibrosis percentage. |
||||
|
Anti-CD34 |
Clonality |
Clone |
Source |
Specificity |
Dilution |
|
Monoclonal |
QBEnd 10 |
DAKO |
Endothelial cells |
1:50 |
CD34: Cluster of differentiation 34; CZ: Inner layer of peripheral zone/the cell-rich layer; HE: Hematoxylin–Eosin; MT: Masson’s trichrome; PZ: Entire peripheral pulp zone, excepting odontoblasts; WZ: Outer layer of peripheral zone described by Weil/basal layer.
The serial slides were digitized using a Leica Aperio AT2 scanner, with the ×40 objective.
Acquisition, processing, and morphometric determinations were done using the following specialized software: Aperio ImageScope [v12.3.2.8013] (Figure 1A), analySIS Pro 5.0 (Figure 1B), ACDSee 4.0, and a morphometry software conceived and realized in the MATLAB (MathWorks, USA) program (Figure 1C, 1D).
Figure 1.

Windows of the software used: (a) Aperio ImageScope [v12.3.2.8013]; (b) analySIS Pro 5.0; (c and d) Software designed in the MATLAB (MathWorks) program
For each pulp sample, four values were obtained for outer layer of the peripheral zone (free zone of Weil – WZ), inner layer of peripheral zone (cellular zone – CZ) and entire peripheral zone (PZ) (Figure 1A). The average of the above mentioned four values was calculated and used further as representative for each pulp sample.
Data obtained from the computational algorithms were exported, for the statistical assessment, in “Excel” module of the Microsoft Office 2019 Professional software suite and the XLSTAT 2014 add-on for the “Excel” module.
The values calculated for statistical analysis of numerical parameters were the lowest value (VMIN), the highest value (VMAX), the mean value (AV), the standard deviation (STDEV), the AV+STDEV, and AV-STDEV.
The numerical values of the evaluated parameters were also stratified in classes, thus obtaining score scales for each parameter (Tables 2, 3, 4, 5), scales defined in a previous study [22].
Table 2.
PZ layers Th score expressed in classes of values
|
PZ* score |
Description |
|
Th1 |
Th < 15 μm |
|
Th2 |
15 μm < Th < 30 μm |
|
Th3 |
30 μm < Th < 45 μm |
|
Th4 |
45 μm < Th < 60 μm |
|
Th5 |
60 μm < Th < 75 μm |
|
Th6 |
75 μm < Th |
*Scale is applicable to both PZ layers – WZ and CZ. CZ: Cellular zone; PZ: Peripheral zone; Th: Thickness; WZ: Free zone of Weil
Table 3.
C score expressed in classes of values
|
C score |
Description |
|
C1 |
C < 10% |
|
C2 |
10% < C < 20% |
|
C3 |
20% < C 20% |
|
C4 |
30% < C |
C: Calcification
Table 4.
F score expressed in classes of values
|
F score |
Description |
|
F1 |
F < 15% |
|
F2 |
15% < F < 30% |
|
F3 |
30% < F < 45% |
|
F4 |
45% < F < 60% |
|
F5 |
60% < F |
F: Fibrosis
Table 5.
VD score expressed in classes of values
|
VD score |
Description |
|
VD1 |
VD < 100/mm 2 |
|
VD2 |
100/mm 2 < VD < 200/mm 2 |
|
VD3 |
200/mm 2 < VD < 300/mm 2 |
|
VD4 |
300/mm 2 < VD < 400/mm 2 |
|
VD5 |
400/mm 2 < VD |
VD: Vascular density
Diagrams (graphs) illustrating evolutionary trends of the different parameters, as well as the statistical comparisons between them, were realized using the “Graph” tool from “Word” and “Excel” modules of the Microsoft Office 2019 Professional software suite and the XLSTAT 2014 add-on for the “Excel” module.
Statistical tools used were (a) Lilliefors test for testing normality of strings of numeric values (b) t-test (two-sample assuming equal variances) and Mann–Whitney test, for comparing the mean values of two independent strings of numeric values (c) Pearson’s correlation test for measuring of the intensity and direction of the association between the values of two of the studied parameters, and (d) χ2 (chi-squared) test for comparing the parameters stratified in classes.
Results
Teeth distribution
The distribution of the four main types of teeth in the two groups was quite significantly different (p-value of χ2 test was 0.0649). Thus, almost two thirds of the AB group consisted of incisive teeth while, in the NONAB group the distribution was quite uniform between teeth types, with a slight dominance of the incisive teeth (Figure 2).
Figure 2.
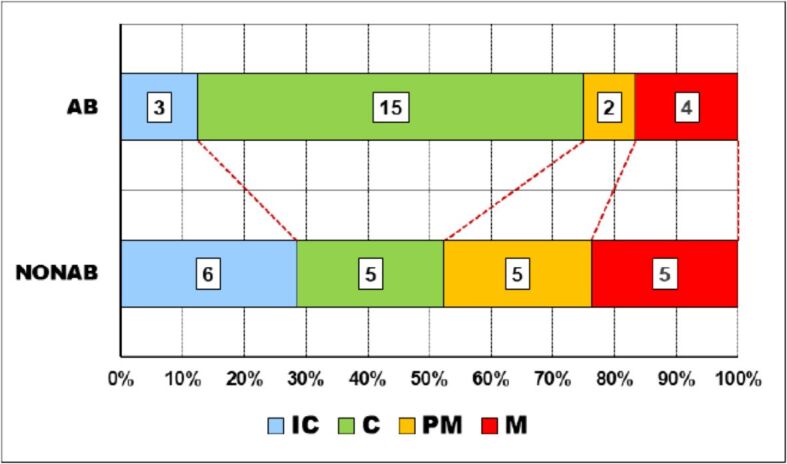
Teeth distribution in the two groups. AB: Abrasion; C: Canine; IC: Incisive; M: Molar; NONAB: Non-abrasion; PM: Premolar
Topography of abrasion types
The evaluation of abrasion from a topographical point of view was made depending on the position on one of the dental arches and the position in relation to the mid-sagittal plane.
Relationship with dental arches
There was a significant difference between the occurrence of different degrees of abrasion on the two dental arches (p-value of χ2 test was 0.0107).
Thus, while on the maxillary, mild abrasion (A I) was present in slightly more than 40% of cases, and severe abrasion (A III) lacked, on the mandible, one third of the cases had severe abrasions and no mild abrasion was present (Figure 3).
Figure 3.
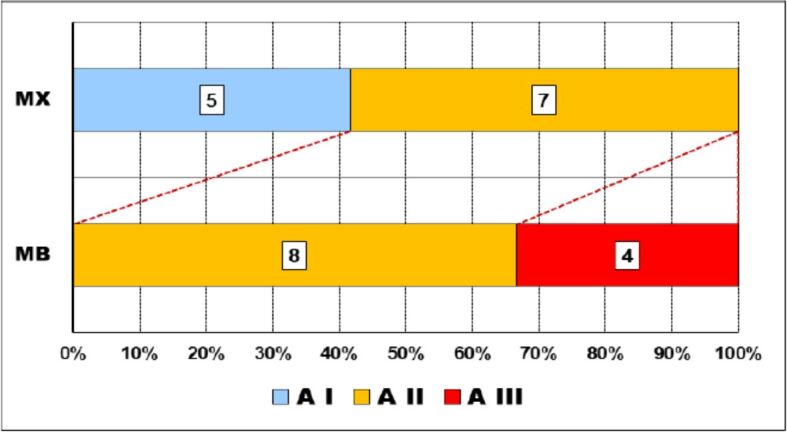
Relationship abrasion–dental arches. A: Abrasion degree; MB: Mandible; MX: Maxillary
Relationship with sagittal plane
The distribution of the degrees of abrasion on either side of the medio-sagittal line was different but with no obvious statistical significance (p-value of χ2 test was 0.1963) (Figure 4).
Figure 4.
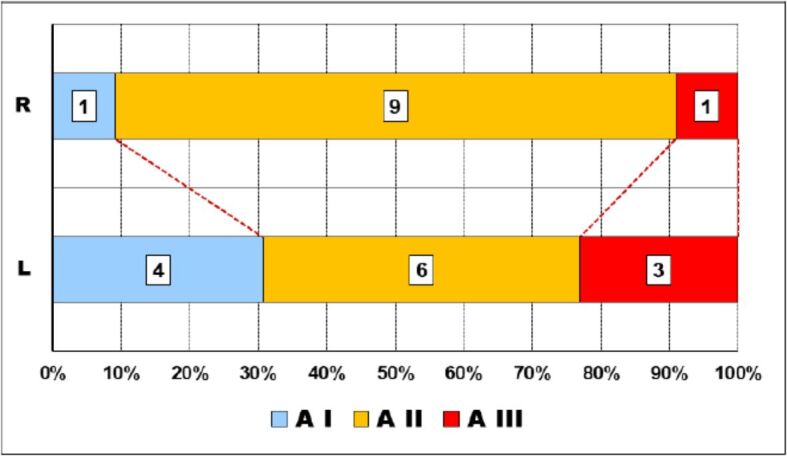
Relationship abrasion–sagittal plane. The outer layer of peripheral zone. A: Abrasion degree; L: Left; R: Right.
Pulpal changes–abrasion relationship
In the next step, we analyzed if the changes of the dental pulp morphology have any connection with the presence or absence of abrasion.
Outer layer of peripheral zone – Weil zone
Data analysis allowed us to observe that, in both groups, dispersion ranges of all values of the thickness of the outer layer of peripheral zone, known also as Weil zone, were not so large, over 29 μm, but larger in cases with no abrasion.
Ranges including most of the values (95%) were also large, having almost half of the widths of corresponding dispersion ranges (AB – 14.69 μm/29.72 μm and NONAB – 17.88 μm/36.69 μm) and being also larger in cases without abrasion, due to higher value of STDEV (8.94 vs 7.34).
However, these intervals were displaced to the bottom limits of the dispersion ranges because both AV values were smaller than halves of the dispersion ranges values (16.9 μm vs 21.8 μm and 15.4 μm vs 22.8 μm, respectively).
Another important observation is that AV thickness of WZ in cases with abrasion was greater than that of cases without abrasion (Figure 5A) although the difference was not statistically confirmed (p-value of Mann–Whitney test was 0.251).
Figure 5.

Comparative statistical data between the two groups of outer layers of peripheral zone thicknesses – WZ_Th. AB: Abrasion; AV: Mean value; MAX: Maximum; MIN: Minimum; NONAB: Non-abrasion; STDEV: Standard deviation; WZ: Free zone of Weil
After grouping the values in classes, we could observe that the thickness of the Weil zone was between 15 μm and 30 μm in slightly more than half of the teeth with abrasion whereas more than half of the teeth without abrasion had a thinner Weil zone of less than 15 μm (Figure 5B).
However, these differences, although evident on the graph, were not validated by the statistical apparatus (p-value of χ2 test was 0.5022).
Inner layer of peripheral zone
In the case of the thickness of the inner layer of peripheral zone, known also as cellular zone, we observed that, in both groups, dispersion ranges of all values were quite expanded (between 48 μm and 60 μm) and, like previously, larger in cases with no abrasion.
Ranges including most of the values (95%) were significantly large, having more than half of the widths of corresponding dispersion ranges (AB – 27.3 μm/49.12 μm and NONAB – 37.6 μm/59.18 μm) and being also larger in cases without abrasion, due to higher value of STDEV (18.8 vs 13.6).
Like previously, these intervals were displaced to the bottom limits of the dispersion ranges because both AV values were slightly smaller than halves of the dispersion ranges values (48 μm vs 51.4 μm and 43 μm vs 49.8 μm, respectively).
Here too, AV thickness of CZ in cases with abrasion was greater than that of cases without abrasion (Figure 6A) although the difference was not statistically confirmed (p-value of t-test was 0.310).
Figure 6.

Comparative statistical data between the two groups of inner layers of peripheral zone thicknesses – CZ_Th. AB: Abrasion; AV: Mean value; CZ: Cellular zone; MAX: Maximum; MIN: Minimum; NONAB: Non-abrasion; STDEV: Standard deviation
After grouping the values in classes, we could observe that the thickness of the cellular zone was greater than 30 μm in more than 90% of the cases with abrasion whereas almost 40% of the teeth without abrasion had a thinner cellular zone of less than 30 μm (Figure 6B). However, these differences, although evident on the graph, were not validated statistically (p-value of χ2 test was 0.1109).
Peripheral zone
In the case of the thickness of the entire peripheral zone, we observed the same pattern of values distributions in both groups as we encountered in its layers.
Thus, dispersion ranges of all values were expanded (between 58 μm and 75 μm) and larger in the group of teeth with no abrasion. Ranges including most (95%) of the values were significantly large, having more than half of the widths of corresponding dispersion ranges (AB – 33.4 μm/58.6 μm and NONAB – 48.9 μm/75.1 μm) and being also larger in cases without abrasion, due to higher value of STDEV (24.5 vs 16.7). Like at the layer level, these intervals were displaced slightly to the bottom limits of the dispersion ranges because both AV values were slightly smaller than halves of the dispersion ranges values (64.8 μm vs 65.1 μm and 58.4 μm vs 62.3 μm, respectively).
Here too, AV thickness of PZ in cases with abrasion was greater than that of cases without abrasion (Figure 7A) although the difference was not validated statistically (p-value of t-test was 0.303).
Figure 7.

Comparative statistical data between the two groups of entire peripheral zone thicknesses – PZ_Th. AB: Abrasion; AV: Mean value; MAX: Maximum; MIN: Minimum; NONAB: Non-abrasion; PZ: Peripheral zone; STDEV: Standard deviation
After grouping the values in classes, we could observe that the thickness of the peripheral zone was greater than 45 μm in slightly more than 60% of the cases without abrasion whereas almost 90% of the teeth with abrasion had a thicker peripheral zone than 45 μm (Figure 7B).
However, these differences too, although evident on the graph, were not statistically validated (p-value of χ2 test was 0.1066).
Calcifications
The percentage values of pulpal calcium deposits followed similar distribution patterns as those observed in thicknesses of peripheral zone and its layers.
The dispersion ranges of all values were large, larger in NONAB group. Ranges including most of the values (95%) were also large, having almost 60% from their corresponding dispersion ranges and larger in NONAB group due to higher value of STDEV (12.2 vs 8.8).
They were also obviously displaced to the bottom limits of the dispersion ranges because both AV values were clearly smaller than the corresponding halves of the dispersion ranges values (16.6% vs 23% and 16.7% vs 23%, respectively). However, AV amounts of calcifications were almost identical in the two groups (Figure 8A), fact also attested by the p-value of t-test which was 0.918.
Figure 8.

Comparative statistical data between the two groups of calcifications amounts – C. AB: Abrasion; AV: Mean value; C: Calcification; MAX: Maximum; MIN: Minimum; NONAB: Non-abrasion; STDEV: Standard deviation
After grouping the values in classes, we could observe that the values distributions were somehow identical, with slightly more than a half of the AB cases having calcium deposits of between 10% and 20% of the dental pulp amount and one third of the NONAB cases having calcium deposits of less than 10% of the dental pulp amount but also one third of the cases with calcium deposits of more than 20% (Figure 8B). However, these differences were not sustained by the statistical apparatus (p-value of χ2 test was 0.5433).
Fibrosis
In the case of fibrosis, the general pattern of percentage values distribution was the same, meaning that dispersion ranges were large, ranges including most (95%) of the values were also large, representing almost 60% of their corresponding dispersion ranges (AB – 46.33%/80.7% and NONAB – 39.17%/69.7%) and AV values were smaller than the corresponding halves of the dispersion ranges values (43.6% vs 49% and 40.7% vs 42.3%, respectively) so that the ranges were displaced to the bottom limits of their corresponding dispersion ranges because of these AV values (Figure 9A).
Figure 9.

Comparative statistical data between the two groups of fibrosis amounts – F. AB: Abrasion; AV: Mean value; F: Fibrosis; MAX: Maximum; MIN: Minimum; NONAB: Non-abrasion; STDEV: Standard deviation
The AV of AB group was also greater than its counterpart in NONAB group, although the difference was not validated by the statistical apparatus (p-value of t-test was 0.651). There was a single difference, namely both ranges of AB group were more expanded than their counterparts in NONAB group (Figure 9A).
After grouping the values in classes, we could observe that the values distributions were somehow homogenous and similar, with slightly more than one third of the cases with abrasion having less than 30% of their dental pulp occupied by fibrosis and almost half of the cases without abrasion having between 30% and 60% of their dental pulp occupied by fibrosis (Figure 9B).
However, these differences were not validated by the statistical apparatus (p-value of χ2 test was 0.8893).
Vascular density
The intra-pulpal vascular network densities followed the same distribution pattern as fibrosis amounts in the two groups only that with more pronounced features in some instances. Thus, both ranges were large and larger in AB group than their counterpart in NONAB group.
Ranges including most (95%) of the values were however more clearly displaced to the bottom limits of their corresponding dispersion ranges because the obvious differences between the halves of the dispersion ranges values (486.3 capillaries/mm2 and 381.6 capillaries/mm2, respectively) and their corresponding AV values (347.8 capillaries/mm2 and 286.4 capillaries/mm2, respectively) (Figure 10A).
Figure 10.

Comparative statistical data between the two groups of vascular densities – VD. AB: Abrasion; AV: Mean value; MAX: Maximum; MIN: Minimum; NONAB: Non-abrasion; STDEV: Standard deviation; VD: Vascular density
The AV of AB group was also greater than its counterpart in NONAB group, although the difference was not validated by the statistical apparatus (p-value of Mann–Whitney test was 0.187).
After grouping the values in classes, we could observe that the values distributions were somehow homogenous, with almost 90% of the cases with abrasion having pulpal VDs higher than 100 capillaries/mm2 and almost one third of the cases without abrasion having pulpal VDs less than 100 capillaries/mm2 (Figure 10B).
However, these differences were not validated by the statistical apparatus (p-value of χ2 test was 0.3963).
Relationship between different pulpal changes depending on abrasion presence
In the next step of our analysis, we compared the possible relationships between the dental pulp morphological features taken into consideration in the two groups designed depending on abrasion’s presence.
WZ–CZ
The thicknesses of the two layers of the peripheral zone presented a trend of direct relationship in both groups (Pearson’s test correlation matrix values positive in both groups), meaning that when the thickness of one layer increased the thickness of the other had the same behavior and vice versa.
The only difference was that, in the AB group, this direct relationship was just a tendency, not validated by the statistical apparatus (p-value of Pearson’s test was 0.3503) (Figure 11A), whereas in the NONAB group, the relationship was a true direct correlation (Figure 11B), with Pearson’s test p-value of 0.0245 (<0.05 – the reference value).
Figure 11.

Relationship between PZ and its layers depending on abrasion presence: (a and b) WZ–CZ; (c and d) WZ–PZ; (e and f) CZ–PZ; (a, c and e) Abrasion group; (b, d and f) Non-abrasion group. CZ: Cellular zone; PZ: Peripheral zone; WZ: Free zone of Weil.
WZ–PZ
When we compared the ways peripheral zone and its outer layer – Weil zone thicknesses are evolving, we could observe that they were in a true, direct relationship in both groups (Pearson’s test correlation matrix values positive in both groups), with both p-values of Pearson’s test <0.05 (the reference value), in other words, when the thickness of peripheral zone increased the thickness of Weil zone had the same behavior and vice versa.
The only difference was that the correlation was more pronounced in NONAB group – Pearson’s test p-value was <0.0001 (Figure 11D) – than in AB group, where Pearson’s test p-value was 0.0019 (Figure 11C).
CZ–PZ
When we compared the ways peripheral zone and its inner layer – cellular zone thicknesses are evolving, we could observe that those too were in a true direct relationship in both groups (Pearson’s test correlation matrix values positive in both groups), with both p-values of Pearson’s test <0.0001 (Figure 11E, 11F).
In other words, when the thickness of peripheral zone increased the thickness of cellular zone had the same behavior and vice versa.
Fibrosis–Calcifications
When we compared the ways the amounts of dental pulp fibrosis and calcifications are evolving, we could observe that they presented a trend of inverse relationship in both groups (correlation matrix values of Pearson’s test were negative and p-values of Pearson’s test >0.5 – the reference value) meaning that they had opposite ways of evolving or, in other words, when the amount of fibrosis had the tendency to increase, the percentage of calcifications had the tendency to decrease and vice versa.
The only difference was that the correlation trend was more pronounced in NONAB group – correlation matrix value of Pearson’s test was -0.1969 and p-value of Pearson’s test was 0.3922 (Figure 12B) – than in AB group, where correlation matrix value of Pearson’s test was -0.1229 and p-value of Pearson’s test was 0.5672 (Figure 12A).
Figure 12.

Relationship between fibrosis, calcifications and VD depending on abrasion presence: (a and b) Fibrosis–calcifications; (c and d) Fibrosis–VD; (c and f) Calcifications–VD; (a, c and e) Abrasion group; (b, d and f) Non-abrasion group. VD: Vascular density
Fibrosis–Vascular Density
When we compared the ways the amount of dental pulp fibrosis and dental pulp VD are evolving, we could observe that they presented trends of direct relationship in both groups (correlation matrix values of Pearson’s test were positive and p-values of Pearson’s test >0.5 – the reference value) meaning that when the amount of fibrosis had the tendency to increase, the VD had the tendency to increase too and vice versa.
The only difference was that the correlation trend was more pronounced in NONAB group – Pearson’s test p-value was 0.1568 (Figure 12D) – than in AB group, where Pearson’s test p-value was 0.3437 (Figure 12C).
Calcifications–Vascular Density
The relationship between calcifications and VD was similar to that between calcifications and fibrosis, i.e., a trend of inverse relationship in both groups (correlation matrix values of Pearson’s test were negative and p-values of Pearson’s test >0.5 – the reference value) meaning that they had opposite ways of evolving or, in other words, when the calcifications amount had the tendency to increase, the VD had the tendency to decrease and vice versa.
The only difference was that the correlation trend was more pronounced in AB group – Pearson’s test correlation matrix value was -0.1869 and Pearson’s test p-value was 0.3819 (Figure 12E) – than in NONAB group, where Pearson’s test correlation matrix value was -0.087 and Pearson’s test p-value of was 0.7071 (Figure 12F).
Abrasion degree and pulpal changes
Finally, we analyzed if the degree of abrasion is correlated with any change of the morphological features of dental pulp.
Outer layer of peripheral zone
The thickness of Weil layer seemed to become larger as the degree of abrasion increased but this enlargement was not uniform, registering an atypical highest value in teeth with moderate abrasion (Figure 13A).
Figure 13.

Relationship between pulpal changes and abrasion degree: (a) Abrasion–WZ thickness; (b) Abrasion–calcification amount; (c) Abrasion–CZ thickness; (d) Abrasion–fibrosis amount; (e) Abrasion–PZ thickness; (f) Abrasion–vascular density. C: Calcification; CZ: Cellular zone; F: Fibrosis; PZ: Peripheral zone; VD: Vascular density; WZ: Weil zone
This oscillating trend was confirmed by the p-value of χ2 test, which was 0.807.
Inner layer of peripheral zone
The same situation appeared in the evolution of cellular layer of peripheral zone’s thickness depending on the abrasion’s degree.
Thus, although the layer seemed to be thinner in teeth with less abrasion and thicker as the degree of abrasion increases, the greatest number of high values of its thickness appeared in teeth with moderate abrasion (Figure 13C), atypical situation sustained also by the p-value of χ2 test, which was 0.793.
Peripheral zone
Finally, if we have taken into consideration the peripheral zone as a whole, and measured its thickness, we observed that the tendency of thickening as the degree of abrasion is increasing became more pronounced so that the statistical apparatus validated it as a true correlation (p-value of χ2 test was 0.0290, lower than the reference value of 0.05). However, the atypical situation consisting in the presence of the largest percentage of high values of the layer’s thickness in teeth with moderate abrasion was present here too (Figure 13E).
Calcifications
In the case of calcifications, the percentage of calcium accumulations had an opposite trend to that of dental pulp peripheral structures, meaning that presence of calcium deposits seemed to decrease from teeth with reduced abrasion toward teeth with severe abrasion but with the same somehow strange situation of observing the largest percentage of higher amounts of calcium deposits in teeth with moderate abrasion (Figure 13B).
Thus, the statistical apparatus didn’t validate as true the decreasing trend of the calcium accumulations as the degree of abrasion is increasing (p-value of χ2 test was 0.471).
Fibrosis
The fibrosis process presented also a discrete increasing tendency from group with reduced abrasion towards the group with severe abrasion but with the same peculiarity of registering more cases with higher degrees of fibrosis in the middle group with moderate abrasion (Figure 13D). This “peak” altered consequently the statistical assessment which didn’t validate the tendency as a true one (p-value of χ2 test was 0.282).
Vascular density
VD seemed to present no correlation trend with the degree of abrasion (Figure 13F), situation confirmed by the p-value of χ2 test, which was 0.919.
Discussions
Clinical manifestations can take on various aspects, being characterized by the appearance, depending on the degree of abrasion, of painful sensitivity. The latter can lead, in a first step, to disrupting the normal blood circulation of the dental pulp with an increase in pulp saturation values, close to the levels’ characteristic of hyperemia.
Previous studies showed that the pulp damage became more severe with time, affecting the defense response which, correlated with the reduced pulp regeneration capacity, is manifested by the increase of the inflammatory infiltrate and pulp calcification and the decrease in the number of nucleated cells in the odontoblast layer and the central pulp [23, 24].
Abrasion–pulpal changes relationship
Recent research has highlighted that coronal pulp has a high cellularity rate [25]. In our study, peripheral zone and its layers individually had the tendency to be thicker in the teeth with abrasion as compared to those without abrasion (the AB AVs were higher than NONAB AVs in all three assessments). This trend was reduced at the outer layer level, moderate at the inner layer level and the most pronounced at the level of peripheral zone as a whole.
Dental pulp is also prone to nodular mineralization around altered cells. The morphology of the intra-pulpal calculi seems to be influenced the most by their location Thus, the great majority of calculi placed in the pulp cavity show a nodular shape, while those placed in the root canals have a diffuse shape, determined by the root canal anatomy. The external surface of the nodules usually presents a heterogeneous appearance, consisting of an alternation between smooth and compact areas and rough and porous areas. The chemical composition is related to both nodule location in the pulp cavity and the appearance of the exterior outline of the analyzed area [25]. In our study, although the AVs amounts of calcium deposits in the two groups were similar, teeth with abrasion had the tendency to develop larger amounts of calcium deposits in their dental pulp than teeth without abrasion.
The morphological pattern of the root pulp has a diffuse appearance due to the presence of larger caliber vascular bundles and a higher content of collagen fibers, which have a marked variability in shape, size, and topography [25]. In our study, although the AV amount of fibrotic tissue in dental pulp of teeth with abrasion was greater that in the dental pulp of those without abrasion, there were no differences between the distribution of different degrees of dental pulp fibrosis in the two groups, in other words, no relationship with the presence or absence of abrasion.
Relationship between different pulpal changes depending on abrasion presence
The analysis of the relationship between the peripheral zone as a whole and its layers revealed that they are evolving together in the same way, whether or not abrasion was present, with a stronger correlation, however, in the group of teeth without abrasion.
Deposits of calcium evolved in the opposite direction to both the amount of fibrous tissue and the capillaries density of the dental pulp. The relationship with fibrous tissue was more pronounced in the teeth without abrasion whereas that with VD was more pronounced in teeth with abrasion.
Consequently, the amount of fibrous tissue and VD evolved together in the same way but more pronounced in the teeth without abrasion.
Abrasion degree and pulpal changes
Finally, the peripheral zone and its layers thicknesses, the deposits of calcium and the fibrosis process revealed a more or less evident tendency of being more prominent as the degree of abrasion becomes more severe. However, there was a particularity of this growing tendency consisting of a peak of their values in the teeth with moderate abrasion, followed by a reduction of values but keeping the increasing trend.
VD had an individual type of behavior in relation to the degree of abrasion, in the sense that its values seemed not to be influenced by the degree of abrasion.
Conclusions
Our preliminary study highlighted the fact that, in teeth with occlusal dysfunction, the phenomenon of abrasion is associated with reactive changes in the components of the dental pulp (cells, supporting connective tissue, extracellular matrix and vascular network). These changes show slight to moderate variations depending on the degree of abrasion. Larger cohort studies are further needed to define more precisely the relationship between the degree of abrasion and the reaction of dental pulp components in occlusal dysfunction.
Conflict of interests
The authors declare that they have no conflict of interests.
Author contribution
The first and the second authors had equal contribution to the achievement of this paper.
References
- 1. Burlui V , Morăraşu C . Gnatologie . Iaşi, Romania : Ed. Apollonia ; 2000 . pp. 76 – 89 . [Google Scholar]
- 2.Moreno S, Moreno F. Dental anthropology: clinical importance [Importancia clínica de la antropología dental] Rev Estomatol. 2007;15(2 Suppl 1):42–53. [Google Scholar]
- 3.Warreth A, Abuhijleh E, Almaghribi MA, Mahwal G, Ashawish A. Tooth surface loss: a review of literature. Saudi Dent J. 2020;32(2):53–60. doi: 10.1016/j.sdentj.2019.09.004. [DOI] [PMC free article] [PubMed] [Google Scholar]
- 4. Ieremia L , Dociu I . Funcţia şi disfuncţia ocluzală . Bucharest, Romania : Ed. Medicală ; 1987 . pp. 24 – 220 . [Google Scholar]
- 5.Addy M, Dowell P. Dentine hypersensitivity - a review. Clinical and in vitro evaluation of treatment agents. J Clin Periodontol. 1983;10(4):351–363. doi: 10.1111/j.1600-051x.1983.tb01284.x. [DOI] [PubMed] [Google Scholar]
- 6.Reis BO, Prakki A, Stavroullakis AT, Souza MT, Siqueira RL, Zanotto ED, Briso ALF, Tavares Ângelo, Henrique dos. Analysis of permeability and biological properties of dentin treated with experimental bioactive glasses. J Dent. 2021;111:103719–103719. doi: 10.1016/j.jdent.2021.103719. [DOI] [PubMed] [Google Scholar]
- 7.Shiau HJ. Dentin hypersensitivity. J Evid Based Dent Pract. 2012;12(3 Suppl):220–228. doi: 10.1016/S1532-3382(12)70043-X. [DOI] [PubMed] [Google Scholar]
- 8.Pashley DH. Dynamics of the pulpo-dentin complex. Crit Rev Oral Biol Med. 1996;7(2):104–133. doi: 10.1177/10454411960070020101. [DOI] [PubMed] [Google Scholar]
- 9.Kohli A, Pezzotto S, Poletto L. Apical and non-apical hypercementosis in human dental root [Hipercementosis apicales y no apicales en raíces dentarias humanas] Int J Morphol. 2011;29(4):1263–1267. [Google Scholar]
- 10.Patterson SS, Mitchell DF. Calcific metamorphosis of the dental pulp. Oral Surg Oral Med Oral Pathol Oral Radiol Endod. 1965;20(1):94–101. [Google Scholar]
- 11.Huang LG, Chen G. A histological and radiographic study of pulpal calcification in periodontally involved teeth in a Taiwanese population. J Dent Sci. 2016;11(4):405–410. doi: 10.1016/j.jds.2016.05.001. [DOI] [PMC free article] [PubMed] [Google Scholar]
- 12. Shafer WG , Hine MK , Levy BM . Shafer’s textbook of oral pathology . 5th . New Delhi, India : Elsevier ; 2006 . pp. 799 – 802 . [Google Scholar]
- 13.Consolaro A. Clinical and imaginologic diagnosis of occlusal trauma. Dent Press Endod. 2012;2(3):10–20. [Google Scholar]
- 14.Iijima T, Zhang JQ. Three-dimensional wall structure and the innervation of dental pulp blood vessels. Microsc Res Tech. 2002;56(1):32–41. doi: 10.1002/jemt.10007. [DOI] [PubMed] [Google Scholar]
- 15.Caviedes-Bucheli J, Gomez-Sosa JF, Azuero-Holguin MM, Ormeño-Gomez M, Pinto-Pascual V, Munoz HR. Angiogenic mechanisms of human dental pulp and their relationship with substance P expression in response to occlusal trauma. Int Endod J. 2017;50(4):339–351. doi: 10.1111/iej.12627. [DOI] [PubMed] [Google Scholar]
- 16.Holland GR. Morphological features of dentine and pulp related to dentine sensitivity. Arch Oral Biol. 1994;39(Suppl):3S–11S. doi: 10.1016/0003-9969(94)90182-1. [DOI] [PubMed] [Google Scholar]
- 17.Golež A, Ovsenik M, Cankar K. The effect of orthodontic tooth movement on the sensitivity of dental pulp: a systematic review and meta-analysis. Heliyon. 2023;9(4):e14621–e14621. doi: 10.1016/j.heliyon.2023.e14621. [DOI] [PMC free article] [PubMed] [Google Scholar]
- 18. Kim S , Trowbridge H , Suda H . In: Pathways of the pulp . 8th . Cohen S , et al., editors. St. Louis, USA : Mosby ; 2002 . Pulpal reaction to caries and dental procedures ; pp. 573 – 602 . [Google Scholar]
- 19.Ricucci D, Loghin S, Lin LM, Spångberg LSW, Tay FR. Is hard tissue formation in the dental pulp after the death of the primary odontoblasts a regenerative or a reparative process. J Dent. 2014;42(9):1156–1170. doi: 10.1016/j.jdent.2014.06.012. [DOI] [PubMed] [Google Scholar]
- 20.Ghazali FBC. Permeability of dentine. Malays J Med Sci. 2003;10(1):27–36. [PMC free article] [PubMed] [Google Scholar]
- 21.Matthews B, Vongsavan N. Interactions between neural and hydrodynamic mechanisms in dentine and pulp. Arch Oral Biol. 1994;39(Suppl):87S–95S. doi: 10.1016/0003-9969(94)90193-7. [DOI] [PubMed] [Google Scholar]
- 22.Cărămizaru M, Pleşea IE, Dragomir LP, Popescu MR, Uscatu CD, Şerbănescu MS, Alexandru DO, Comănescu TM. Quantitative assessment of morphological changes of dental pulp components of teeth affected by occlusal trauma. Rom J Morphol Embryol. 2018;59(3):729–740. [PubMed] [Google Scholar]
- 23.Shi Y, Wang J, Cao C. The effect of artificial traumatic occlusion on the pulp and periodontium in rat molars] Zhonghua Kou Qiang Yi Xue Za Zhi. 1997;32(4):212–214. [PubMed] [Google Scholar]
- 24.Amaral MF, Casatti CA, Naqvi AR, Debortoli CVL, Atili Brandini. Histological changes in pulp-dentin complex in tooth subjected to traumatic occlusion and subluxation. Saudi Dent J. 2024;36(2):321–327. doi: 10.1016/j.sdentj.2023.11.012. [DOI] [PMC free article] [PubMed] [Google Scholar]
- 25.Palatyńska-Ulatowska A, Fernandes MC, Pietrzycka K, Koprowicz A, Klimek L, Souza RA, Pradebon M, de Figueiredo. The pulp stones: morphological analysis in scanning electron microscopy and spectroscopic chemical quantification. Medicina (Kaunas) 2021;58(1):5–5. doi: 10.3390/medicina58010005. [DOI] [PMC free article] [PubMed] [Google Scholar]