

Summary
Small noncoding RNAs (sncRNAs) regulate biological processes by impacting post-transcriptional gene expression through repressing the translation and levels of targeted transcripts. Despite the clear biological importance of sncRNAs, approaches to unambiguously define genome-wide sncRNA:target RNA interactions remain challenging and not widely adopted. We present CIMERA-seq, a robust strategy incorporating covalent ligation of sncRNAs to their target RNAs within the RNA-induced silencing complex (RISC) and direct detection of in vivo interactions by sequencing of the resulting chimeric RNAs. Modifications are incorporated to increase the capacity for processing low-abundance samples and permit cell-type-selective profiling of sncRNA:target RNA interactions, as demonstrated in mouse brain cortex. CIMERA-seq represents a cohesive and optimized method for unambiguously characterizing the in vivo network of sncRNA:target RNA interactions in numerous biological contexts and even subcellular fractions. Genome-wide and cell-type-selective CIMERA-seq enhances researchers’ ability to study gene regulation by sncRNAs in diverse model systems and tissue types.
Keywords: small noncoding RNAs, sncRNA:target RNA interactions, genome-wide profiling, cell-type-selective, chimeric RNA sequencing, RNA-induced silencing complex, RISC, forebrain, microRNA, miRNA, post-transcriptional regulation, excitatory neuron
Graphical abstract
Highlights
-
•
Establishes robust sncRNA:target RNA interaction profiling by chimeric RNA sequencing
-
•
Improves efficiency for feasible sncRNA:target RNA profiling in low-abundance samples
-
•
Advances a cell-type-selective sncRNA:target RNA interaction profiling strategy
-
•
Provides a platform that can be tailored for diverse biological questions
Motivation
While approaches to unambiguously profile Ago-associated RNA-induced silencing complex activity by intermolecular ligation of small noncoding RNAs to target RNAs had been previously reported, attempts to reproduce these approaches in our own lab and discussions with other investigators indicated that low-efficiency recovery of chimeric RNAs was a common barrier to practical usage and hindered in-depth characterizations. Low efficiency might particularly negatively impact our desired cell-type-selective strategies, in which sample inputs of limited abundance could be typical. For these reasons, we undertook stepwise reengineering of the experimental approach, assessing each step for optimization.
The genome-wide analysis of small noncoding RNA interactions with target genes offers insights into post-transcriptional gene regulation but has not been widely adopted. Li et al. develop CIMERA-seq for robust and cell-type-selective approaches to assessing in vivo small noncoding RNA interactions.
Introduction
Small noncoding RNAs (sncRNAs) can regulate biological processes by repressing the levels and translation of targeted transcripts within the RNA-induced silencing complex (RISC). Despite the clear importance of sncRNAs, such as microRNAs (miRNAs), in mediating post-transcriptional gene regulation, molecular approaches for unambiguous genome-wide definition of sncRNA:target RNA interactions have only recently been possible. Standardization and broad adoption of these approaches can advance understanding in sncRNA biology.
Early efforts exploring RNA-protein interactions used ultraviolet light (UV) to covalently crosslink RNA binding proteins to bound RNAs with subsequent sequencing (called crosslinking and immunoprecipitation [CLIP])1; this technique was later combined with high-throughput sequencing (HITS-CLIP).2 HITS-CLIP has been applied broadly to study RNA binding proteins, including Argonaute (Ago) proteins, key components of the RISC (Ago HITS-CLIP).3 Ago HITS-CLIP produced two datasets, the sequences of miRNAs and of mRNAs bound to Ago, and bioinformatic tools were used to indirectly infer interactions based mainly on the miRNA seed sequence and complementary sites within mRNA 3′ UTRs. While bioinformatics refined a list of potential miRNA:target RNA interactions, these predictions remained inadequate for some purposes, with false positives and false negatives arising from features such as (1) noncanonical seed interactions,4,5,6 (2) base pairing outside of the miRNA seed,4,6,7,8,9,10 (3) miRNA binding sites outside mRNA 3′ UTRs,11,12,13 (4) RNA binding proteins and mRNA secondary structure impacting miRNA binding site accessibility,14,15 (5) post-translational modifications of Ago and cofactors altering miRNA function,16,17 and (6) differential subcellular localization of miRNAs and target RNAs.18 Further, while altered miRNA abundance is a common feature of both disease and physiological responses,19 Ago HITS-CLIP and bioinformatic predictions do not allow assessment of the consequences of altered miRNA levels on target repression.20
These factors highlight the need for accurate genome-wide strategies to investigate sncRNA:target interactions. More recent approaches addressed these issues using covalent ligation of sncRNAs to their target RNAs within the RISC and direct detection of the in vivo interactions by sequencing resulting chimeric RNAs.4,8,10,21 Despite clear advantages, broad adoption of these approaches has lagged, in part due to challenges in establishing the laboratory techniques, in efficiency of capturing sncRNA:target RNAs, and in computational analysis of resulting data. Here, we describe a reliable strategy incorporating modifications that increase the capacity for processing low-abundance samples and for quantitative analyses of the RNAs.20,22,23 In addition, we validate an approach for cell-type-selective profiling of sncRNA:target RNA interactions that incorporates a conditionally expressed tagged Argonaute 2.24 These strategies aim to facilitate broad adoption of a rigorous approach for unambiguously identifying sncRNA:target interactions in vivo, including in specific cell types.
Results
Isolation of sncRNA:target RNA interactions in mouse forebrain using CIMERA-seq
This section describes the steps and critical parameters of our approach using CLIP of Ago2 followed by intermolecular ligation of sncRNAs to their targets and sequencing, designated CIMERA-seq (i.e., crosslinking and immunoprecipitation followed by intermolecular ligation of endogenous RNAs bound to Argonaute and high-throughput sequencing). Parallel strategies achieve either global or cell-type-selective profiling of ligated sncRNA:target RNA interactions (Figure 1). A full benchtop protocol is described in a companion STAR Protocols paper. While this approach has been optimized using mouse brain tissue, it is conceptually and practically applicable to other tissues and organisms.
Figure 1.

Flowchart of sncRNA:target RNA interaction profiling using global or cell-type-selective CIMERA-seq biochemical protocols
(1) Fresh samples are obtained using RNase-free technique. Tissue (exemplified here with mouse forebrain) is homogenized by passing through a needle several times.
(2) Photocrosslinking. RNAs are crosslinked to Argonaute within the endogenous RISC in samples irradiated with UV light (254 nm).
(3) RNase treatment. Crosslinked samples are lysed and treated with RNase 1 to trim back RNAs bound to Argonaute.
(4) Immunoprecipitation. Samples are immunoprecipitated using an antibody against Argonaute 2 (anti-Ago2) or an antibody against myc tag (anti-myc) if performing cell-selective sncRNA:target RNA interaction profiling.
(5) Intermolecular ligation. The 5′ end of the target RNA is ligated to the 3′ end of the sncRNA to form a chimeric RNA.
(6) 3′ adapter ligation. A DNA adapter is ligated to the 3′ end of the chimeric RNA to allow for PCR amplification and sequencing on the Illumina platform.
(7) SDS-PAGE and nitrocellulose transfer. Argonaute-RNA complexes are isolated from potential nonspecific IP contaminants. This step is skipped if sample input (at step 4) was <1 mg.
(8) Proteinase K and RNA isolation. Nitrocellulose membrane pieces are digested with proteinase K to release bound RNAs, which are isolated by phenol-chloroform extraction.
(9) 5′ adapter ligation. A DNA adapter is ligated to the 5′ end of the chimeric RNA to allow for PCR amplification and sequencing on an Illumina platform.
(10) Reverse transcription. Reverse transcription is performed to generate cDNA libraries.
(11) Test PCR. Test PCR is performed to determine the optimal amplification cycle number for the cDNA library.
(12) Full-scale PCR. Remaining cDNA library is amplified using a common forward primer and indexed reverse primer that is compatible with the Illumina platform.
(13) Size selection and DNA isolation. The sequencing libraries are size selected to eliminate primer dimers and isolate the chimeric cDNAs.
(14) Sequencing. Libraries are sequenced, typically by paired-end sequencing on an Illumina platform.
Tissue is harvested and gently homogenized (Dounce or needle passes) to generate a single-cell suspension (Figure 1, step 1). A portion (roughly one-tenth) of the homogenate is reserved for RNA isolation for sncRNA and mRNA bulk sequencing for comparison to reads from CIMERA-seq. Photocrosslinking of biological samples using 254-nm-wavelength ultraviolet (UV) light (e.g., with a Stratalinker 2400 [Stratagene]) forms covalent bonds between nucleotide bases and specific amino acids in close proximity.25,26,27 This ensures that the RNAs contained within the endogenous RISC remain bound throughout multiple enzymatic steps (Figure 1, step 2). Optimize crosslinking at the outset of experiments for a given sample type to enable efficient crosslinking with minimal sample damage. Optimization can be accomplished by labeling endogenous Ago-RNA complexes with [γ-32P]ATP and tracking their mobility using SDS-PAGE. As UV light delivered to the sample increases, the endogenous Ago band intensity (∼100 kDa) is decreased by a mobility shift through crosslinking to endogenous RNA interactors of varying lengths (Figures 2A and 2B, also observed as diffusion of the ∼100-kDa band). Optimization indicated 4,000 μJ/cm2 × 100 for three rounds for effective crosslinking for 1 mL of 0.5–10 mg/mL mouse forebrain homogenate (Figure 2B), which is consistent with prior observations.3
Figure 2.

Optimization steps for scnRNA:target RNA interaction profiling in mouse forebrain using CIMERA-seq
(A) Immunoblot showing decrease of the expected band for endogenous Ago2 in mouse forebrain homogenate samples exposed to no crosslinking or increasing doses of UV light (254 nm, 3 pulses) at 0, 1,000, 2,000, and 4,000 μJ/cm2 × 100.
(B) Autoradiogram overlaid with immunoblot showing decreased intensity of the endogenous Ago2 band accompanied by increased intensity of 32P-labeled Argonaute-RNA complexes in mouse forebrain homogenates photocrosslinked at 0 or 4,000 μJ/cm2 × 100.
(C) Autoradiogram showing effect of increasing RNase concentration on the incorporation of 32P during intermolecular ligation. Mouse forebrain homogenates were photocrosslinked or non-crosslinked (control), and treated with increasing amounts of RNase (0.1, 1, 10, 50, 100, 250, 500, and 1,000 units) including a non-RNase control. Complexes were phosphorylated prior to intermolecular ligation and transferred to nitrocellulose for 32P-incorporation visualization.
(D) Autoradiogram highlighting the membrane region corresponding to Argonaute-RNA complexes following optimal IP, RNase treatment, 32P incorporation, and intermolecular ligation. Mouse forebrain homogenates were photocrosslinked and immunoprecipitated with 1 μg of α-Ago2 antibody(Clone 2D4, Wako); immunoprecipitated lysate was titrated from 1 to 8 mg. Samples were treated with or without RNase and ligase. [γ-32P]ATP was used during the phosphorylation step prior to intermolecular ligation; region corresponding to miRNA-target-Argonaute complexes is indicated (black bracket). Sample controls (5 mg) treated with or without ligase or RNAse at right.
(E) Immunoblot comparison of Ago immunoprecipitate from mouse hippocampal lysates by two distinct antibodies. Top: α-pan-Ago (clone 2A8). Bottom: α-Ago2 (clone 2D4). 1 μg of antibody bound to 15-μL bed volume of Protein G Sepharose (GE17-0618-01) was used to immunoprecipitate 1 mg of protein lysate in 1 mL for 4 h at 4°C for each antibody. L, 5% lysate (50 μg); P, 5% pre-cleared lysate (50 μg); IP, immunoprecipitation. Higher antibody amounts might immunoprecipitate additional remaining target in lysates (P).
(F) Total chimeric RNAs detected following CIMERA-seq of libraries prepared using IP with an α-Ago2 antibody (clone 2D4) (orange) compared with IP with mouse IgG1κ isotype control antibody (Invitrogen, clone P3.6.2.8.1) (blue). Error bars represent SEM.
(G) Immunoblot comparison of anti-myc tag antibodies for detection of tAgo2 from equally loaded mouse brain lysates, including clones 9B11 (Cell Signaling, 2276), 4A6 (Millipore Sigma, 05-724), 9E10 (Abcam, ab32), and 9E10.3 (Invitrogen, AHO0062).
(H) Determining optimal PCR for cDNA library amplification prior to sequencing. Representative gel depicting cDNA library dilutions to simulate the indicated equivalent numbers of PCR cycles. Percentages (below lanes) report unused primer remaining relative to primer alone lane (P); bands corresponding to RNA PCR primer (RP1) and RNA PCR index primer (RPI1) are indicated.
(I) Library size distribution following full-scale PCR of cDNAs. Representative gel depicting the size distribution of the library for samples that did or did not receive photocrosslinking. Spectra on either side of the lanes represent band-intensity plots (generated with ImageJ). Blue box represents the region of the gel that is expected to contain cDNAs representing miRNA-target chimeras with adapters. Brackets represent regions of the gel corresponding to primer dimers, single miRNAs ligated to adapters (miRNA alone), and miRNA-target chimeras ligated to adapters.
(J) Representative bioanalyzer trace depicting the size distribution (x axis units are base pairs) and intensity (y axis in fluorescence units, FU) of the library following size selection from the gel. The two peaks correspond to the miRNA alone (150 bp) and miRNA-target chimera (172 bp) populations in the library.
(K) Bar graph comparing the percentage of deduplicated reads representing unique sncRNA-target RNA chimeras between CIMERA-seq and previously published methods. Publicly available datasets from publications generating sncRNA:target RNA chimeras and data generated using CIMERA-seq were analyzed using SCRAP. y axis is average number of chimeras detected per million deduplicated reads per library; bar labels are average percentage of deduplicated reads representing unique sncRNA-target RNA chimeras across libraries within a dataset. Error bars represent SD.
Following crosslinking of single-cell suspensions, cells are collected by pelleting, lysed, and treated with RNase 1 to trim RNAs bound to Argonaute, bringing their 5′ and 3′ ends within close proximity to allow subsequent efficient ligation. The inclusion of DNase during this step ensures that only RNA-RNA interactions are detected (Figure 1, step 3). RNase 1 is preferred due to its cleavage of single-stranded RNA after all four nucleotide bases, compared to RNase A or RNAse T1, which cleave only after pyrimidines or guanidines, respectively.28 As with photocrosslinking, the optimal RNase 1 concentration should be determined for a given tissue, cell type, quantity, and sample preparation method. Excessive RNase treatment overdigests bound RNAs and inhibits successful ligation, while underdigestion will also decrease ligation efficiency (Figure 2C). In our experience, approximately 0.5–1.2 units of RNase 1 per mg of protein lysate is suitable for CIMERA-seq (Figure 2C, using forebrain). Due to the restricted window of optimal RNase concentrations, the presence of endogenous and contaminating RNase enzymes, and the need to preserve limited starting material, an RNase inhibitor (RNaseOUT, Invitrogen), which inhibits endogenous RNases A, B, and C, is included throughout the protocol. While digestion by RNase 1 produces 5′ hydroxyl and 3′ phosphate groups on cleaved target RNAs, the 5′ and 3′ ends of the miRNA are protected within RNA binding pockets in the middle (MID)29,30 and PIWI/Argonaute/Zwille (PAZ) domains31,32,33,34 of Ago, respectively. Note that single-stranded selectivity of RNAse1 is not absolute, and excessive RNAse1 will degrade desired miRNA:target RNA interactions.
Photocrosslinked, RNase-treated Ago complexes are then immunoprecipitated using anti-Ago2 antibody for global sncRNA:target RNA profiling, or anti-myc antibody for GFP-myc tagged Ago2 (tAgo2) in cell-type-selective profiling (Figure 1, step 4). Subsequent sections detail cell-type-selective profiling. While initial approaches for generating chimeric RNA-seq data from mouse utilized an antibody recognizing all four mammalian Argonautes (α-pan-Ago, MilliporeSigma, clone 2A8),8 we found this antibody less effective for Argonaute immunoprecipitation (IP) than an antibody against an individual Argonaute family member, anti-Ago2 clone 2D4 (Wako) (Figure 2E). Although an Ago2 antibody (as opposed to a pan-Ago antibody) would have the potential to immunoprecipitate only a subset of all miRNA-target interactions, no preference has been observed for a given Argonaute family member to bind particular miRNAs.35,36,37 Further, Ago2 is the most abundant Argonaute family member in mouse brain38 and other mammalian tissues,39,40 and anti-Ago2 antibodies have been previously used to study miRNA-target interactions.41,42,43 Pull-down specificity by a robust α-Ago2 antibody (Wako, clone 2D4) was confirmed with significant reduction in chimeras by immunoglobulin G (IgG) control antibody IP (Figure 2F). For cell-type-selective sncRNA:target RNA profiling, we detect tAgo2 using an anti-myc tag antibody (clone 9B11, Cell Signaling) which immunoprecipitated tAgo2 more effectively than other tested anti-myc antibodies (clones 4A6 ]Millipore Sigma], 9E10 [Abcam], and 9E10.3 [Invitrogen]) (Figure 2G).
Intermolecular ligation of sncRNA:target RNA interactions
To facilitate the intermolecular ligation of the 5′ end of the target RNA to the 3′ end of the miRNA (5′-miRNA-mRNA-3′, called “miRNA-first”) associated with Ago, the 5′ end of the target RNA is phosphorylated by a modified T4 polynucleotide kinase (T4 PNK 3′ phosphatase minus) that lacks the 3′ phosphatase activity, which favors the intermolecular ligation occurring in the 5′-miRNA-mRNA-3′ orientation and not the 5′-mRNA-miRNA-3′ orientation (called “miRNA-last”).4,8,44,45 The predominant miRNA-first orientation aids downstream identification of sncRNAs and target RNAs in sequencing reads. It has also been reported that the miRNA distribution in miRNA-last chimeras does not correlate with general miRNA abundance and that the frequency of seed sites in target sequences is significantly lower than for miRNA-first chimeras.8
The efficiency of intermolecular ligation during CIMERA-seq optimization for a given experimental condition can be monitored using [γ-32P]ATP during the 5′ phosphorylation step to visualize Ago-RNA complexes by autoradiography (Figures 2B–2D). The phosphorylated 5′ end of the target RNA can then be ligated to the 3′ end of the miRNA using a single-stranded RNA ligase (Figure 1, step 5). The efficiency of ligation is enhanced by allowing this step to proceed overnight with additional ATP and ligase supplementation the following morning before several more hours of incubation. To further boost ligation efficiency, molecular crowding by polyethylene glycol (PEG) 8000 is incorporated into this step46,47; this adaptation was not used by several earlier lower-efficiency chimeric RNA preparation protocols.4,8
To enable ligation of adapters required for preparing libraries for sequencing on the Illumina platform, the phosphate group on the 3′ end of the newly generated chimeric RNA is removed using an alkaline phosphatase. The resulting hydroxyl group on the 3′ end of the chimeric RNA is then available for ligation to the 5′ end of a DNA adapter (i.e., the 3′ adapter), which provides an annealing site for a reverse transcription primer and later an indexed PCR primer (Figure 1, step 6). Placement of two random nucleotides at the 5′ end (closest to the site of ligation) of the 3′ adapter, in conjunction with random nucleotides in the 5′ adapter (discussed in subsequent sections), allows PCR duplicates to be distinguished from unique interactions of the same miRNA with the same target RNA fragment (Figure S1). This improved ability to disambiguate PCR duplicates contributes to the downstream semi-quantitative characterization of sncRNA:target RNA profiles. To ensure ligation to the correct end of the chimeric RNA and prevent sequential ligation or circularization of adapters, the adapter is 5′ adenylated (IDT Mod Code:/5rApp/) and capped with a Spacer C3 on its 3′ end (IDT Mod Code:/3SpC3/) (Figure S1). Ligation of this adapter to the 3′ end of the chimeric RNA is achieved with a mutant form of truncated T4 RNA ligase 2 (T4 Rnl2tr K227Q) that ligates the adenylated 5′ ends of DNA or RNA to the 3′ hydroxyl groups of RNA without the need for ATP.48 For robust ligation of the 5′ end of the chimeric RNA to the 5′ adapter in a subsequent step, T4 PNK (not lacking 3′ phosphatase activity) is used to replace the phosphate group that may have been removed previously from the 5′ end of the chimeric RNA.
Ago-RNA complexes are separated from potential nonspecific contaminants by SDS-PAGE (Figure 1, step 7). Complexes representing successful ligation of miRNAs to targets within Argonaute run between 160 and 260 kDa when using Novex Sharp Pre-stained Protein Standard (Invitrogen, LC5800) on NuPAGE 4%–12% Bis-Tris 1.5-mm Mini Protein Gels (Invitrogen, NP0335BOX) with NuPAGE MOPS SDS Running Buffer (Invitrogen, NP0001) (Figure 2D). Transferring to nitrocellulose rather than polyvinylidene fluoride (PVDF) facilitates extraction of RNAs during subsequent proteinase K treatment.49 While higher purity will be achieved including these steps, investigators may choose to omit purification by SDS-PAGE and nitrocellulose transfer, as done previously,50,51 if less than 1 mg starting material is available for IP (Figure 1, step 4), since associated material losses may outweigh benefit for low-abundance samples. Following nitrocellulose transfer, excised membrane pieces (approximately 160–260 kDa) are proteinase K-digested to release bound RNAs (Figure 1, step 8), which are then isolated by phenol/chloroform/isoamyl alcohol extraction to remove proteins; isoamyl alcohol inclusion further inhibits RNases. Chimeric RNAs are isolated in the aqueous phase and subjected to ethanol precipitation in preparation for sequencing library construction.
Sequencing library construction
To enable PCR amplification and sequencing on the Illumina platform, an RNA adapter (i.e., the 5′ adapter) is ligated to the 5′ end of the chimeric RNA using T4 RNA ligase 1 (Figure 1, step 9); molecular crowding with PEG 8000 enhances reaction efficiency. Similar to the 3′ adapter, the 5′ adapter contains four random nucleotides at the 3′ end that is ligated to the chimeric RNA to further facilitate distinguishing PCR duplicates from unique interactions of the same miRNA with the same target RNA fragment (Figure S1). In Figure S1, we depict the use of four random nucleotides (pink); however, more than four random nucleotides may be optimal to alleviate low initial nucleotide diversity, which can reduce the number of sequencing clusters analyzed and negatively impact read depth on sensitive platforms (further discussed in a companion STAR Protocols paper). The combination of four random nucleotides in the 5′ adapter and two random nucleotides in the 3′ adapters allows for 46 (4,096) possible unique interactions of the same miRNA and target RNA fragment to be detected and enhances quantitation by CIMERA-seq. The 5′ adapter is additionally modified with an inverted dideoxythymidine cap on its 5′ end (IDT Mod Code:/5InvddT/) to prevent 5′ ligation (Figure S1). The cDNA library is generated by reverse transcription using a primer annealing to the ligated 3′ adapter (Figure 1, step 10). Efficient reverse transcription is catalyzed by a highly processive mutant of the Moloney murine leukemia virus (M-MLV) reverse transcriptase (SuperScript IV [Invitrogen, 18091050]). The resulting single-strand cDNA library contains the miRNA-target chimeras flanked by 5′ and 3′ adapters with random nucleotides adjacent to the chimera (Figure S1). In our experience, optimization of this step indicated that 80 nmol of 3′ adapter and of 5′ adapter were sufficient for effective library construction for 8 mg of mouse forebrain homogenates. Adjust the adapter amount relative to the amount of starting material, as excessive adapters can generate adapter dimers and take up sequencing depth.
The amount of cDNA library to use in library amplification for sequencing is impacted by the initial sample starting material, preparatory efficiency, and the desired library yield. Generally, using the highest amount of cDNA library per sample for this step is preferable to maintain library diversity and reduce bias by minimizing the required number of PCR amplification cycles. Library overamplification could impair its diversity and semi-quantitative nature, since excessive amplification of duplicate reads will restrict the sequencing depth for identifying potential unique reads. The optimal number of PCR cycles for a given library amplification is the number of cycles that results in sufficient product while leaving 50%–75% unused primers52 so that primers are not limiting, which can generate artifacts from PCR products priming themselves. To determine the optimal cycle number, a trial serial dilution is set up from the reverse transcription reaction in which each dilution corresponds to an equivalent number of PCR cycles (Figure 1, step 11). For example, a PCR reaction starting with one-fourth of the total cDNA library is an equivalent of two fewer PCR cycles than amplifying the total amount of cDNA library (1/4 = 1/22). The cDNA dilutions are amplified by PCR and run on a gel to calculate the percentage of unused primer (Figure 2H). Since the primers used for library amplification have significant overhangs (Figure S1), a two-step PCR is used in which the first five cycles occur at a lower annealing temperature (56°C) and the remaining PCR cycles occur at a higher annealing temperature (65°C). Once the optimal PCR cycle number is determined, the remaining cDNA library is amplified using a common forward primer and an indexed reverse primer that is compatible with the Illumina platform (Figure 1, step 12). Using different indexed primers for each sample allows libraries to be pooled and run on the same flow cell to reduce sequencing biases that may arise from sequencing libraries on different lanes or flow cells.
PCR products are then size selected by agarose gel separation (Figure 1, step 13). Since the length of target RNA fragments incorporated into each chimera varies due to differential degradation during the RNase step, libraries will appear as a smear up the gel. Assuming approximately 20 bases each for the miRNA and target RNA fragment, the expected PCR product size is >165 bp (Figure 2I). If the intermolecular ligation was ineffective and miRNAs and/or target RNA fragments were individually ligated to 5′ and 3′ adapters, there may exist corresponding cDNAs in the library of ∼145 bp that correspond to these fragments (Figure 2J). We recommend cutting from 160 bp to 300 bp to isolate libraries and to remove primer/adapter dimers (which may cluster efficiently on flow cells, allowing even low amounts to significantly impact sequencing data output) (Figure 2I). Size-selection and elution steps may alternatively be done using an automated system (e.g., BluePippin or PippinHT), if available. After the size-selected libraries are excised from the agarose gel, the cDNA is eluted and isolated by phenol-chloroform extraction (Figure 1, step 14).
Determining the optimal depth of sequencing can maximize identification of unique miRNA:target RNA interactions while maintaining reasonable cost and data output. To assist in this determination, saturation curves are generated from trial sequencing data by plotting the number of reads against the number of unique alignments and observing where the curve begins to plateau, indicating saturation.53 If abundant sequencing reads from adapters or PCR primers are present in sequencing data, measures to reduce contaminants such as titrating adapters/primers or increased stringency in gel-size selection of PCR products will also increase the sequencing depth of chimeric sncRNA:target RNAs. Bulk sequencing for sncRNA and mRNA from RNA reserved from the initial sample should be conducted in parallel to allow comparisons of sncRNA and target mRNA abundances with their abundance in sncRNA:target RNA chimeras.
Identification of Ago-bound sncRNA:target RNA interactions in mouse forebrain
We carried out CIMERA-seq on four individual age- and sex-matched mouse forebrain samples to produce genome-wide libraries of regulatory sncRNA:target RNA interactions. Custom sequencing libraries were prepared as described in preceding sections, multiplexed, and sequenced by 150-bp paired-end sequencing with a read depth of 61–138 million reads per sample (Illumina HiSeq X, NovaSeq), and chimeric RNA-sequencing (RNA-seq) data were analyzed using SCRAP.54 A comparison of read coverage per detected peak (user-defined in SCRAP as three or more reads in two or more libraries, discussed below) from chimeric RNA-seq data showed a strong correlation across samples (Figure S2A), reflecting high reproducibility. A comparison of efficiency of the presented strategy for obtaining reads for chimeric sncRNA:target RNA interactions relative to prior published approaches indicates significantly enhanced efficiency, for example, a roughly 3-fold enhancement in detection of sncRNA:target RNA interactions (6.59% of sequencing reads were from chimeric RNAs in CIMERA-seq compared with 2.24% of reads reported in an earlier strategy8,10) (Figure 2K). In addition, we compare CIMERA-seq performance to the widely utilized bioinformatic prediction tool, TargetScan55,56 (Figure S2B) using transcriptomes from our companion bulk RNA-seq datasets as input. Given that not all miRNAs within the TargetScan algorithm are expressed in forebrain, a balanced comparison is performed by assessing target genes of a candidate miRNA, miR-124. In two distinct sample comparisons (Figure S2B), we observe that ∼31%–36% of miR-124:target RNA interactions detected by CIMERA-seq are shared as TargetScan predictions (Figure S2B). Note that multiple miR-124 binding sites may be detected for a single gene target by CIMERA-seq, but for the purposes of this comparison we count each gene target only once, whether or not multiple site interactions occur. Based on total transcriptomes across datasets, the number of TargetScan predicted miR-124 target gene interactions was 3,326, while CIMERA-seq detected miR-124 interactions with 4,443 target genes.
All CIMERA-seq steps and sequencing were carried out on control samples using matched mouse IgG for IP (Table S1). With a sequencing depth of ∼100 million reads, experimental samples (Ago or tAgo CIMERA-seq) have more than 10,000 unique alignments after deduplication and filtering out of pre-miRNAs, tRNAs, rRNAs, and primer dimers using SCRAP. In contrast, IgG control samples have fewer than 1,000 unique alignments (Table S1) and, following peak calling, IgG control samples have significantly fewer high-confidence miRNA:target RNA interactions than experimental samples (Tables S4, S5, and S6). The interactions remaining in IgG control samples were mostly rRNA contamination (Table S6).
Analysis of sncRNA:target RNA sequencing data using SCRAP permits assessment of “peaks,” which are defined by filtering of read coverage to identify regions in which multiple reads from a particular sncRNA or sncRNA family bind to the same target site in multiple libraries (i.e., samples). Peak calling using SCRAP also enables the detection of multiple interactions within proximity.54 It allows for the identification of multiple binding sites for the same sncRNA (or sncRNA family) on a single target transcript, as well as identification of multiple sncRNAs that can alternatively bind to the overlapping same site. This is illustrated for miR-124-3p, miR-9-3p, and miR-26a-5p on 3′ UTR in MAP2 (Figure S2C).54 Peak calling aids in identifying consistently targeted regions of the genome, in searching for sncRNA binding motifs, and in making comparisons across sample libraries. The stringency variables required for peak calling in SCRAP are adjustable, by increasing either the number of sequencing reads or the number of sequencing libraries required to define a peak. As the stringency of peak calling increased (by increasing the number of reads or libraries required to identify a peak), the proportion of interactions occurring within mRNA 3′ UTR or coding sequences also increased (left to right, Figure S2D). In contrast, the proportion of reads mapping to intronic genome reads declined with increasing peak-calling stringency (left to right, Figure S2D). These findings support the use of peak calling to define sncRNA:target RNA interactions from samples with priority for further investigation.
While miRNA interactions with mRNA 3′ UTRs fit the traditional view of RISC action, interactions outside 3′ UTRs that are well supported by peak calling are also observed; such noncanonical interactions have been reported by others using direct sncRNA:target RNA ligation approaches.8,10 The prevalence of reads mapping to genome regions currently annotated as intronic, particularly with lower applied stringency in peak calling, may be contributed to by the relative abundance of intronic (37.7%) regions relative to exons (3.4%) across the transcriptome.57 Additionally, Ago has characterized functions in cellular nuclei, with access to pre-mRNAs containing introns,58 and has been shown to localize to nuclei in quiescent neuronal stem cells.59
Target RNA regions in detected sncRNA:target RNA interactions were enriched for the canonical seed sequence (6-mer) matches to their cognate miRNAs when identified peaks were expanded by 15 bases in either direction. Increasing peak-calling stringency yielded a higher percentage of binding sites containing target seed matches to the cognate miRNAs, as shown for miR-124 (Figure S2E) and let-7 family miRNAs (Figure S2F). While the presence of the cognate binding motif is a validating feature of detected interactions, consistent with prior analyses, many interactions appeared to lack canonical seed matches as has been previously observed.8,10
While miRNAs are well-studied components of the RISC, reports have suggested other sncRNAs, such as tRNA fragments (tRFs), as potentially also functioning to regulate post-transcriptional gene expression.60,61,62,63,64,65,66,67 Here, interactions between regulatory sncRNAs and target RNAs were assessed using SCRAP to map chimeric reads to sncRNA reference databases for miRNAs (miRBase or MirGeneDB 2.1)68 or tRFs.69 Mapping revealed that the majority of chimeric reads from the forebrain were miRNA-containing (99.99997%, 246,173 chimeras across all four libraries), while few contained apparent tRFs (0.00028%, 7 across all four libraries) (Table S4). This result implies that, at least in these mouse forebrain samples, tRFs do not frequently participate in captured Ago-associated interactions within the RISC.
Given that RISC-mediated repression can lead to target mRNA degradation, the validity and functional significance of interactions detected by CIMERA-seq was evaluated by comparing the chimeric RNA-seq read numbers for a given mRNA with the abundance of that mRNA by bulk sequencing reads from the same forebrain sample (Figure 3A). Modest correlations (R = 0.21 and 0.29; Figure 3A, left and right panels) were observed between the abundance of a gene within chimeric RNAs generated by CIMERA-seq and the abundance of the gene transcript in bulk RNA-seq, using two forebrain samples as examples. Notably, when this correlation is restricted to comparing only genes highly targeted by RISC, by selecting the top 50 genes identified in CIMERA-seq following peak calling, the correlation with transcript abundance by bulk sequencing is significantly lower (R = 0.03 and 0.19; Figure 3B, left and right panels). This supports the validity of CIMERA-seq in reporting gene repression through RISC, as more highly targeted mRNA transcripts (higher chimeric RNA reads) would be anticipated overall to have lower total transcript abundance in bulk sequencing and, thus, a lower R. The top 20 transcripts most targeted by sncRNAs are listed in Table 1. The relative targeting of transcripts is assessed by normalizing transcript counts per million (CPM) within chimeric RNAs generated by CIMERA-seq to transcript CPM in bulk RNA-seq.
Figure 3.

Identification of AGO-bound sncRNA:target RNA interactions
(A) Correlation matrix scatterplot between all gene counts obtained from CIMERA-seq (deduplicated chimeric sequencing reads per gene, x axes) and bulk RNA-seq (sequencing reads per gene, y axes); n = 3,232 (genes with counts greater than 0) for example sample 1, n = 4,846 for example sample 2.
(B) Correlation matrix scatterplot between the top 50 gene counts obtained from CIMERA-seq (deduplicated chimeric sequencing reads per gene) and bulk RNA-seq (sequencing reads per gene, y axes) following analysis with SCRAP and mapping to the nuclear genome with Genome Reference Consortium Mouse Build 38 (mm10).
(C) Pie chart depicting the distribution of sncRNAs (individual sncRNAs or miRNA families) detected in small-RNA-seq data from forebrain lysates. Top ten sncRNAs/families are shown, with remainder combined and labeled as “other.” Data labels reflect fraction for each sncRNA/family in CPM across all samples.
(D) Pie chart depicting the distribution of sncRNAs (individual sncRNAs or miRNA families) detected in the CIMERA-seq data from forebrain lysates. Top ten sncRNAs/families are shown, with remainder combined and labeled as “other.” Data labels reflect fraction for each sncRNA/family in CPM across all samples.
Table 1.
Top 20 target transcripts captured by CIMERA-seq
| Transcript | CPM in forebrain CIMERA-seq | CPM in forebrain bulk RNA-seq | Normalized CPM |
|---|---|---|---|
| Pcdh9 | 457.2111498 | 0.8073537 | 566.3083596 |
| Adgrb3 | 143.7933371 | 0.40367685 | 356.2090247 |
| Atp1a3 | 129.155692 | 0.40367685 | 319.9482258 |
| Map2 | 248.8399666 | 0.8073537 | 308.2167908 |
| Gria3 | 121.4063505 | 0.40367685 | 300.7513322 |
| Hmgcs1 | 111.0738951 | 0.40367685 | 275.1554742 |
| Dlg2 | 279.8373327 | 1.211030551 | 231.0737186 |
| Apc | 91.27002236 | 0.40367685 | 226.0967462 |
| Sptan1 | 90.40898441 | 0.40367685 | 223.9637581 |
| Kcnip4 | 439.1293529 | 2.018384251 | 217.5647935 |
| Kmt2a | 86.96483263 | 0.40367685 | 215.4318054 |
| Ank2 | 362.4969756 | 2.018384251 | 179.5976041 |
| Gja1 | 72.32718753 | 0.40367685 | 179.1710064 |
| Sema6d | 69.74407369 | 0.40367685 | 172.7720419 |
| Emc10 | 69.74407369 | 0.40367685 | 172.7720419 |
| Pde10a | 68.0219978 | 0.40367685 | 168.5060656 |
| Lingo2 | 67.16095985 | 0.40367685 | 166.3730774 |
| Dst | 66.2999219 | 0.40367685 | 164.2400892 |
| Fads1 | 61.13369422 | 0.40367685 | 151.4421602 |
| Phactr1 | 219.5646764 | 1.614707401 | 135.977996 |
Interestingly, the distribution of sncRNAs (individual sncRNAs or miRNA families) in bulk small RNA-seq data (Figure 3C) differs from sncRNAs found in CIMERA-seq data (Figure 3D). This distinction could represent a biological phenomenon in which selection of sncRNA incorporation into the RISC is less related to the sncRNA abundance than to some other feature, such as target composition, the biochemistry of the sncRNA:target RNA interaction, or the subcellular localization of constituents. In some contexts, it has been suggested that levels of Ago protein are limiting70,71 and may not fully incorporate highly abundant sncRNAs. In addition, an apparent difference between sncRNA abundance within detected chimeras and bulk sequencing could be contributed to by biases in small RNA-seq library preparation protocols.72
The most abundant sncRNAs in chimeric sncRNA:target RNA sequencing reads across all forebrain samples were miR-124, miR-9, and multiple members of the let-7 miRNA family (let-7a-5p, let-7b-5p, let-7c-5p, let-7d-5p, let-7e-5p, and let-7f-5p) (Figure 3D). The abundance of sncRNAs predominating in sncRNA:target RNA interactions resembles, but does not directly mirror, the abundance of sncRNAs identified by small RNA-seq of the same input samples (Figures 3C and 3D). For example, while miR-124-3p is the most abundant sncRNA in chimeric RNA-seq data (Figure 3D), it is not among the ten most abundant sncRNAs/families in small RNA-seq data (Figure 3C). Conversely, while miR-127-3p is one of the most abundant sncRNAs/families in small RNA-seq data (Figure 3C), it is not among the ten most abundant sncRNAs/families in chimeric RNA-seq data (Figure 3D). This example highlights the value of unambiguous approaches to directly characterize sncRNA:target RNA interactions rather than reliance on predictive algorithms.
Collectively, our findings indicate that this optimized CIMERA-seq approach supports the detection of functional sncRNA:target RNA interactions and can generate results that are consistent with the expanded sncRNA-target pairing rules reported in previous chimeric sncRNA-target ligation strategies.8,10,20,56,73 Leveraging the low sample input requirements of the efficient CIMERA-seq approach, we developed a strategy to permit cell-type-selective genome-wide characterization of sncRNA:target RNA interactions.
Development of cell-type-selective profiling of sncRNA:target RNA interactions in mouse forebrain
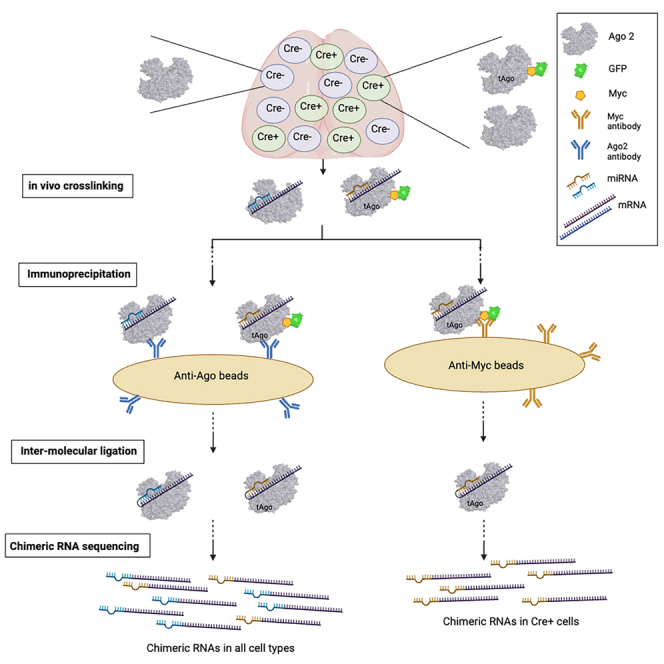
Single-cell sequencing technologies have advanced how we understand the regulation of gene expression, particularly in environments with high cellular heterogeneity such as the nervous system. However, while single-cell approaches permit the bulk sequencing of many robustly expressed transcripts, they often do not provide sufficient material for current strategies to characterize genome-wide sncRNA:target RNA interactions. In addition, cell-selective sorting approaches to generate bulk material may be disruptive to the endogenous cellular context. The potential insights to be gained through cell-type-selective sncRNA:target RNA profiling motivated our development of a strategy that incorporates the powerful Cre-Lox genetic system, allowing the selection of specific, well-established Cre recombinase mouse lines to generate versatile cell-type selectivity by investigators. We couple the Cre technology with a mouse line harboring GFP-myc tagged Ago2 (tAgo2) in the Rosa26 locus, which can be conditionally expressed by recombination of a loxP-flanked STOP fragment, Lox-STOP-Lox:GFP-myc-Ago2 (LSL-tAgo2, JAX strain #017626)24 (Figure 4A). Additionally, temporal specificity can be achieved through the use of a strain expressing tamoxifen-inducible Cre recombinase (CreERT2) for conditional recombination.
Figure 4.

Cell-type-selective profiling of sncRNA:target RNA interactions in vivo
(A) Schematic of Cre-Lox genetic system allowing 4-hydroxytamoxifen (4-OHT)-inducible cell-type-selective expression of a tagged Argonaute 2. The LoxP-STOP-LoxP GFP-myc-Ago2 transgene (LSL-tAgo2)24 allows expression of Ago2 with N-terminal GFP and myc tags selectively in cells expressing Cre recombinase. The CreERT2 gene is under the control of CaMKIIα regulatory elements to direct expression in forebrain excitatory neurons.
(B) Immunoblot detection of tAgo2 in forebrain lysates from mice treated with or without 4-OHT administration. An additional control lane (left) contains lysates from a mouse lacking both transgenes. IP and immunoblotting are both performed using anti-myc antibody (9B11, Cell Signaling 2276).
(C) Correlation matrix scatterplot showing the high correlation (R = 0.9791) between sncRNA counts obtained from forebrain CIMERA-seq immunoprecipitated with anti-Ago2 antibody (2D4, Wako 018-22021) and excitatory-neuron-selective CIMERA-seq immunoprecipitated with anti-myc antibody (9B11, Cell Signaling 2276). Each dot represents one sncRNA found in both forebrain and excitatory-neuron datasets from respective CIMERA-seq experiments. n = 98 (sncRNAs with counts >0), normalized as CPM.
(D) Correlation matrix scatterplot showing the correlation (R = 0.5459) between the counts of target genes in sncRNA:target RNA interactions obtained from forebrain CIMERA-seq and excitatory-neuron-selective CIMERA-seq. Each dot represents one target RNA found in both forebrain and excitatory-neuron datasets from respective CIMERA-seq experiments. n = 1,520 (genes with counts >0 after peak calling), normalized as CPM.
To express tAgo2 in predominantly excitatory neurons of the adult forebrain, LSL-tAgo2 mice were crossed with a well-characterized mouse line in which the calcium/calmodulin-dependent protein kinase II alpha (CaMKIIα) promoter regulatory elements drive CreERT2 expression to generate the CaMKIIα-CreERT2/LSL-tAgo2 system,24,74 which was bred to LSL-tAgo2 homozygosity. Use of the CreERT2 system offers the additional advantage of titrating tamoxifen to achieve the desired expression level of tAgo2. 4-Hydroxytamoxifen (4-OHT, 2 mg) was administered to 8- to 9-week-old male mice by intraperitoneal injection once per day for 5 days. Gene induction was allowed to occur for 14–21 days after the final injection prior to tissue harvest. Sufficient tAgo2 expression was observed in CreERT2-positive mice 14–21 days after the final 4-OHT injection, with little uninduced (leaky) expression detected in CreERT2-positive mice not receiving 4-OHT (Figure 4B). Additionally, no expression of tAgo2 was observed in CreERT2-negative mice when treated with 4-OHT (Figure S3).
Selective profiling of RISC interactions from forebrain excitatory neurons
We carried out representative paired total forebrain and forebrain excitatory neuron cell-selective CIMERA-seq using three individual age- and sex-matched mouse forebrains to produce genome-wide libraries of sncRNA:target RNA interactions. For each mouse, left hemispheres were subjected to total forebrain sncRNA:target RNA interaction profiling with anti-Ago2 IP, while right hemispheres were subjected to forebrain excitatory-neuron-selective sncRNA:target RNA interaction profiling using anti-myc IP of tAgo2. We find that cell-type-selective CIMERA-seq can be successfully carried out starting from ≤1 mg of protein lysate from the murine nervous system; a fraction of this protein would be from cells expressing the tAgo2. The lysate input requirement for other tissues might vary depending upon the number of cells expressing tAgo2 in the lysate and the expression level of the tagged Ago2 in those cells. While data on the quantity of lysate input is frequently unavailable from previously published total Ago2 CLIP strategies, this approach likely represents an advancement in efficiency, since similar strategies in C. elegans used 1–3 mg lysate input for total Ago210 or an estimated 5.6 mg of HEK 293T protein lysate.4
Endogenous Ago2:RNA and tAgo2:RNA complexes were crosslinked and purified with custom sequencing libraries prepared as described above. Libraries were multiplexed and subjected to 150-bp paired-end sequencing with a read depth of 61–138 million reads per library (NovaSeq X plus, Illumina), followed by analysis including peak calling using SCRAP.54,75 Within-sample type comparisons of sncRNA:target RNA interactions in peaks for either total forebrain Ago2 libraries or paired excitatory-neuron-selective tAgo2 libraries showed a high degree of correlation for read counts (abundance) of both the targeting miRNAs (R = 0.99, 0.99, 0.99 for forebrain Ago2, Figure S4A, upper panel; R = 0.99, 0.99, 0.99 for excitatory neuron tAgo2, Figure S4A, lower panel) as well as the targeted RNAs (R = 0.93, 0.93, 0.98 for total Ago2, Figure S4B, upper panel; R = 0.69, 0.69, 0.70 for neuronal tAgo2, Figure S4B, lower panel). The abundance of individual sncRNAs within sncRNA:target RNA interaction peaks also showed a high degree of correlation (R = 0.98, Figure 4C) in cross-comparisons of forebrain CIMERA-seq libraries and paired excitatory-neuron-selective CIMERA-seq libraries. In contrast, the abundance of individual target genes within sncRNA:target RNA interactions generated by CIMERA-seq and those generated by the paired neuron-selective CIMERA-seq showed only modest correlation (R = 0.55, Figure 4D). This finding is consistent with a shared sncRNA:target RNA profile in which the interactions in neurons (isolated by the cell-type-selective approach) are also found within the broader mixture of the forebrain RISC sncRNA:target RNA profile.
The most abundant sncRNAs found in both the total forebrain and forebrain excitatory-neuron-selective sncRNA:target RNA interactions from CIMERA-seq were all miRNAs. The miRNAs predominating in forebrain CIMERA-seq (Figure 5A and Table S2) resembled, but did not directly mirror, the abundance of miRNA from the excitatory neurons (Figure 5B and Table S3). For example, miR-124-3p, miR-29-3p family (miR-29a,b,c), miR-9-5p, let-7 family miRNAs, miR-128-3p family (miR-128a,b), miR-26-3p, and miR-22-3p were among the top ten miRNAs identified from both forebrain and paired excitatory-neuron-selective CIMERA-seq datasets. However, relative contributions to miRNA:target RNA interactions slightly differed. The miR-125-5p family and miR-9 were only present in the forebrain CIMERA-seq top ten miRNAs, while miR-138-5p, miR-127-3p, and miR-24-3p were only present in excitatory-neuron-selective top ten interacting miRNAs. miR-124-3p and miR-29-3p were the two most abundant interactors from both forebrain and excitatory-neuron-selective CIMERA-seq, with miR-124-3p and miR-29-3p contributing to a total of 49.3% of the sncRNA:target RNA interactions in forebrain CIMERA-seq and to a total of 59.9% in excitatory-neuron-selective CIMERA-seq. To further assess differences in the miRNAs targeting transcripts in total forebrain compared to excitatory-neuron-selective CIMERA-seq, we evaluated miRNAs for differential enrichment (DESeq2,76 p value <0.05, fold change >2.0) in excitatory-neuron-selective CIMERA-seq relative to whole forebrain CIMERA-seq (Figure 5C). The most abundant sncRNAs differentially enriched in excitatory-neuron-selective CIMERA-seq interactions included miR-128-3p, four let-7 family miRNAs, miR-29b-3p, miR-127-3p, miR-744-5p, miR-29a-3p, and miR-328-3p. Notably, neuronal functions have been previously ascribed to these miRNAs. miR-128-3p has been reported to play critical roles in synaptogenesis, neuronal outgrowth, and excitability,77,78 while let-7 family miRNAs, miR-29, and miR-744 are essential regulators in neuronal development, synapse formation, and brain maturation.79,80,81,82,83
Figure 5.

Differential enrichment of sncRNAs and excitatory-neuron-enriched genes in excitatory-neuron-selective CIMERA-seq
(A) Pie chart depicting the distribution of sncRNAs (individual sncRNAs or miRNA families) detected in chimeric RNAs from total forebrain CIMERA-seq data from forebrain lysates of LSL-tAgo2 + 4-OHT mice that were immunoprecipitated with anti-Ago2 antibody. Fractions for the top ten most abundant sncRNAs/families are individually labeled, with the remaining sncRNAs combined and labeled as “other.” Data labels reflect fraction for each sncRNA/family in CPM across all samples.
(B) Pie chart depicting the distribution of sncRNAs (individual sncRNAs or miRNA families) detected in chimeric RNAs from excitatory-neuron-selective CIMERA-seq data from forebrain lysates of LSL-tAgo2 + 4-OHT mice that were immunoprecipitated with anti-myc antibody (9B11, Cell Signaling 2276). Fractions for the top ten most abundant sncRNAs/families are individually labeled, with the remaining sncRNAs combined and labeled as “other.” Data labels reflect fraction for each sncRNA/family in CPM across all samples.
(C) Volcano plot depicting preferential enrichment and depletion of sncRNAs from excitatory-neuron-selective CIMERA-seq relative to total forebrain CIMERA-seq. sncRNAs that are significantly depleted in excitatory-neuron-selective CIMERA-seq are plotted in red, and sncRNAs that are significantly enriched in excitatory-neuron-selective CIMERA-seq are plotted in blue. The top ten most significantly depleted and enriched sncRNAs are labeled.
(D) The percentage of total reads across all samples for the top ten target genes detected in forebrain CIMERA-seq and the fraction for their respective top five miRNA binding partners.
(E) The percentage of total reads across all samples for the top ten target genes detected in forebrain excitatory-neuron-selective CIMERA-seq and the fraction for their respective top five miRNA binding partners.
In contrast to the similarities in profiled miRNAs, the distribution of the top ten targeted transcripts in forebrain CIMERA-seq, along with their miRNA binding partners (Figure 5D), appeared markedly different from those in the paired excitatory-neuron-selective CIMERA-seq (Figure 5E). For example, while Ids was the most abundantly targeted gene in forebrain CIMERA-seq, it was not among the ten most abundantly targeted genes in forebrain excitatory-neuron-selective CIMERA-seq. Overall comparison of the most abundant sncRNA:target RNA interactions captured by total forebrain compared to excitatory neuron cell-type-selective CIMERA-seq followed by peak calling revealed extensive differential targeting in these compartments (Tables S2 and S3). As expected, since the IP of total Ago2 also encompasses the tagged Ago expressed in excitatory neurons, some interactions were captured in both datasets but with differing relative abundance (Tables S4 and S5). Differential patterns of targeted transcripts in the forebrain relative to excitatory-neuron-selective CIMERA-seq were also consistently observed when the targets of the top ten most abundant miRNAs were evaluated (Tables S2 and S3). For example, while interaction with Camk2a contributed to 7.32% of the total miR-124-3p interactions in excitatory-neuron-selective CIMERA-seq (Table S3), this interaction contributed to just 0.79% of miR-124-3p interactions in forebrain CIMERA-seq (Table S3). Nonetheless, miR-124-3p interaction with Ids, Camk2a, Pcdh1, and MAP2, as well as miR-22-3p interaction with Camk2n1, appeared among the top sncRNA:target RNA interactions captured by both forebrain and excitatory-neuron-selective CIMERA-seq. To further test the validity of excitatory-neuron-selective CIMERA-seq, we compared the target genes captured within chimeric RNAs generated by either global forebrain or excitatory-neuron-selective CIMERA-seq to a repository containing genes exhibiting enriched expression in excitatory neurons.84 A large portion (27.7%) of target genes captured by excitatory-neuron-selective CIMERA-seq was documented as excitatory-neuron-enriched genes and possessed an average of approximately 1,500 read counts (CPM) per gene. In comparison, genes from the excitatory-neuron-enriched repository constituted only 12.4% of the target genes captured by total forebrain CIMERA-seq and had an average of 200 read counts (CPM) per gene (Figure 6A). Collectively, these findings support the view that the developed strategy for cell-selective profiling of sncRNA:target RNA interactions can efficiently capture and enrich desired cell-type profiles relative to bulk profiling in a given sample, in this case for excitatory neurons relative to total forebrain.
Figure 6.

Pathway analysis for target genes enriched in cell-selective CIMERA-seq compared with total forebrain CIMERA-seq
(A) Violin plot depicting the distribution of genes from a repository with enriched excitatory-neuron expression (gray dots) across the sncRNA:target RNA chimeras from total forebrain CIMERA-seq data compared to excitatory-neuron-selective CIMERA-seq.
(B) Gene Ontology (GO) enrichment analysis for biological processes preFcsenting the top ten GO terms for target genes enriched in excitatory-neuron-selective CIMERA-seq compared to forebrain CIMERA-seq. x axis is enrichment score; dot size represents the number of genes; color bar indicates p value.
(C) GO enrichment analysis for cellular components presenting the top ten GO terms for target genes enriched in excitatory-neuron-selective CIMERA-seq compared to forebrain CIMERA-seq. x axis is enrichment score; dot size corresponds to the number of genes; color bar indicates p value.
(D) GO enrichment analysis for molecular function presenting the top ten GO terms for target genes enriched in excitatory-neuron-selective CIMERA-seq compared to forebrain CIMERA-seq. x axis is enrichment score; dot size corresponds to the number of genes; color bar indicates the p value. p < 0.05 was used to select GO terms.
To probe potential higher-order functions of the captured sncRNA:target RNA interactions, we performed Gene Ontology (GO) enrichment analysis on the target genes captured in excitatory-neuron-selective CIMERA-seq relative to those captured in global CIMERA-seq (Figures 6B–6D). Enrichment scores (Figures 6B–6D; clusterProfiler85) were calculated based on the GO terms for target genes enriched in the forebrain excitatory-neuron-selective interactions relative to the total forebrain interactions with application of a hypergeometric test (−log10 of p value) in SRplot.86 GO function analysis was subdivided into three groups: biological process (Figure 6B), cellular component (Figure 6C), and molecular function (Figure 6D); only significant GO terms (p value <0.05) were considered. This analysis revealed that genes with significantly higher miRNA targeting in excitatory neurons were enriched for association with biological functions and cellular components related to synapse growth and organization, and synaptic vesicle cycling (Figures 6B and 6C). At the molecular level, transcripts with excitatory-neuron-enriched targeting cluster into components involved in calcium and glutamate receptor signaling and transmembrane transporters (Figure 6D). These results are consistent with appropriate gene enrichment in excitatory neurons but also indicate tight post-transcriptional gene regulation through RISC for critical synaptic communication and neuroplasticity functions.
Discussion
CIMERA-seq represents a cohesive and optimized method for unambiguously characterizing the in vivo network of sncRNA:target RNA interactions in numerous biological and cellular contexts by the generation and sequencing of sncRNA:target RNA chimeras. The outlined steps permit efficient characterization of sncRNA:target RNA profiles from low-abundance samples, such as cell-type-selective or subcellular fractions. The presented method includes significant optimizations and enhancements to increase the efficiency of obtaining unique sncRNA:target RNA chimeras, which can be appreciated when the percentage of deduplicated reads representing unique sncRNA:target RNA chimeras is compared between CIMERA-seq and previously published methods analyzed using SCRAP (Figure 2K).54,75 The increased efficiency allows for a deeper assessment of sncRNA:target RNA profiles and is a particular advantage with low amounts of starting material. Genome-wide and cell-selective CIMERA-seq enhance researchers’ ability to study the distinct roles of sncRNAs in mediating post-transcriptional gene regulation in diverse model systems and tissue types.
Several published advances in CLIP methods that increase the efficiency of generating libraries for sequencing have been incorporated into the development of CIMERA-seq. While generic CLIP methods do not include an intermolecular ligation step, as in CIMERA-seq, steps such as IP of RNA binding proteins, isolation of RNAs from protein complexes, and size selection of cDNA libraries are shared among many CLIP protocols. Published protocols for enhancing CLIP include optimizations for several shared steps,49 including purification of cDNAs using bead-based methods (Dynabeads MyOne Silane [Invitrogen, 37002D]) as was used in eCLIP.87 In iCLIP2,49 cDNAs are amplified in two PCR reactions with size selection using PreNex beads (Promega, NG2001) after each PCR reaction; the first pre-amplification PCR reaction is intended to mitigate the loss of material during size selection. These adjustments to CLIP methods can enhance the recovery and sequencing of RNAs bound to RNA binding proteins and could be considered as other alternatives for enhancing CIMERA-seq library purification and recovery. In the development of CIMERA-seq, cDNAs produced during reverse transcription were initially purified by ethanol precipitation; in later iterations, particularly with low-input samples for cell-selective approaches, we instead use QIAquick columns (Qiagen) for higher-efficiency recovery. In CIMERA-seq, cDNAs are amplified in a single PCR reaction, with a low cycle number to minimize introduction of bias for quantification. Subsequent library size selection can then be carried out by polyacrylamide gel excision and ethanol precipitation; we increase the efficiency of these steps for low-abundance samples through the substitution of automated library size selection followed, if desired, by library concentration. Elimination of a size-selection step can reduce sample loss with limited starting material50,51 but may also increase contamination by nonspecific nucleic acids, such as ribosomal RNAs, into the sequencing reaction and reads. A discussion about customizing adapters used during library preparation for different sequencing platforms, particularly given the recent switch of Illumina from HiSeq to NovaSeq XPlus, is included in a STAR Protocols companion article.
We demonstrate temporally selective and cell-type-specific sncRNA:target RNA profiling by incorporating a tagged Ago2 with genetically controlled expression. We develop this approach using a mouse line expressing an inducible Cre recombinase (CreERT2) but anticipate that the approach will be suitable for systems in which the Cre is delivered by other means, such as by viral transduction or in tissues outside the nervous system. Introduction of the tagged Ago using viral transduction, in combination with desired promoters, would also allow the cell-selective sncRNA:targetRNA profiling strategy to be applied outside of the mouse genetic system, such as in human cells. Use of the CIMERA-seq strategy also has the potential to be adapted with complementary analyses that would enable broad assessment of how particular binding interactions might impact fundamental aspects of miRNA biology, such as the regulation of miRNA degradation. For example, a combination of CIMERA-seq with approaches assessing transcriptome-wide miRNA half-life could facilitate the identification and validation of new endogenous trigger RNAs and binding interactions impacting target-directed miRNA degradation.88 In conclusion, these optimized approaches can address a growing need for unambiguous understanding of sncRNA interactions with target RNAs, which is independent from the limitations inherent to bioinformatic predictions or bulk RNA-seq. The CIMERA-seq approach presented here can also deliver cell-type-selective insights to enable improved quantitative and qualitative understanding of the complexities of transcript targeting by sncRNAs across different cell types.
Limitations of study
The CIMERA-seq approaches described here are capable of delivering genome-wide profiling of sncRNA:target RNA interactions. A caveat is that the extent of profiling can depend upon the abundance of starting sample inputs. When available sample inputs are quite restricted, the breadth of detection for sncRNA:target RNA interactions in library sequencing may be constrained to high-abundance interactions; in this setting, maximizing recovery of the CLIP samples during processing and library preparation is a critical factor. Although we limited PCR amplification cycles of the sncRNA:target RNAs prior to size selection to minimize potential bias, we note that additional amplification cycles could also be a simple modification to increase detection in the setting of low-abundance sample inputs. In addition, the depth of sequencing coverage of sncRNA:target RNA chimeras in libraries prepared from low-abundance samples is also more impacted by the presence of contaminating RNA species; attention to accurate size-selection purification can address this issue.
STAR★Methods
Key resources table
| REAGENT or RESOURCE | SOURCE | IDENTIFIER |
|---|---|---|
| Antibodies | ||
| Mouse monoclonal anti-Myc tag (9B11) | Cell Signaling Technology | Cat# 2276; RRID: AB_331783 |
| Mouse monoclonal anti-Ago (2D4) | FUJIFILM Wako Pure Chemical Corporation | Cat# 018–22021; RRID: AB_1106838 |
| Mouse monoclonal anti-pan Ago (2A8) | Millipore Sigma | Cat# MABE56; RRID: AB_11214388 |
| Mouse monoclonal IgG1 kappa Isotype Control | Invitrogen | Cat# 14-4714-82; RRID: AB_470111 |
| Chemicals, peptides, and recombinant proteins | ||
| 4-Hydroxytamoxifen | Sigma-Aldrich | Cat# H6278-50MG |
| HBSS, no calcium, no magnesium, no phenol red | Gibco | Cat# 14175103 |
| Magnesium chloride (MgCl2) | Sigma-Aldrich | CAS# 7786-30-3 |
| HEPES | Thermo Scientific | CAS# 7365-45-9 |
| PBS, pH 7.4 | Gibco | Cat# 10010023 |
| IGEPAL CA-630 | Sigma-Aldrich | CAS# 9002-93-1 |
| Sodium deoxycholate | Sigma-Aldrich | CAS# 302-95-4 |
| Sodium dodecyl sulfate (SDS), 20% Solution, RNase-free | Invitrogen | Cat# AM9820 |
| Tris hydrochloride (Tris-HCl) | Sigma-Aldrich | CAS# 1185-53-1 |
| Sodium chloride | Sigma-Aldrich | CAS# 7647-14-5 |
| Glycerol | Sigma-Aldrich | CAS# 56-81-5 |
| Ethylenediaminetetraacetic acid (EDTA), 0.5M, pH 8.0 | Quality Biological | Cat# 351-027-101 |
| TWEEN 20 | Sigma-Aldrich | CAS# 9005-64-5 |
| Tris(hydroxymethyl)aminomethane | Sigma-Aldrich | CAS# 77-86-1 |
| EGTA | Sigma-Aldrich | CAS# 67-42-5 |
| Ammonium acetate | Sigma-Aldrich | CAS# 631-61-8 |
| Magnesium acetate | Sigma-Aldrich | CAS# 16674-78-5 |
| TRIzol | Invitrogen | Cat# 15596026 |
| Halt Protease and Phosphatase Inhibitor Single-Use Cocktail, EDTA-Free (100X) | Thermo Scientific | Cat# 78443 |
| Dynabeads Protein G for Immunoprecipitation | Invitrogen | Cat# 10003D |
| RNaseOUT Recombinant Ribonuclease Inhibitor | Invitrogen | Cat# 10777019 |
| Ambion RNase I, cloned, 100 U/μL | Invitrogen | Cat# AM2294 |
| TURBO DNase (2 U/μL) | Invitrogen | Cat# AM2239 |
| Bicinchoninic Acid solution | Sigma-Aldrich | Cat# B9643-1L |
| Copper (II) sulfate solution | Sigma-Aldrich | Cat# C2284-25ML |
| T4 Polynucleotide Kinase (3′ phosphatase minus) | New England BioLabs | Cat# M0236L |
| ATP, [γ-32P]- 6000 Ci/mmol 10 mCi/ml EasyTide, 250 μCi | PerkinElmer | Cat# BLU502Z250UC |
| T4 Polynucleotide Kinase Reaction Buffer | New England BioLabs | Cat# B0201S |
| ATP Solution (100 mM) | Thermo Scientific | Cat# R0441 |
| T4 RNA Ligase 1 (ssRNA Ligase) | New England BioLabs | Cat# M0204L |
| UltraPure BSA (50 mg/mL) | Invitrogen | Cat# AM2616 |
| T4 RNA Ligase Reaction Buffer | New England BioLabs | Cat# B0216S |
| PEG 8000 (50%) | New England BioLabs | Cat# B1004S |
| T4 RNA Ligase 2, truncated K227Q | New England BioLabs | Cat# M0351L |
| T4 Polynucleotide Kinase | New England BioLabs | Cat# M0201L |
| NuPAGE LDS Sample Buffer (4X) | Invitrogen | Cat# NP0007 |
| NuPAGE MOPS SDS Running Buffer (20X) | Invitrogen | Cat# NP0001 |
| Novex Sharp Pre-stained Protein Standard | Invitrogen | Cat# LC5800 |
| PageRuler Prestained Protein Ladder, 10 to 180 kDa | Thermo Scientific | Cat# 26616 |
| NuPAGE Transfer Buffer (20X) | Invitrogen | Cat# NP0006 |
| Proteinase K | QIAGEN | Cat# 19131 |
| Chloroform | Sigma-Aldrich | CAS# 67-66-3 |
| Phenol:Chloroform:Isoamyl Alcohol 25:24:1, Saturated with 10mM Tris, pH 8.0, 1mM EDTA | Sigma-Aldrich | Cat# P3803-100ML |
| GlycoBlue Coprecipitant (15 mg/mL) | Invitrogen | Cat# AM9515 |
| Betaine solution | Sigma-Aldrich | Cat# B0300-1VL |
| Novex TBE Running Buffer (5X) | Invitrogen | Cat# LC6675 |
| Ultra Low Range DNA Ladder | Invitrogen | Cat# 10597012 |
| 6X TrackIt Cyan/Yellow Loading Buffer | Invitrogen | Cat# 10482035 |
| SYBR Gold Nucleic Acid Gel Stain (10,000X Concentrate in DMSO) | Invitrogen | Cat# S11494 |
| Critical commercial assays | ||
| FastAP Thermosensitive Alkaline Phosphatase (1 U/μL) | Thermo Scientific | Cat# EF0651 |
| SuperScript IV First-Strand Synthesis System | Invitrogen | Cat# 18091050 |
| Phusion High-Fidelity DNA Polymerase | New England BioLabs | Cat# M0530S |
| Qubit 1X dsDNA HS Assay Kits | Thermo Scientific | Cat# Q33230 |
| Deposited data | ||
| Raw and analyzed data | This paper | GEO: GSE263988 |
| Helwak CLASH HEK293 data | Helwak et al.4 | GEO: GSE46039 |
| Moore CLEAR-CLIP HEK293 and mouse data | Moore et al.8 | GEO: GSE73059 |
| Hoefert CLEAR-CLIP mouse data | Hoefert et al.23 | GEO: GSE102716 |
| Experimental models: Organisms/strains | ||
| Mouse: B6Tg(Camk2a-Cre/ERT2) | He et al.24 and Erdmann et al.74 | N/A |
| Mouse: B6.Cg-Gt(ROSA)26Sortm1(CAG−GFP/Eif2c2)Zjh/J | The Jackson Laboratory | JAX: 017626 |
| Oligonucleotides | ||
| 3′ Linker (100 μM): 5′/5rApp/NNTGGAATTC TCGGGTGCCAAGG/3SpC3/ |
Integrated DNA Technologies | N/A |
| 5′ Linker (100 μM): 5′/5InvddT/GUUCAGAG UUCUACAGUCCGACGAUCNNNN |
Integrated DNA Technologies | N/A |
| Reverse Transcription Primer (100 μM): 5′ GCCTTGGCACCCGAGAATTCCA | Integrated DNA Technologies | N/A |
| RNA PCR Primer (RP1): 5′ AATGATACGG CGACCACCGAGATCTACACGTTCAG AGTTCTACAGTCCGA |
Integrated DNA Technologies | N/A |
| RNA PCR Primer, Index N (RPI-N): 5′ CAAG CAGAAGACGGCATACGAGAT NNNNNN GTGACTGGAGTTCCTTGGCACCCGAGAATTCCA |
Integrated DNA Technologies | N/A |
| Software and algorithms | ||
| SCRAP | Mills et al.54 | https://github.com/Meffert-Lab/SCRAP |
| Cutadapt | Martin et al.89 | https://cutadapt.readthedocs.io/en/stable/ |
| hisat2 | Kim et al.90 | https://daehwankimlab.github.io/hisat2/manual/ |
| Samtools | Li et al.91 | https://samtools.sourceforge.net/ |
| Htseq | Anders et al.92 | https://htseq.readthedocs.io/en/master/ |
| Other | ||
| Novaseq X Plus Platform | Illumina | N/A |
| ultraviolet (UV) Stratalinker 2400 | Stratagene | N/A |
| SpeedVac | N/A | N/A |
| Typhoon FLA 9500 Variable Mode Laser Scanner Image Analyzer | GE Healthcare | N/A |
| NuPAGE 4 to 12%, Bis-Tris, 1.5 mm, Mini Protein Gel, 15-well | Invitrogen | Cat# NP0336BOX |
| Novex TBE-Urea Gels, 6%, 15 well | Invitrogen | Cat# EC68655BOX |
| Corning Costar Spin-X centrifuge tube filters | Sigma | Cat# CLS8160-96EA |
| Nitrocellulose | Bio-Rad | Cat# 1620094 |
| Mini Gel Tank | Thermo Scientific | Cat# A25977 |
| ThermoMixer C | Eppendorf | Cat# 2231001005 |
| Protein LoBind Tube 1.5 mL | Eppendorf | Cat# 22431081 |
| BD Luer Slip Tip Syringe sterile, single use, 1 mL | BD | REF# 309659 |
| BD Needle 1 1/2 in. single use, sterile, 21 G | BD | REF# 305167 |
Resource availability
Lead contact
Further information and requests for resources and reagents should be directed to and will be fulfilled by the lead contact, Mollie K. Meffert (mkm@jhmi.edu).
Materials availability
This study did not generate new unique reagents.
Data and code availability
Chimeric RNA-seq data have been deposited at GEO and will be publicly available as of the date of publication. Accession numbers are listed in the key resources table. This paper also analyzes existing, publicly available data. These accession numbers for the datasets are listed in the key resources table.
This paper does not report original code. All chimeric RNA-seq data were analyzed using an updated version of SCRAP,54,75 for which code is deposited at https://github.com/Meffert-Lab/SCRAP.
Any additional information required to reanalyze the data reported in this paper is available from the lead contact upon request.
Experimental model and study participant details
The mouse line with conditional tAgo2 expression in excitatory neurons was generated by crossing B6Tg(Camk2a-Cre/ERT2),24,74 and B6.Cg-Gt(ROSA)26Sortm1(CAG−GFP/Eif2c2)Zjh/J (Jackson Laboratory #017626). Tamoxifen (2 mg) was administered to mice intraperitoneally once per day for 5 days. Gene induction was allowed to occur for 14–21 days after the final injection before tissue harvest. Male mice were harvested at 10–12 weeks old. All animals were housed in a 12-h reverse dark-light cycle at 24°C and variable humidity and received water and food ad libitum. Male mice were used for the experiments reported here, although our laboratory has successfully performed CIMERA-seq experiments in both male and female mice. All procedures related to the care and treatment of animals were approved by the Johns Hopkins Medical Institute Animal Care and Use Committee.
Method details
Solutions
Homogenization buffer is 1X HBSS (Gibco, 14175103) supplemented with 5 mM MgCl2, 10 mM HEPES (pH 7.4) and 1X HALT protease/phosphatase inhibitor (Thermo Scientific, 78443). Lysis buffer composition is 1X PBS (pH 7.4) supplemented with 1% Igepal, 0.5% sodium deoxycholate, 0.1% SDS, 1X HALT protease/phosphatase inhibitor, and 160 U/uL RNaseOUT (Invitrogen, 10777019). RNase I dilution buffer is 10 mM Tris-HCl (pH 8.0), 100 mM NaCl, and 50% glycerol. High salt CLIP wash buffer is 50 mM Tris-HCl (pH 7.4), 1 M NaCl, 1 mM ethylenediamine tetraacetic acid (EDTA), 1% Igepal, 0.5% sodium deoxycholate, and 0.1% SDS. The T4 PNK wash buffer is 20 mM Tris-HCl (pH 7.4), 10 mM MgCl2, and 0.2% Tween 20. The PNK/EDTA/EGTA wash buffer is 50 mM Tris (pH 7.4), 10 mM EDTA, 10 mM EGTA, and 0.5% Igepal. The proteinase K/SDS buffer is 100 mM Tris-HCl (pH 7.4), 50 mM NaCl, 1 mM EDTA, and 0.2% SDS. The gel elution buffer is 10 mM Tris-HCl (pH 8.0), 0.5 mM ammonium acetate, 10 mM magnesium acetate, 1 mM EDTA, and 0.1% SDS.
Tamoxifen administration
4-Hydroxytamoxifen (4-OHT) is dissolved in ethanol at a concentration of 2 mg/100 μL using a sonicator and stored in 100 μL aliquots at −80°C. On the day of injection, 100 μL of peanut oil is added to 100 μL of the tamoxifen-ethanol mixture, vortexed for 3 min, and spun in a SpeedVac for 30 min at 37°C. 4-OHT (2mg per adult mouse) is administered to mice by intraperitoneal injection once per day for 5 days, at approximately the same time each day. Gene induction is allowed to occur for 14–21 days after the final injection before tissue harvest.
Sample harvest and photocrosslinking
Mouse brain tissue in Homogenization buffer is homogenized by 12 passes through a 21G needle. If small or bulk RNA-seq is to be performed, an aliquot of homogenate (∼100 μL) should be reserved into a separate microfuge tube in 1 mL of TRIzol Reagent. UV irradiate homogenates 3x with (4000 μJ/cm2 x 100) on a perfluoroalkoxy (PFA) Petri dish, mixing samples between rounds. Transfer irradiated tissue homogenate to a microfuge tube and centrifuge 900 x g for 5 min at 4°C. Discard supernatant, cell pellets can be stored at −80°C.
Immunoprecipitation
Wash 25 μL bed volume Protein G Dynabeads 2 × 3 min with 1 mL Lysis buffer. Incubate beads with 2 μg antibody in 500 μL Lysis buffer. Anti-Ago2 (2D4, Wako, 018–22021) is used for total CIMERA-seq, or anti-myc (9B11, Cell Signaling, 2276) for cell-selective CIMERA-seq, anti-IgG1 (Invitrogen, 14-4714-82) for negative control. Rotate beads at 4°C for 1 h or until lysate preparation is complete.
Thaw cell pellets on ice and lyse in Lysis buffer by passage through a 21 G needle 12 times. Vortex lysate for 30 s and lyse on ice for 10 min. Incubate lysates with RNase 1 (0.5 U/1 mg protein) and 10 U TURBO DNase at 37°C for 5 min shaking continuously at 1100 rpm (ThermoMixer C). Centrifuge RNase-treated lysates at 16,100 x g for 15 min at 4°C, save supernatant for BCA assay and IP.
Wash beads 3 times with 1 mL Lysis buffer by brief inversion. Transfer equal amounts of lysate to washed beads and rotate at 4°C for 2 h.
Intermolecular ligation
Wash beads 1 × 3 min with 1 mL Lysis buffer, 2 × 3 min with 1 mL high salt CLIP wash buffer, and 2 × 3 min with 1 mL PNK wash buffer. Perform PNK 5′ phosphorylation by adding 5 U T4 PNK (3′ phosphatase minus), 1 mM ATP, and 40 U RNaseOUT in PNK buffer to the beads. Incubate beads at 37°C for 20 min shaking at 1100 rpm (15s, 90s rest; ThermoMixer C). Add another 1 mM ATP and continue incubating at 37°C for 20 min shaking at 1100 rpm (15s, 90s rest), or if radiolabeling use 1.5 μL of γ-32P-ATP (PerkinElmer, BLU502Z250UC).
Wash beads 3 × 3 min with 1 mL PNK wash buffer. Perform intermolecular ligation by adding 62 U T4 RNA ligase 1, 0.1 mg/mL BSA, 1 mM ATP, 100 U RNaseOUT, and 15% PEG-8000 in T4 RNA ligase buffer to the beads. Incubate beads at 25°C overnight shaking at 1100 rpm (15s, 90s rest; ThermoMixer C). Add additional 25 U T4 RNA ligase 1 and 1 mM ATP, continue ligation at 25°C for 5 h shaking at 1100 rpm (15s, 90s rest).
3′ linker ligation
Wash beads 2 × 3 min with 1 mL Lysis buffer, 1 × 3 min with 1 mL PNK/EDTA/EGTA wash buffer, and 2 × 3 min with 1 mL PNK wash buffer. Perform phosphatase treatment by adding 3 U FastAP enzyme and 40 U RNaseOUT in FastAP buffer to the beads and incubate at 37°C for 20 min shaking at 1100 rpm (15s, 90s rest).
Wash beads 2 × 3 min with 1 mL PNK wash buffer. Add 200 U T4 RNA ligase 2, truncated K227Q, 2 mM 3′ linker, 20% PEG-8000, and 40 U RNaseOUT in T4 RNA ligase reaction buffer to the beads. Incubate beads at 4°C for overnight shaking at 1100 rpm (15s, 90s rest).
Wash beads 2 × 3 min with 1 mL PNK wash buffer. Perform 5′ phosphorylation by adding 10 U T4 PNK, 1 mM ATP, and 40 U RNaseOUT in PNK buffer to the beads. Incubate tubes at 37°C for 20 min shaking at 1100 rpm (15s, 90s rest). Wash beads 3 × 3 min with 1 mL PNK wash buffer.
SDS-PAGE and nitrocellulose transfer
Resuspend beads in 15 μL NuPAGE LDS Sample Buffer and warm samples to 70°C for 10 min. Load samples on Novex NuPAGE 4–12% Bis-Tris gel, run at 110 V for 2.5 h. Protein ladders loaded between sample lanes facilitate accurate size selection in the subsequent step and reduce the risk of spillover between sample lanes. Transfer protein-RNA complexes to nitrocellulose (90 V × 2 h 15 min, on ice). Excise bands corresponding to the Ago:miRNA:mRNA complex (just below 160 kDa to just below 260 kDa). SDS-PAGE and nitrocellulose transfer steps if starting materials may be omitted for sample inputs <1 mg.
If γ-32P-ATP was used in either of the phosphorylation steps above, transfer may alternatively be done to PVDF followed by phosphor screen exposure and visualization (Typhoon FLA 9500 Variable Mode Laser Scanner Image Analyzer).
RNA isolation
Digest nitrocellulose pieces containing Ago:sncRNA:mRNA complexes with 300 μL 1 mg/mL proteinase K solution, incubate at 50°C for 1 h continuous shaking at 1200 rpm (ThermoMixer C). Add 400 μL saturated phenol/chloroform/isoamyl alcohol and incubate for 10 min at 37°C. Spin tubes at 14,000 x g for 3 min at 4°C. Transfer the aqueous layer to a new tube containing 900 μL 100% ethanol and 2 μL GlycoBlue, vortex thoroughly. GlycoBlue is used to aid in visualization of the RNA pellet. Precipitate overnight at −20°C. Pellet RNA by centrifugation (16,160 x g, 20 min at 4°C), discard supernatant. Add 1 mL 70% ethanol, rotate at 4°C for 5 min, spin at 16,160 x g for 20 min at 4°C, discard supernatant and let RNA pellet air dry for 5–10 min.
5′ linker ligation
Resuspend RNA pellet in 6 μL 1 mM ATP in T4 RNA ligase reaction buffer, add 2 μL PEG-8000 after resuspension. Briefly warm tubes to 95°C then chill on ice, add 10 U T4 RNA ligase 1, 10 mM 5′ linker, 20 U RNaseOUT individually to the mix. Incubate tubes at 37°C for 4 h shaking at 1100 rpm (15s, 90s rest).
Reverse transcription
Add 8.5 μL 7.5 mM DTT, 0.1 mM Reverse transcription primer, and 0.5 mM dNTPs in SSIV buffer to the 5′ linker ligation reaction mix. Heat the tubes to 65°C for 5 min, transfer the reaction to PCR tubes and add 10 U SuperScript IV and 20 U RNaseOUT individually. Incubate tubes at 50°C for 1 h, then 85°C for 5 min, hold at 4°C.
Test PCR and full-scale PCR
Set up test serial dilutions of reverse transcription reactions to determine optimal amplification for the full-scale PCR; each 8-fold dilution represents 3 fewer equivalent PCR cycles. Add 1M Betaine, 250 mM dNTPs, 250 nM RP1 primer, 250 nM RPI-1 primer, 0.4 U Phusion DNA polymerase in HF buffer to the dilutions. Run PCR (step 1: denature (95°C) 2 min; step 2–6: denature (95°C) 30 s, anneal (56°C) 30 s, extend (72°C) 30 s; step 7–22: denature (95°C) 30 s, anneal (65°C) 30 s, extend (72°C) 30 s; step 23: extend (72°C) 10 min). Resolve PCR products on 6% Novex TBE-Urea gel (180 V × 30 min). Stain gel with SYBR Gold at 1:10,000 in 1X TBE buffer for 10 min and image (Typhoon FLA 9500 Variable Mode Laser Scanner Image Analyzer) to determine the dilution with the desired amplification characteristics of a sufficient amount of product without exhausting the primers (∼50–75% unused primers should remain). The equivalent PCR cycle number from the optimal dilution is now selected for use in the full-scale PCR amplification. Add PCR mix (1M Betaine, 250 mM dNTPs, 250 nM RP1 primer, 250 nM RPI-X primer, 0.4 U Phusion DNA polymerase in HF buffer) to run PCR for the remaining RT reactions and hold at 4°C until ready for DNA isolation.
DNA isolation
Add 246 μL water, 18 μL 5M NaCl, 1 μL Glycoblue to the PCR reaction, followed by 750 μL 100% ethanol (v/v), vortex thoroughly, and centrifuge (14,000 x g, 20 min at 4°C). Discard supernatant, add 750 μL 75% ethanol (v/v) and vortex thoroughly, centrifuge (14,000 x g, 5 min at 4°C). Discard supernatant and air dry pellet for 5–10 min. Resuspend DNA pellet in 20 μL molecular biology grade water, separate DNA on 6% Novex TBE-Urea gel (180 V × 45 min). Stain gel with SYBR Gold 1:10,000 in 1X TBE buffer for 10 min, excise gel smear from above primer dimer (∼160 bp) to ∼300 bp. Add 600 μL gel elution buffer to the shredded gel pieces and incubate at 37°C for 2 h while shaking at 1000 rpm. Centrifuge at max speed for 1 min at room temperature and transfer eluate to a new tube. Add 400 μL gel elution buffer to the shredded gel pieces and incubate at 37°C for another 1 h while shaking at 1000 rpm. Centrifuge at max speed for 1 min at room temperature and transfer eluate to a fresh tube. Wash shredded gel pieces with 250 μL molecular biology grade water and transfer the wash to the eluate. Filter the eluate (0.22 μm Spin-X filter, centrifuge at 6,500 x g, 2 min at room temperature), collect flow through. Reduce the volume of the filtered eluate to ∼400 μL using a SpeedVac. Add 400 μL saturated phenol/chloroform/isoamyl alcohol to the concentrated eluate and vortex thoroughly. Centrifuge (14,000 x g, for 5 min at 4°C), transfer aqueous layer to a new tube, add an equal volume of chloroform and vortex thoroughly. Centrifuge (14,000 x g, 5 min at 4°C), transfer aqueous layer to a new tube. Add 1 μL GlycoBlue and 2.5 volumes of 100% ethanol and vortex thoroughly, incubate at room temperature for 10 min. Centrifuge (14,000 x g, 20 min at 4°C), discard supernatant, add 750 μL 75% ethanol (v/v) and vortex thoroughly. Centrifuge(14,000 x g, 5 min at 4°C), discard supernatant and dry samples for 5–10 min. Resuspend DNA pellet in 12 μL molecular biology grade water, quantify DNA yield (Qubit 1X dsDNA HS Assay).
Alternatively, efficiency may be enhanced by purifying the PCR products with a QIAquick PCR Purification Kit (Qiagen) and conducting size selection and elution using an automated system (e.g., BluePippin or PippinHT(Sage Science)), if available. Size-select library fragments from 165bp to 300 bp and concentrate the eluted library (MinElute PCR Purification (Qiagen)).
Quantification and statistical analysis
Forebrain CIMERA-seq peak calling analysis
CIMERA-seq libraries (forebrain 1-4) were sequenced as custom sequencing libraries with 150 base-pair paired-end sequencing and a read depth of 61–138 million reads per sample (Illumina HiSeq X or NovaSeq). Single-library peak calling was performed using updated SCRAP (SCRAP release 2.0) bioinformatic pipeline with rRNA and primer-dimer filters on sequencing data from CIMERA-seq forebrain 3 and 4 libraries to identify the sncRNA:targetRNA interactions in each sample.54,75 Peak calling was performed by setting SCRAP variables to consider only high confidence sncRNA binding sites across the genome supported by at least 3 chimeric sncRNA:target RNA reads in each sample library. Target gene reads were mapped to the mouse genome GRCm38 (mm10). Following peak calling, chimeras with intergenic annotations or non-nuclear genome target genes were filtered out. Chimeras with miRNAs not found in a high-confidence miRNA reference database (MirGeneDB 2.1) and chimeras with low confidence target genes (un-named or possible pseudogenes starting with the Gm prefix) were also filtered out. For each sample, the read counts per chimera were then normalized to counts per million (CPM) by dividing each chimera read count by the number of unique alignments for that sample and then multiplying by 1x10⁶. Peak calling using all 4 CIMERA-seq libraries (samples 1–4), was carried out with the same parameters and the additional inclusion of a requirement for peaks to be of at least 3 reads in a minimum of 2 libraries; the sites identified after peak calling represent high-confidence miRNA:target RNA interactions. Chimeras were then grouped by targeting miRNA families; the top 10 families of targeting miRNA by CPM are plotted (Figure 3D).
Total RNA sequencing was also performed on forebrain samples 3 and 4. For each sample, read counts per RNA were normalized to CPM by dividing each RNA read count by the total number of reads from total RNA sequencing for that sample and then multiplying by 1x10⁶. For each sample, for the target genes identified from CIMERA-seq peak calling that also had non-zero CPMs in total RNA sequencing, the correlation between CIMER-seq peak calling CPM and total RNA sequencing CPM was plotted (Figure 3A). For each sample, the CPM correlations between CIMERA-seq peak calling and total RNA sequencing were also plotted for just the top 50 highest CPM target genes identified from peak calling that also had non-zero total RNA sequencing CPMs (Figure 3B).
sncRNA sequencing was performed on the tissue samples of forebrain CIMERA-seq samples 3 and 4; the read counts were then pooled to get combined read counts for each sncRNA. sncRNAs not found in a high-confidence miRNA reference database (MirGeneDB 2.1) were filtered out and the combined read counts for remaining miRNAs were then normalized to CPM by dividing each read count by the total combined number of reads of the remaining miRNAs and then multiplying by 1 x 10⁶. The top 10 families of sncRNAs by CPM are plotted (Figure 3C).
Forebrain vs. excitatory-neuron-selective CIMERA-seq analysis
Custom sequencing libraries were prepared and sequenced by 150 base-pair paired-end sequencing with a read depth of 61–138 million reads per sample (Illumina HiSeq X, NovaSeq) following CIMERA-seq on parallel forebrain samples from the same mice (forebrain 5-7 and excitatory-neuron-selective 1–3). Resulting sequencing data were processed using SCRAP with peak calling and filtering as described above to identify the significant chimeras in each experimental group (forebrain and excitatory-neuron-selective CIMERA-seq).54,75 For each group (forebrain and excitatory-neuron-selective CIMERA-seq), chimeras were grouped by targeting miRNA families and the top 10 targeting miRNA families by CPM for each group plotted (Figures 5A and 5B); the top 10 target genes by CPM and their targeting miRNA for each group were also plotted (Figures 5D and 5E). Correlations between total forebrain and excitatory-neuron-selective CIMERA-seq gene targets and miRNAs after peak calling were calculated (Figures 4C and 4D). Target genes identified in forebrain CIMERA-seq and excitatory-neuron selective CIMERA-seq were also compared to the GEO: GSE122100 dataset of genes reported enriched in excitatory neurons; chimeras with target genes present in GSE122100 and positive log2(fold change) with adjusted p-value ≤0.05 were plotted grouped by target gene (Figure 6A).
Sequencing reads from libraries of forebrain CIMERA-seq samples 5–7 and excitatory-neuron-selective CIMERA-seq samples 1–3 were annotated as described above. For each sample, read counts per chimera were normalized to CPM by dividing by the total number of reads of the remaining chimeras in that sample and then multiplying by 1x10⁶. For each sample, chimeras were grouped by targeting miRNAs, and correlations of targeting miRNA CPMs between samples within a group were plotted (Figure S4A). For each sample, chimeras were also grouped by target gene, and correlations of target gene CPMs between samples within a group plotted (Figure S4B). Differential expression analysis (DeSeq276) was performed comparing read counts of targeting miRNA in excitatory-neuron-selective CIMERA-seq to forebrain CIMERA-seq, and resulting data plotted -log10(p-value) against log2(fold change) (volcano plot, Figure 5C).
GO analysis
Gene Ontology (GO) enrichment analysis was performed with target genes captured in excitatory-neuron-selective CIMERA-seq relative to global CIMERA-seq. Gene expression fold changes in excitatory-neuron-selective CIMERA-seq relative to global CIMERA-seq were calculated. Fold change information was then fed into the clusterProfiler program, and enrichment scores calculated based on the GO terms with application of a hypergeometric test. GO terms with overlapping definitions and gene attributes were merged and streamlined for comprehensiveness. Figures (Figure 6) were plotted with SRplot.
Acknowledgments
We thank members of the Meffert laboratory for helpful discussions, including E. Eiss and B. Powell for critical feedback on this method. This work was supported by a Braude Foundation award, a Blaustein Endowment for Pain Research and Education award, NIMH R01MH129292, the Sontag Foundation DSA146442 award to M.K.M., and NIMH F31MH124282 to W.T.M.
Author contributions
X.L., W.T.M., and M.K.M. conceptualized the work. X.L. and W.T.M. performed benchtop experiments. D.S.J. and W.T.M. performed computational analysis. X.L. and M.K.M. evaluated the experiments and designed the figures. X.L., W.T.M., D.S.J., and M.K.M. wrote the original manuscript. X.L., W.T.M., D.S.J., and M.K.M conducted manuscript review and editing. M.K.M supervised the study.
Declaration of interests
The authors declare no competing interests.
Published: August 9, 2024
Footnotes
Supplemental information can be found online at https://doi.org/10.1016/j.crmeth.2024.100836.
Supplemental information
References
- 1.Ule J., Jensen K., Mele A., Darnell R.B. CLIP: a method for identifying protein-RNA interaction sites in living cells. Methods. 2005;37:376–386. doi: 10.1016/j.ymeth.2005.07.018. [DOI] [PubMed] [Google Scholar]
- 2.Licatalosi D.D., Mele A., Fak J.J., Ule J., Kayikci M., Chi S.W., Clark T.A., Schweitzer A.C., Blume J.E., Wang X., et al. HITS-CLIP yields genome-wide insights into brain alternative RNA processing. Nature. 2008;456:464–469. doi: 10.1038/nature07488. [DOI] [PMC free article] [PubMed] [Google Scholar]
- 3.Chi S.W., Zang J.B., Mele A., Darnell R.B. Argonaute HITS-CLIP decodes microRNA-mRNA interaction maps. Nature. 2009;460:479–486. doi: 10.1038/nature08170. [DOI] [PMC free article] [PubMed] [Google Scholar]
- 4.Helwak A., Kudla G., Dudnakova T., Tollervey D. Mapping the human miRNA interactome by CLASH reveals frequent noncanonical binding. Cell. 2013;153:654–665. doi: 10.1016/j.cell.2013.03.043. [DOI] [PMC free article] [PubMed] [Google Scholar]
- 5.Loeb G.B., Khan A.A., Canner D., Hiatt J.B., Shendure J., Darnell R.B., Leslie C.S., Rudensky A.Y. Transcriptome-wide miR-155 binding map reveals widespread noncanonical microRNA targeting. Mol. Cell. 2012;48:760–770. doi: 10.1016/j.molcel.2012.10.002. [DOI] [PMC free article] [PubMed] [Google Scholar]
- 6.Lal A., Navarro F., Maher C.A., Maliszewski L.E., Yan N., O’Day E., Chowdhury D., Dykxhoorn D.M., Tsai P., Hofmann O., et al. miR-24 Inhibits cell proliferation by targeting E2F2, MYC, and other cell-cycle genes via binding to “seedless” 3′UTR microRNA recognition elements. Mol. Cell. 2009;35:610–625. doi: 10.1016/j.molcel.2009.08.020. [DOI] [PMC free article] [PubMed] [Google Scholar]
- 7.Grimson A., Farh K.K.-H., Johnston W.K., Garrett-Engele P., Lim L.P., Bartel D.P. MicroRNA targeting specificity in mammals: determinants beyond seed pairing. Mol. Cell. 2007;27:91–105. doi: 10.1016/j.molcel.2007.06.017. [DOI] [PMC free article] [PubMed] [Google Scholar]
- 8.Moore M.J., Scheel T.K.H., Luna J.M., Park C.Y., Fak J.J., Nishiuchi E., Rice C.M., Darnell R.B. miRNA-target chimeras reveal miRNA 3′-end pairing as a major determinant of Argonaute target specificity. Nat. Commun. 2015;6:8864. doi: 10.1038/ncomms9864. [DOI] [PMC free article] [PubMed] [Google Scholar]
- 9.Chipman L.B., Pasquinelli A.E. miRNA Targeting: Growing beyond the Seed. Trends Genet. 2019;35:215–222. doi: 10.1016/j.tig.2018.12.005. [DOI] [PMC free article] [PubMed] [Google Scholar]
- 10.Broughton J.P., Lovci M.T., Huang J.L., Yeo G.W., Pasquinelli A.E. Pairing beyond the Seed Supports MicroRNA Targeting Specificity. Mol. Cell. 2016;64:320–333. doi: 10.1016/j.molcel.2016.09.004. [DOI] [PMC free article] [PubMed] [Google Scholar]
- 11.Forman J.J., Legesse-Miller A., Coller H.A. A search for conserved sequences in coding regions reveals that the let-7 microRNA targets Dicer within its coding sequence. Proc. Natl. Acad. Sci. USA. 2008;105:14879–14884. doi: 10.1073/pnas.0803230105. [DOI] [PMC free article] [PubMed] [Google Scholar]
- 12.Tay Y., Zhang J., Thomson A.M., Lim B., Rigoutsos I. MicroRNAs to Nanog, Oct4 and Sox2 coding regions modulate embryonic stem cell differentiation. Nature. 2008;455:1124–1128. doi: 10.1038/nature07299. [DOI] [PubMed] [Google Scholar]
- 13.Lytle J.R., Yario T.A., Steitz J.A. Target mRNAs are repressed as efficiently by microRNA-binding sites in the 5′ UTR as in the 3′ UTR. Proc. Natl. Acad. Sci. USA. 2007;104:9667–9672. doi: 10.1073/pnas.0703820104. [DOI] [PMC free article] [PubMed] [Google Scholar]
- 14.Long D., Lee R., Williams P., Chan C.Y., Ambros V., Ding Y. Potent effect of target structure on microRNA function. Nat. Struct. Mol. Biol. 2007;14:287–294. doi: 10.1038/nsmb1226. [DOI] [PubMed] [Google Scholar]
- 15.Ciafrè S.A., Galardi S. microRNAs and RNA-binding proteins: a complex network of interactions and reciprocal regulations in cancer. RNA Biol. 2013;10:935–942. doi: 10.4161/rna.24641. [DOI] [PMC free article] [PubMed] [Google Scholar]
- 16.Hammell C.M., Lubin I., Boag P.R., Blackwell T.K., Ambros V. nhl-2 Modulates microRNA activity in Caenorhabditis elegans. Cell. 2009;136:926–938. doi: 10.1016/j.cell.2009.01.053. [DOI] [PMC free article] [PubMed] [Google Scholar]
- 17.Johnston M., Hutvagner G. Posttranslational modification of Argonautes and their role in small RNA-mediated gene regulation. Silence. 2011;2:1–4. doi: 10.1186/1758-907X-2-5. [DOI] [PMC free article] [PubMed] [Google Scholar]
- 18.Wang B., Bao L. Axonal microRNAs: localization, function and regulatory mechanism during axon development. J. Mol. Cell Biol. 2017;9:82–90. doi: 10.1093/jmcb/mjw050. [DOI] [PMC free article] [PubMed] [Google Scholar]
- 19.Li M., Marin-Muller C., Bharadwaj U., Chow K.-H., Yao Q., Chen C. MicroRNAs: control and loss of control in human physiology and disease. World J. Surg. 2009;33:667–684. doi: 10.1007/s00268-008-9836-x. [DOI] [PMC free article] [PubMed] [Google Scholar]
- 20.Bjerke G.A., Yi R. Integrated analysis of directly captured microRNA targets reveals the impact of microRNAs on mammalian transcriptome. RNA. 2020;26:306–323. doi: 10.1261/rna.073635.119. [DOI] [PMC free article] [PubMed] [Google Scholar]
- 21.Grosswendt S., Filipchyk A., Manzano M., Klironomos F., Schilling M., Herzog M., Gottwein E., Rajewsky N. Unambiguous identification of miRNA:target site interactions by different types of ligation reactions. Mol. Cell. 2014;54:1042–1054. doi: 10.1016/j.molcel.2014.03.049. [DOI] [PMC free article] [PubMed] [Google Scholar]
- 22.Zhang Z., Lee J.E., Riemondy K., Anderson E.M., Yi R. High-efficiency RNA cloning enables accurate quantification of miRNA expression by deep sequencing. Genome Biol. 2013;14 doi: 10.1186/gb-2013-14-10-r109. [DOI] [PMC free article] [PubMed] [Google Scholar]
- 23.Hoefert J.E., Bjerke G.A., Wang D., Yi R. The microRNA-200 family coordinately regulates cell adhesion and proliferation in hair morphogenesis. J. Cell Biol. 2018;217:2185–2204. doi: 10.1083/jcb.201708173. [DOI] [PMC free article] [PubMed] [Google Scholar]
- 24.He M., Liu Y., Wang X., Zhang M.Q., Hannon G.J., Huang Z.J. Cell-type-based analysis of microRNA profiles in the mouse brain. Neuron. 2012;73:35–48. doi: 10.1016/j.neuron.2011.11.010. [DOI] [PMC free article] [PubMed] [Google Scholar]
- 25.Shetlar M.D., Christensen J., Hom K. Photochemical addition of amino acids and peptides to DNA. Photochem. Photobiol. 1984;39:125–133. doi: 10.1111/j.1751-1097.1984.tb03417.x. [DOI] [PubMed] [Google Scholar]
- 26.Hockensmith J.W., Kubasek W.L., Vorachek W.R., von Hippel P.H. Laser cross-linking of nucleic acids to proteins. Methodology and first applications to the phage T4 DNA replication system. J. Biol. Chem. 1986;261:3512–3518. doi: 10.1016/S0021-9258(17)35677-6. [DOI] [PubMed] [Google Scholar]
- 27.Brimacombe R., Stiege W., Kyriatsoulis A., Maly P. Intra-RNA and RNA-protein cross-linking techniques in Escherichia coli ribosomes. Methods Enzymol. 1988;164:287–309. doi: 10.1016/s0076-6879(88)64050-x. [DOI] [PubMed] [Google Scholar]
- 28.delCardayré S.B., Raines R.T. The extent to which ribonucleases cleave ribonucleic acid. Anal. Biochem. 1995;225:176–178. doi: 10.1006/abio.1995.1132. [DOI] [PubMed] [Google Scholar]
- 29.Ma J.-B., Yuan Y.-R., Meister G., Pei Y., Tuschl T., Patel D.J. Structural basis for 5′-end-specific recognition of guide RNA by the A. fulgidus Piwi protein. Nature. 2005;434:666–670. doi: 10.1038/nature03514. [DOI] [PMC free article] [PubMed] [Google Scholar]
- 30.Parker J.S., Roe S.M., Barford D. Structural insights into mRNA recognition from a PIWI domain-siRNA guide complex. Nature. 2005;434:663–666. doi: 10.1038/nature03462. [DOI] [PMC free article] [PubMed] [Google Scholar]
- 31.Lingel A., Simon B., Izaurralde E., Sattler M. Structure and nucleic-acid binding of the Drosophila Argonaute 2 PAZ domain. Nature. 2003;426:465–469. doi: 10.1038/nature02123. [DOI] [PubMed] [Google Scholar]
- 32.Yan K.S., Yan S., Farooq A., Han A., Zeng L., Zhou M.-M. Structure and conserved RNA binding of the PAZ domain. Nature. 2003;426:468–474. doi: 10.1038/nature02129. [DOI] [PubMed] [Google Scholar]
- 33.Song J.-J., Liu J., Tolia N.H., Schneiderman J., Smith S.K., Martienssen R.A., Hannon G.J., Joshua-Tor L. The crystal structure of the Argonaute 2 PAZ domain reveals an RNA binding motif in RNAi effector complexes. Nat. Struct. Biol. 2003;10:1026–1032. doi: 10.1038/nsb1016. [DOI] [PubMed] [Google Scholar]
- 34.Ma J.-B., Ye K., Patel D.J. Structural basis for overhang-specific small interfering RNA recognition by the PAZ domain. Nature. 2004;429:318–322. doi: 10.1038/nature02519. [DOI] [PMC free article] [PubMed] [Google Scholar]
- 35.Meister G., Landthaler M., Patkaniowska A., Dorsett Y., Teng G., Tuschl T. Human Argonaute2 mediates RNA cleavage targeted by miRNAs and siRNAs. Mol. Cell. 2004;15:185–197. doi: 10.1016/j.molcel.2004.07.007. [DOI] [PubMed] [Google Scholar]
- 36.Liu J., Carmell M.A., Rivas F.V., Marsden C.G., Thomson J.M., Song J.-J., Hammond S.M., Joshua-Tor L., Hannon G.J. Argonaute2 is the catalytic engine of mammalian RNAi. Science. 2004;305:1437–1441. doi: 10.1126/science.1102513. [DOI] [PubMed] [Google Scholar]
- 37.Dueck A., Ziegler C., Eichner A., Berezikov E., Meister G. microRNAs associated with the different human Argonaute proteins. Nucleic Acids Res. 2012;40:9850–9862. doi: 10.1093/nar/gks705. [DOI] [PMC free article] [PubMed] [Google Scholar]
- 38.Hauptmann J., Schraivogel D., Bruckmann A., Manickavel S., Jakob L., Eichner N., Pfaff J., Urban M., Sprunck S., Hafner M., et al. Biochemical isolation of Argonaute protein complexes by Ago-APP. Proc. Natl. Acad. Sci. USA. 2015;112:11841–11845. doi: 10.1073/pnas.1506116112. [DOI] [PMC free article] [PubMed] [Google Scholar]
- 39.Wang D., Zhang Z., O’Loughlin E., Lee T., Houel S., O’Carroll D., Tarakhovsky A., Ahn N.G., Yi R. Quantitative functions of Argonaute proteins in mammalian development. Genes Dev. 2012;26:693–704. doi: 10.1101/gad.182758.111. [DOI] [PMC free article] [PubMed] [Google Scholar]
- 40.Liu Q., Novak M.K., Pepin R.M., Eich T., Hu W. microRNA-mediated regulation of microRNA machinery controls cell fate decisions. eLife. 2021;10 doi: 10.7554/eLife.72289. [DOI] [PMC free article] [PubMed] [Google Scholar]
- 41.Hafner M., Max K.E.A., Bandaru P., Morozov P., Gerstberger S., Brown M., Molina H., Tuschl T. Identification of mRNAs bound and regulated by human LIN28 proteins and molecular requirements for RNA recognition. RNA. 2013;19:613–626. doi: 10.1261/rna.036491.112. [DOI] [PMC free article] [PubMed] [Google Scholar]
- 42.Leung A.K.L., Young A.G., Bhutkar A., Zheng G.X., Bosson A.D., Nielsen C.B., Sharp P.A. Genome-wide identification of Ago2 binding sites from mouse embryonic stem cells with and without mature microRNAs. Nat. Struct. Mol. Biol. 2011;18:237–244. doi: 10.1038/nsmb.1991. [DOI] [PMC free article] [PubMed] [Google Scholar]
- 43.Karginov F.V., Hannon G.J. Remodeling of Ago2-mRNA interactions upon cellular stress reflects miRNA complementarity and correlates with altered translation rates. Genes Dev. 2013;27:1624–1632. doi: 10.1101/gad.215939.113. [DOI] [PMC free article] [PubMed] [Google Scholar]
- 44.Becker A., Hurwitz J. The enzymatic cleavage of phosphate termini from polynucleotides. J. Biol. Chem. 1967;242:936–950. doi: 10.1016/S0021-9258(18)96215-0. [DOI] [PubMed] [Google Scholar]
- 45.Cameron V., Uhlenbeck O.C. 3′-Phosphatase activity in T4 polynucleotide kinase. Biochemistry. 1977;16:5120–5126. doi: 10.1021/bi00642a027. [DOI] [PubMed] [Google Scholar]
- 46.Harrison B., Zimmerman S.B. Polymer-stimulated ligation: enhanced ligation of oligo- and polynucleotides by T4 RNA ligase in polymer solutions. Nucleic Acids Res. 1984;12:8235–8251. doi: 10.1093/nar/12.21.8235. [DOI] [PMC free article] [PubMed] [Google Scholar]
- 47.Broughton J.P., Pasquinelli A.E. Detection of microRNA-Target Interactions by Chimera PCR (ChimP) Methods Mol. Biol. 2018;1823:153–165. doi: 10.1007/978-1-4939-8624-8_12. [DOI] [PubMed] [Google Scholar]
- 48.Viollet S., Fuchs R.T., Munafo D.B., Zhuang F., Robb G.B. T4 RNA ligase 2 truncated active site mutants: improved tools for RNA analysis. BMC Biotechnol. 2011;11:72. doi: 10.1186/1472-6750-11-72. [DOI] [PMC free article] [PubMed] [Google Scholar]
- 49.Buchbender A., Mutter H., Sutandy F.X.R., Körtel N., Hänel H., Busch A., Ebersberger S., König J. Improved library preparation with the new iCLIP2 protocol. Methods. 2020;178:33–48. doi: 10.1016/j.ymeth.2019.10.003. [DOI] [PubMed] [Google Scholar]
- 50.Gay L.A., Sethuraman S., Thomas M., Turner P.C., Renne R. Modified Cross-Linking, Ligation, and Sequencing of Hybrids (qCLASH) Identifies Kaposi’s Sarcoma-Associated Herpesvirus MicroRNA Targets in Endothelial Cells. J. Virol. 2018;92 doi: 10.1128/JVI.02138-17. [DOI] [PMC free article] [PubMed] [Google Scholar]
- 51.Gay L.A., Turner P.C., Renne R. Modified Cross-Linking, Ligation, and Sequencing of Hybrids (qCLASH) to Identify MicroRNA Targets. Curr. Protoc. 2021;1 doi: 10.1002/cpz1.257. [DOI] [PMC free article] [PubMed] [Google Scholar]
- 52.Mahat D.B., Kwak H., Booth G.T., Jonkers I.H., Danko C.G., Patel R.K., Waters C.T., Munson K., Core L.J., Lis J.T. Base-pair-resolution genome-wide mapping of active RNA polymerases using precision nuclear run-on (PRO-seq) Nat. Protoc. 2016;11:1455–1476. doi: 10.1038/nprot.2016.086. [DOI] [PMC free article] [PubMed] [Google Scholar]
- 53.Tarazona S., García-Alcalde F., Dopazo J., Ferrer A., Conesa A. Differential expression in RNA-seq: a matter of depth. Genome Res. 2011;21:2213–2223. doi: 10.1101/gr.124321.111. [DOI] [PMC free article] [PubMed] [Google Scholar]
- 54.Mills W.T., Eadara S., Jaffe A.E., Meffert M.K. SCRAP: a bioinformatic pipeline for the analysis of small chimeric RNA-seq data. RNA. 2022;29:1–17. doi: 10.1261/rna.079240.122. [DOI] [PMC free article] [PubMed] [Google Scholar]
- 55.Agarwal V., Bell G.W., Nam J.-W., Bartel D.P. Predicting effective microRNA target sites in mammalian mRNAs. eLife. 2015;4 doi: 10.7554/eLife.05005. [DOI] [PMC free article] [PubMed] [Google Scholar]
- 56.McGeary S.E., Lin K.S., Shi C.Y., Pham T.M., Bisaria N., Kelley G.M., Bartel D.P. The biochemical basis of microRNA targeting efficacy. Science. 2019;366 doi: 10.1126/science.aav1741. [DOI] [PMC free article] [PubMed] [Google Scholar]
- 57.Yue F., Cheng Y., Breschi A., Vierstra J., Wu W., Ryba T., Sandstrom R., Ma Z., Davis C., Pope B.D., et al. A comparative encyclopedia of DNA elements in the mouse genome. Nature. 2014;515:355–364. doi: 10.1038/nature13992. [DOI] [PMC free article] [PubMed] [Google Scholar]
- 58.Huang V., Li L.-C. Demystifying the nuclear function of Argonaute proteins. RNA Biol. 2014;11:18–24. doi: 10.4161/rna.27604. [DOI] [PMC free article] [PubMed] [Google Scholar]
- 59.Katz S., Cussigh D., Urbán N., Blomfield I., Guillemot F., Bally-Cuif L., Coolen M. A Nuclear Role for miR-9 and Argonaute Proteins in Balancing Quiescent and Activated Neural Stem Cell States. Cell Rep. 2016;17:1383–1398. doi: 10.1016/j.celrep.2016.09.088. [DOI] [PMC free article] [PubMed] [Google Scholar]
- 60.Yamasaki S., Ivanov P., Hu G.-F., Anderson P. Angiogenin cleaves tRNA and promotes stress-induced translational repression. J. Cell Biol. 2009;185:35–42. doi: 10.1083/jcb.200811106. [DOI] [PMC free article] [PubMed] [Google Scholar]
- 61.Pederson T. Regulatory RNAs derived from transfer RNA? RNA. 2010;16:1865–1869. doi: 10.1261/rna.2266510. [DOI] [PMC free article] [PubMed] [Google Scholar]
- 62.Kumar P., Anaya J., Mudunuri S.B., Dutta A. Meta-analysis of tRNA derived RNA fragments reveals that they are evolutionarily conserved and associate with AGO proteins to recognize specific RNA targets. BMC Biol. 2014;12:78. doi: 10.1186/s12915-014-0078-0. [DOI] [PMC free article] [PubMed] [Google Scholar]
- 63.Kuscu C., Kumar P., Kiran M., Su Z., Malik A., Dutta A. tRNA fragments (tRFs) guide Ago to regulate gene expression post-transcriptionally in a Dicer-independent manner. RNA. 2018;24:1093–1105. doi: 10.1261/rna.066126.118. [DOI] [PMC free article] [PubMed] [Google Scholar]
- 64.Guan L., Karaiskos S., Grigoriev A. Inferring targeting modes of Argonaute-loaded tRNA fragments. RNA Biol. 2020;17:1070–1080. doi: 10.1080/15476286.2019.1676633. [DOI] [PMC free article] [PubMed] [Google Scholar]
- 65.Xiao Q., Gao P., Huang X., Chen X., Chen Q., Lv X., Fu Y., Song Y., Wang Z. tRFTars: predicting the targets of tRNA-derived fragments. J. Transl. Med. 2021;19:88. doi: 10.1186/s12967-021-02731-7. [DOI] [PMC free article] [PubMed] [Google Scholar]
- 66.Zuo Y., Zhu L., Guo Z., Liu W., Zhang J., Zeng Z., Wu Q., Cheng J., Fu X., Jin Y., et al. tsRBase: a comprehensive database for expression and function of tsRNAs in multiple species. Nucleic Acids Res. 2021;49:D1038–D1045. doi: 10.1093/nar/gkaa888. [DOI] [PMC free article] [PubMed] [Google Scholar]
- 67.Wang J.-H., Chen W.-X., Mei S.-Q., Yang Y.-D., Yang J.-H., Qu L.-H., Zheng L.-L. tsRFun: a comprehensive platform for decoding human tsRNA expression, functions and prognostic value by high-throughput small RNA-Seq and CLIP-Seq data. Nucleic Acids Res. 2022;50:D421–D431. doi: 10.1093/nar/gkab1023. [DOI] [PMC free article] [PubMed] [Google Scholar]
- 68.Kozomara A., Birgaoanu M., Griffiths-Jones S. miRBase: from microRNA sequences to function. Nucleic Acids Res. 2019;47:D155–D162. doi: 10.1093/nar/gky1141. [DOI] [PMC free article] [PubMed] [Google Scholar]
- 69.Kumar P., Mudunuri S.B., Anaya J., Dutta A. tRFdb: a database for transfer RNA fragments. Nucleic Acids Res. 2015;43:D141–D145. doi: 10.1093/nar/gku1138. [DOI] [PMC free article] [PubMed] [Google Scholar]
- 70.Yigit E., Batista P.J., Bei Y., Pang K.M., Chen C.-C.G., Tolia N.H., Joshua-Tor L., Mitani S., Simard M.J., Mello C.C. Analysis of the C. elegans Argonaute family reveals that distinct Argonautes act sequentially during RNAi. Cell. 2006;127:747–757. doi: 10.1016/j.cell.2006.09.033. [DOI] [PubMed] [Google Scholar]
- 71.Tan F.E., Sathe S., Wheeler E.C., Nussbacher J.K., Peter S., Yeo G.W. A Transcriptome-wide Translational Program Defined by LIN28B Expression Level. Mol. Cell. 2019;73:304–313.e3. doi: 10.1016/j.molcel.2018.10.041. [DOI] [PMC free article] [PubMed] [Google Scholar]
- 72.Wright C., Rajpurohit A., Burke E.E., Williams C., Collado-Torres L., Kimos M., Brandon N.J., Cross A.J., Jaffe A.E., Weinberger D.R., Shin J.H. Comprehensive assessment of multiple biases in small RNA sequencing reveals significant differences in the performance of widely used methods. BMC Genom. 2019;20:513. doi: 10.1186/s12864-019-5870-3. [DOI] [PMC free article] [PubMed] [Google Scholar]
- 73.Fu X., Liu P., Dimopoulos G., Zhu J. Dynamic miRNA-mRNA interactions coordinate gene expression in adult Anopheles gambiae. PLoS Genet. 2020;16 doi: 10.1371/journal.pgen.1008765. [DOI] [PMC free article] [PubMed] [Google Scholar]
- 74.Erdmann G., Schütz G., Berger S. Inducible gene inactivation in neurons of the adult mouse forebrain. BMC Neurosci. 2007;8:63. doi: 10.1186/1471-2202-8-63. [DOI] [PMC free article] [PubMed] [Google Scholar]
- 75.Eadara S., Li X., Eiss E.A., Meffert M.K. Computational analysis tutorial for chimeric small noncoding RNA: target RNA sequencing libraries. J. Vis. Exp. 2023;2023 doi: 10.3791/65779. [DOI] [PMC free article] [PubMed] [Google Scholar]
- 76.Love M.I., Huber W., Anders S. Moderated estimation of fold change and dispersion for RNA-seq data with DESeq2. Genome Biol. 2014;15:550. doi: 10.1186/s13059-014-0550-8. [DOI] [PMC free article] [PubMed] [Google Scholar]
- 77.Franzoni E., Booker S.A., Parthasarathy S., Rehfeld F., Grosser S., Srivatsa S., Fuchs H.R., Tarabykin V., Vida I., Wulczyn F.G. miR-128 regulates neuronal migration, outgrowth and intrinsic excitability via the intellectual disability gene Phf6. eLife. 2015;4 doi: 10.7554/eLife.04263. [DOI] [PMC free article] [PubMed] [Google Scholar]
- 78.Tan C.L., Plotkin J.L., Venø M.T., von Schimmelmann M., Feinberg P., Mann S., Handler A., Kjems J., Surmeier D.J., O’Carroll D., et al. MicroRNA-128 governs neuronal excitability and motor behavior in mice. Science. 2013;342:1254–1258. doi: 10.1126/science.1244193. [DOI] [PMC free article] [PubMed] [Google Scholar]
- 79.Swahari V., Nakamura A., Hollville E., Stroud H., Simon J.M., Ptacek T.S., Beck M.V., Flowers C., Guo J., Plestant C., et al. MicroRNA-29 is an essential regulator of brain maturation through regulation of CH methylation. Cell Rep. 2021;35 doi: 10.1016/j.celrep.2021.108946. [DOI] [PMC free article] [PubMed] [Google Scholar]
- 80.Fairchild C.L.A., Cheema S.K., Wong J., Hino K., Simó S., La Torre A. Let-7 regulates cell cycle dynamics in the developing cerebral cortex and retina. Sci. Rep. 2019;9 doi: 10.1038/s41598-019-51703-x. [DOI] [PMC free article] [PubMed] [Google Scholar]
- 81.Choy F.C., Klarić T.S., Koblar S.A., Lewis M.D. miR-744 and miR-224 Downregulate Npas4 and Affect Lineage Differentiation Potential and Neurite Development During Neural Differentiation of Mouse Embryonic Stem Cells. Mol. Neurobiol. 2017;54:3528–3541. doi: 10.1007/s12035-016-9912-4. [DOI] [PubMed] [Google Scholar]
- 82.Huang Y.-W.A., Ruiz C.R., Eyler E.C.H., Lin K., Meffert M.K. Dual regulation of miRNA biogenesis generates target specificity in neurotrophin-induced protein synthesis. Cell. 2012;148:933–946. doi: 10.1016/j.cell.2012.01.036. [DOI] [PMC free article] [PubMed] [Google Scholar]
- 83.Schwamborn J.C., Berezikov E., Knoblich J.A. The TRIM-NHL protein TRIM32 activates microRNAs and prevents self-renewal in mouse neural progenitors. Cell. 2009;136:913–925. doi: 10.1016/j.cell.2008.12.024. [DOI] [PMC free article] [PubMed] [Google Scholar]
- 84.Huntley M.A., Srinivasan K., Friedman B.A., Wang T.-M., Yee A.X., Wang Y., Kaminker J.S., Sheng M., Hansen D.V., Hanson J.E. Genome-Wide Analysis of Differential Gene Expression and Splicing in Excitatory Neurons and Interneuron Subtypes. J. Neurosci. 2020;40:958–973. doi: 10.1523/JNEUROSCI.1615-19.2019. [DOI] [PMC free article] [PubMed] [Google Scholar]
- 85.Yu G., Wang L.-G., Han Y., He Q.-Y. clusterProfiler: an R package for comparing biological themes among gene clusters. OMICS. 2012;16:284–287. doi: 10.1089/omi.2011.0118. [DOI] [PMC free article] [PubMed] [Google Scholar]
- 86.Tang D., Chen M., Huang X., Zhang G., Zeng L., Zhang G., Wu S., Wang Y. SRplot: A free online platform for data visualization and graphing. PLoS One. 2023;18 doi: 10.1371/journal.pone.0294236. [DOI] [PMC free article] [PubMed] [Google Scholar]
- 87.Van Nostrand E.L., Pratt G.A., Shishkin A.A., Gelboin-Burkhart C., Fang M.Y., Sundararaman B., Blue S.M., Nguyen T.B., Surka C., Elkins K., et al. Robust transcriptome-wide discovery of RNA-binding protein binding sites with enhanced CLIP (eCLIP) Nat. Methods. 2016;13:508–514. doi: 10.1038/nmeth.3810. [DOI] [PMC free article] [PubMed] [Google Scholar]
- 88.Buhagiar A.F., Kleaveland B. To kill a microRNA: emerging concepts in target-directed microRNA degradation. Nucleic Acids Res. 2024;52:1558–1574. doi: 10.1093/nar/gkae003. [DOI] [PMC free article] [PubMed] [Google Scholar]
- 89.Martin M. Cutadapt removes adapter sequences from high-throughput sequencing reads. EMBnet. j. 2011;17:10. doi: 10.14806/ej.17.1.200. [DOI] [Google Scholar]
- 90.Kim D., Langmead B., Salzberg S.L. HISAT: a fast spliced aligner with low memory requirements. Nat. Methods. 2015;12:357–360. doi: 10.1038/nmeth.3317. [DOI] [PMC free article] [PubMed] [Google Scholar]
- 91.Li H., Handsaker B., Wysoker A., Fennell T., Ruan J., Homer N., Marth G., Abecasis G., Durbin R., 1000 Genome Project Data Processing Subgroup The Sequence Alignment/Map format and SAMtools. Bioinformatics. 2009;25:2078–2079. doi: 10.1093/bioinformatics/btp352. [DOI] [PMC free article] [PubMed] [Google Scholar]
- 92.Anders S., Pyl P.T., Huber W. HTSeq—a Python framework to work with high-throughput sequencing data. Bioinformatics. 2015;31:166–169. doi: 10.1093/bioinformatics/btu638. [DOI] [PMC free article] [PubMed] [Google Scholar]
Associated Data
This section collects any data citations, data availability statements, or supplementary materials included in this article.
Supplementary Materials
Data Availability Statement
Chimeric RNA-seq data have been deposited at GEO and will be publicly available as of the date of publication. Accession numbers are listed in the key resources table. This paper also analyzes existing, publicly available data. These accession numbers for the datasets are listed in the key resources table.
This paper does not report original code. All chimeric RNA-seq data were analyzed using an updated version of SCRAP,54,75 for which code is deposited at https://github.com/Meffert-Lab/SCRAP.
Any additional information required to reanalyze the data reported in this paper is available from the lead contact upon request.