Abstract
Background
Early-stage invasive lung adenocarcinoma (ADC) characterized by a predominant micropapillary or solid pattern exhibit an elevated risk of recurrence following sub-lobar resection, thus determining histological subtype of early-stage invasive ADC prior surgery is important for formulating lobectomy or sub-lobar resection. This study aims to develop a deep learning algorithm and assess its clinical capability in distinguishing high-risk or low-risk histologic patterns in early-stage invasive ADC based on preoperative computed tomography (CT) scans.
Methods
Two retrospective cohorts were included: development cohort 1 and external test cohort 2, comprising patients diagnosed with T1 stage invasive ADC. Electronic medical records and CT scans of all patients were documented. Patients were stratified into two risk groups. High-risk group: comprising cases with a micropapillary component ≥5% or a predominant solid pattern. Low-risk group: encompassing cases with a micropapillary component <5% and an absence of a predominant solid pattern. The overall segmentation model was modified based on Mask Region-based Convolutional Neural Network (Mask-RCNN), and Residual Network 50 (ResNet50)_3D was employed for image classification.
Results
A total of 432 patients participated in this study, with 385 cases in cohort 1 and 47 cases in cohort 2. The fine-outline results produced by the auto-segmentation model exhibited a high level of agreement with manual segmentation by human experts, yielding a mean dice coefficient of 0.86 [95% confidence interval (CI): 0.85–0.87] in cohort 1 and 0.84 (95% CI: 0.82–0.85) in cohort 2. Furthermore, the deep learning model effectively differentiated the high-risk group from the low-risk group, achieving an area under the curve (AUC) of 0.89 (95% CI: 0.88–0.90) in cohort 1. In the external validation conducted in cohort 2, the deep learning model displayed an AUC of 0.87 (95% CI: 0.84–0.88) in distinguishing the high-risk group from the low-risk group. The average diagnostic time was 16.00±3.2 seconds, with an accuracy of 0.82 (95% CI: 0.81–0.83).
Conclusions
We have developed a deep learning algorithm, LungPath, for the automated segmentation of pulmonary nodules and prediction of high-risk histological patterns in early-stage lung ADC based on CT scans.
Keywords: Artificial intelligence (AI), histologic patterns, early-stage invasive lung adenocarcinoma (early-stage invasive lung ADC)
Highlight box.
Key findings
• We have developed a deep learning algorithm, LungPath, for the automated segmentation of pulmonary nodules and prediction of high-risk histological patterns in early-stage lung adenocarcinoma based on computed tomography (CT) scans.
What is known and what is new?
• In the context of lung adenocarcinoma with a diameter of 2 cm or less, cases characterized by a predominant micropapillary or solid pattern exhibit an elevated risk of recurrence following sub-lobar resection.
• We have developed a deep learning algorithm, LungPath, for the automated segmentation of pulmonary nodules and prediction of high-risk histological patterns in early-stage lung adenocarcinoma based on CT scans.
What is the implication, and what should change now?
• Our study demonstrates that the deep learning tool can proficiently classify histological patterns with a high degree of accuracy within a mere half-minute interval before surgery. This valuable information equips surgeons with essential insights when formulating their surgical plans. By offering surgeons a pre-resection assessment, they can make more informed decisions.
Introduction
Lung cancer, with an estimated 2.2 million new cases and 1.8 million deaths in 2020, stands as one of the most frequently diagnosed cancers and the leading cause of cancer-related mortality (1). Non-small cell lung cancer (NSCLC) accounts for approximately 80–85% of all lung cancer cases, with lung adenocarcinoma (ADC) being the most prevalent subtype. Thanks to the widespread adoption of low-dose computed tomography (CT) and advances in cancer screening, more early-stage ADC patients have been detected (2,3). Surgical resection remains the sole curative option for early-stage ADC.
In recent years, sub-lobar resection has gained increasing popularity for early-stage ADC, primarily due to its potential for preserving pulmonary function when compared to lobectomy. Long-term survival outcomes from the JCOG0804 study have indicated that for ADC tumors with a diameter less than 2 cm and a solid component of less than 25%, the recurrence-free survival (RFS) rate following sub-lobar resection reached an impressive 99.7% (4). Similarly, findings from the JCOG0802 study showcased noteworthy results, with a 5-year overall survival (OS) rate of 94.3% in the segmentectomy group, as opposed to 91.1% in the lobectomy group. Moreover, the 5-year RFS rates for segmentectomy and lobectomy were 88.0% and 87.9%, respectively. Additionally, the decrease in median forced expiratory volume in the first second (FEV1) following segmentectomy was notably favorable, with a reduction of 10.4% at 6 months and 8.5% at 1 year, in contrast to the less favorable outcomes observed with lobectomy (13.1% at 6 months and 12.0% at 1 year) (5). These findings suggest that segmentectomy may hold the potential to supplant lobectomy as the standard treatment for early-stage NSCLC.
The 2015 World Health Organization (WHO) classification of lung cancer introduced a novel framework for the categorization of invasive ADC, delineating five distinct histologic subtypes: lepidic, acinar, papillary, micropapillary, and solid patterns (6). Notably, the predominant presence of micropapillary and solid histological subtypes is associated with unfavorable prognostic outcomes (7). This updated classification also advocates for a comprehensive approach in diagnostic reporting, emphasizing the necessity for pathologists to delineate all present subtypes and their respective proportions, with the intent of informing treatment decisions (8). In the context of NSCLC with a diameter of 2 cm or less, cases characterized by a predominant micropapillary or solid pattern exhibit an elevated risk of recurrence following sub-lobar resection (9). Consequently, for NSCLC patients with small lesions (≤2 cm), lobectomy is recommended as a means to mitigate the risk of local recurrence. Therefore, a thorough understanding of the histologic patterns assumes paramount significance in guiding surgical strategies.
Numerous studies have undertaken the development of models aiming at predicting histologic patterns based on imaging phenotypes, employing radiomics features as their foundation (10,11). However, these endeavors have often fallen short of achieving satisfactory accuracy, and their clinical applicability remains unverified. Our hypothesis posits that artificial intelligence (AI)-assisted CT analysis could offer valuable assistance in differentiation. The primary objective of this study is to construct a deep learning algorithm and rigorously evaluate its clinical capacity to distinguish between high- or low-risk histologic patterns within invasive ADC. We present this article in accordance with the TRIPOD reporting checklist (available at https://tlcr.amegroups.com/article/view/10.21037/tlcr-24-258/rc) (12).
Methods
Study design and population
The study was conducted in accordance with the Declaration of Helsinki (as revised in 2013). The study was approved by Institutional Ethics Board of the First Affiliated Hospital of Guangzhou Medical University (IRB number: 2022 NO.70) and individual consent for this study was waived due to its retrospective nature. All participating hospitals were informed and agreed the study. The deep learning pipeline employed in this research comprised two essential components: (I) an automatic segmentation model; (II) a pathological patterns classification model to ensure adherence to proper reporting standards.
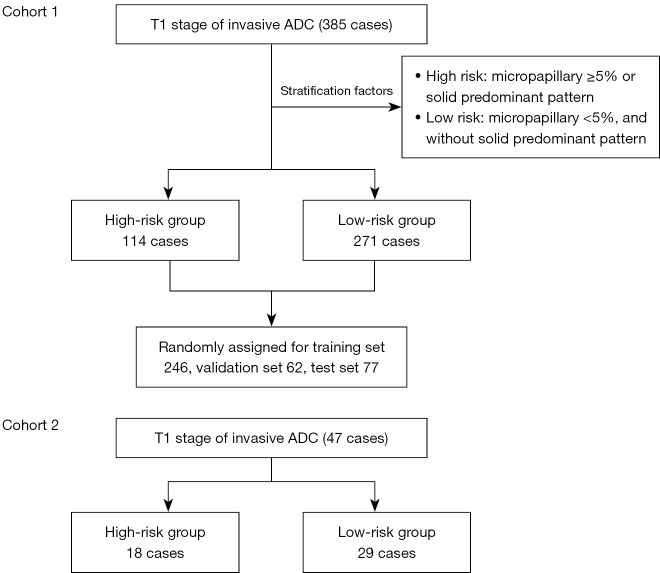
This study comprised two retrospective cohorts. Cohort 1 consisted of consecutive ADC patients recruited from the First Affiliated Hospital of Guangzhou Medical University between January 6th, 2020 and January 6th, 2021. This group served as the construction and test cohort. Cohort 2 encompassed consecutive ADC patients from Jieyang People’s Hospital during the same period, and was utilized for external testing and for comparing results with human experts and AI algorithms. The inclusion criteria for patients were as follows: (I) age ≥18 years; (II) pathological diagnosis of invasive ADC; (III) presence of a lesion presenting as a pulmonary nodule on thin-slice CT images; (IV) nodule size ≤3 cm; (V) the maximal time interval between CT scan and surgical resection are less than 1 month. Exclusion criteria encompassed the presence of multiple pulmonary nodules, pleural or mediastinal adhesions, previous systemic treatments, and incomplete imaging records. Figure 1 provides a succinct summary of the population inclusion flowchart.
Figure 1.
The patient inclusion of study. ADC, lung adenocarcinoma.
Electronic medical records (EMR) were systematically searched to extract pertinent patient information, including gender, age, lesion size, date of surgery, and the final pathology diagnosis. Postoperative pathological patterns and risk group categorizations were conducted in accordance with the 2015 WHO classification and the recommendations put forth by the International Association for the Study of Lung Cancer (IASLC) pathology committee (6,13). Patients were stratified into two risk groups according to IASLC/American Thoracic Society (ATS)/European Respiratory Society (ERS) classification of lung ADC and previous studies (14-16). High-risk group: comprising cases with a micropapillary component ≥5% or a predominant solid pattern. Low-risk group: encompassing cases with a micropapillary component <5% and an absence of a predominant solid pattern.
Image annotation and preprocessing
Following surgical procedures, all specimens were meticulously examined and diagnosed with pathological pattern labels. The initial diagnosis was conducted by a board-certified pathologist and subsequently validated by another board-certified pathologist at each participating hospital. In cases of any disagreement, a consensus was reached through consultation with an additional board-certified pathologist. For the meticulous delineation of nodule boundaries in CT images, a board-certified thoracic surgeon performed manual segmentation. Subsequently, this segmentation was subjected to confirmation by another board-certified thoracic surgeon.
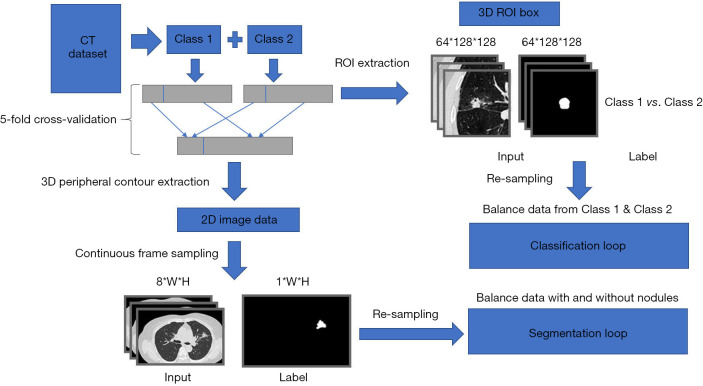
The data set preparation encompassed two distinct stages: a segmentation process and a classification process. Initially, all CT scans were categorized into either high-risk or low-risk classes based on the histologic pattern of pulmonary nodules. Subsequently, we adhered to a 4:1 ratio to delineate the training and validation sets, implementing five rounds of cross-validation. In this context, each CT image and its corresponding annotations were handled individually.
For the segmentation learning phase, all CT images were partitioned into eight layers of 512×512 continuous images. The use of continuous images offered a more comprehensive and robust representation of three-dimensional (3D) information compared to individual images. In the classification phase, we determined the nodule’s center based on the label and employed a 64×128×128 cube to encapsulate this region in the CT images, denoting it as the region of interest (ROI). These ROIs were paired with their corresponding labels and utilized as inputs for the classification network. As a final step, all inputs underwent oversampling to balance the number of positive and negative samples. The comprehensive workflow is illustrated in Figure 2.
Figure 2.
The work flow and design of the whole deep learning pipeline. CT, computed tomography; ROI, region of interest; W, width; H, height.
CT image pixel preprocessing
The preprocessing workflow for the original CT data can be succinctly outlined as follows: (I) window width and level adjustment: initially, the CT image underwent window width and bed position adjustment to align with the lung window. All pixel values were transformed using the formula: new_pixel_value = [clip (original_pixel_value, −1,250, 250) + 1,250]/1,500×255; where clip (x, a, b) clips the value x to the range [a, b]. (II) Removal of nonessential information (CT bed): excessive nonessential information can have adverse effects on classification results. To address this, we employed contour detection to extract the largest connected contour encompassing the entire CT image, and subsequently set all pixels outside this contour to zero. (III) Denoising: CT images acquired from different brands and ages of CT machines may exhibit slight variations, particularly in terms of image noise. While these differences may appear negligible to the naked eye, they can significantly impact deep learning research in computer-based analysis. Consequently, denoising CT images represents a critical step. In this regard, we utilized a 3×3 kernel Gaussian filter (17), to balance noise levels in CT images while preserving the original information. (IV) Normalization and standardization: the final step in data preprocessing follows the conventional image processing approach, which involves mapping all pixel values from the range of 0 to 255 to a range between −1 and 1. This transformation is achieved using the formula (all pixels/255 − 0.5)/0.5.
Model development for lesion segmentation
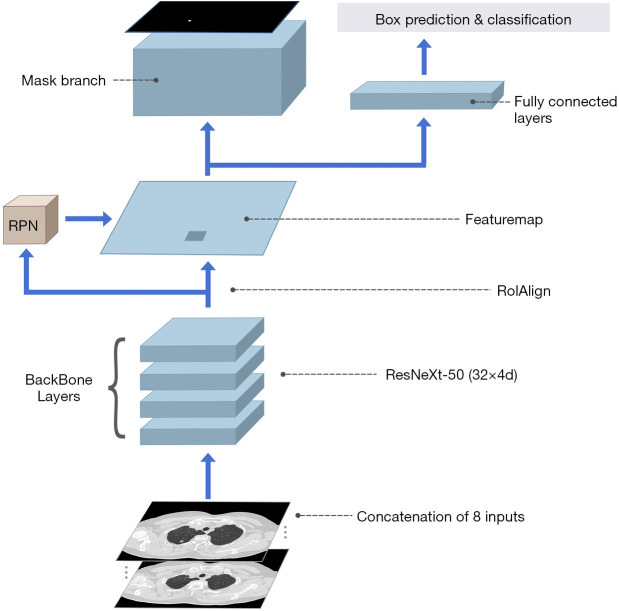
The overarching segmentation model was adapted based on the Mask Region-based Convolutional Neural Network (Mask-RCNN) framework (18). To effectively capture continuous information across the entire image, we selected Residual Network 50 (ResNeXt-50) (32×4d) (19) as the backbone architecture. To enhance continuity, an 8-layer sequence was introduced at the input stage. This choice was informed by the requirement that the number of groups for group-convolution in the backbone layers of the subsequent deep learning algorithm network should be a multiple of 4. Initializing the input as a multiple of 4 promotes faster learning, but excessive input layers can introduce an imbalance between positive and negative pixel samples, thus diminishing network efficiency. Consequently, a balance was struck, and eight layers were chosen as the optimal number of segmentation input layers. Given the relatively small size of lung nodules, we further reduced the size of anchors in the region proposal network (RPN) (20) to enhance performance in detecting small targets. The overall structure of the segmentation network is depicted in Figure 3.
Figure 3.
The work flow and design of auto-segmentation algorithm. RPN, region proposal network; ResNeXt-50, Residual Network 50.
Training details:
❖ Batch size: 32;
❖ nput channels: 8;
❖ Optimizer: stochastic gradient descent (learning rate =5e−4, momentum =0.9, weight decay =0.0001);
❖ Learning rate scheduler: CosineAnnealing (Tmax =50).
Model development for pathological pattern classification based on CT
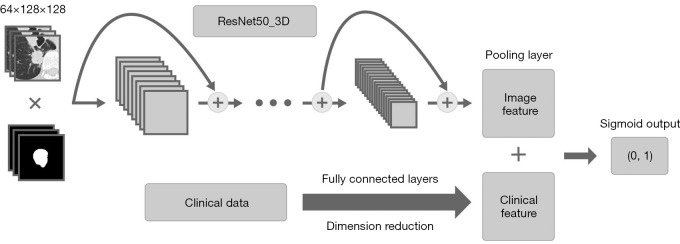
The first stage involves encoding the CT image data along with the corresponding clinical data. For encoding CT images, we employed Residual Network 50 (ResNet50)_3D, which utilizes a 4-dimensional convolution kernel to process continuous images across four dimensions, including the number of layers, single layer thickness, length, and width. Compared to 3D convolution kernels, this approach yields superior results in coding the thickness dimension. However, it’s important to note that an excessive amount of input information can increase the likelihood of the network getting trapped in local minima during gradient descent updates, rendering training iterations more challenging. After comprehensive deliberation and experimentation, we adopted an input image size of 64×128×128.
Model development for pathological pattern classification based on CT and EMR data
We acknowledged the potential influence of clinical data on classification outcomes. Therefore, we designed an additional network for encoding clinical data, employing three fully connected layers for dimensionality reduction. The second stage focuses on feature fusion. We utilized two maximum pooling layers to harmonize the feature dimensions of CT image data and clinical data to a uniform size. Subsequently, we employed matrix stitching to merge these two sets of features. The final stage comprises the output layer, where we employed two fully connected layers to combine the previously merged feature sets into a single dimension. Subsequently, we applied the Sigmoid function to map the results to the 0–1 interval, with the cut-off point set at 0.5 (21). A schematic diagram of the classification network is presented in Figure 4.
Figure 4.
The work flow and design of classification algorithm. ResNeXt-50, Residual Network 50.
Training details:
-
❖ Image augmentation:
Random Gaussian Blur (limit =3);
Random Gamma [90–110];
Random Median Blur (limit =3);
Random Brightness (limit =0.3);
Random Image Quality [80–100].
❖ Batch size: 4;
❖ Input channels: 8;
❖ Feature concatenation dim: [batch-size, 2,048];
❖ Dropout rate: 0.2;
❖ Optimizer: Adam [learning rate =5e−4, betas = (0.9, 0.999)];
❖ Learning rate scheduler: CosineAnnealing (Tmax =100);
❖ Loss function: BCEloss.
Evaluation of performance and statistical analysis
Normally distributed continuous variable was expressed as mean ± standard deviation (SD). Category data were expressed as n (%). The segmentation results were evaluated by dice similarity coefficient (dice) [2 * true positive/(false positive + 2 * true positive + false negative)]. The classification results were evaluated based on the area under the curve (AUC) of receiver operating characteristic (ROC) curve, sensitivity, specificity, accuracy (true predictions/total number of cases) and F1 score. During training, we utilized 5-fold cross-validation, and the best-performing model was selected to obtain 95% confidence interval (CI) of AUC and average sensitivity, specificity and F1 score of the test set. To draw the ROC curve, the continuous predicted score (probability) of every sample was used. We deemed P values less than 0.05 to be statistically significant. Python and R (version 4.0.0) language is used for statistical analysis.
Results
Patient characteristics and model design
This study encompassed a total of 432 patients, with 385 cases falling within cohort 1 and 47 cases within cohort 2. The average diameter of pulmonary nodules in cohort 1 and cohort 2 was recorded as 1.78±0.611 and 1.71±0.628 cm, respectively. In cohort 1, the proportion of high-risk patients stood at 29.61%, while cohort 2 exhibited a ratio of 36.00%. The deep learning model performed two critical functions: lesion segmentation and classification. The data utilization and algorithmic processes are succinctly summarized in Figures 1,2.
Deep learning assisted lesion segmentation
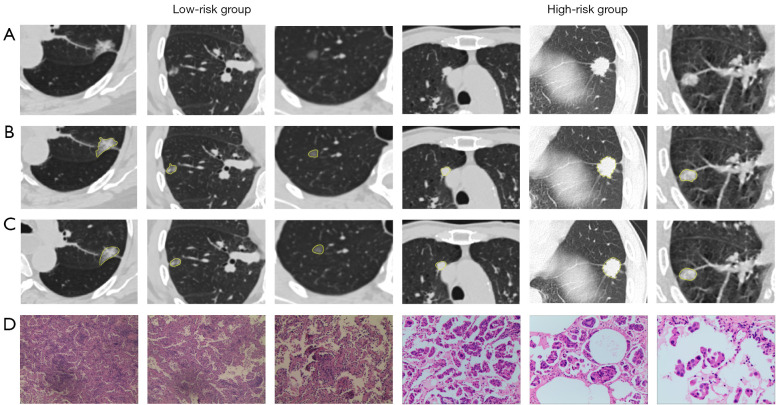
In the case of cohort 1, we partitioned the test set into 20%, while the remaining portion was further divided into a training set and a validation set at a ratio of 4:1. The specific breakdown of numbers was as follows: the training set consisted of 246 samples, the validation set comprised 62 samples, and the test set encompassed 77 samples. Our auto-segmentation model exhibited a remarkable level of agreement with manual segmentation performed by human experts, as illustrated in Figure 5. The mean dice coefficient was calculated at 0.86 (95% CI: 0.85–0.87), indicating a high level of consistency. Additionally, it demonstrates that the model’s stability had plateaued by the 67th epoch (Figure 6). The average time required for segmentation was 15.00±5.01 seconds.
Figure 5.
The performance of auto-segmentation deep learning model; the sections were stained as hematoxylin-eosin staining in 5× magnification (low-risk group D) and 10× magnification (high-risk group D). (A) The original CT scan of the nodules; (B) the CT segmentation by radiologists; (C) the CT segmentation by deep learning algorithm; (D) the corresponding pathological performance of the CT scan. CT, computed tomography.
Figure 6.
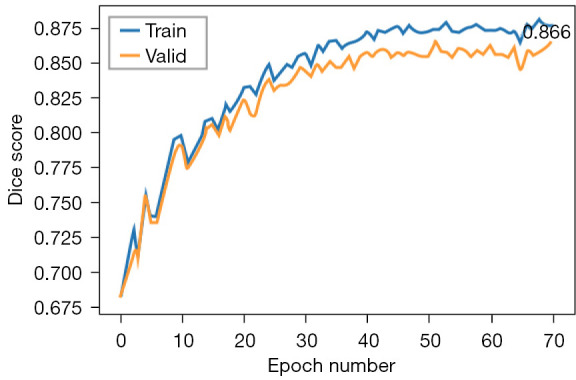
Dice on validation data set changing with training epochs.
To assess the model’s generalizability, we recruited cohort 2 as the external test cohort. Within cohort 2, the auto-segmentation model continued to exhibit a high level of consistency with manual segmentation performed by human experts, as evidenced by a dice coefficient of 0.84 (95% CI: 0.82–0.85).
Deep learning assisted lesion classification
In the test group of cohort 1, the deep learning model exhibited the ability to distinguish the high-risk group from the low-risk group, achieving a sensitivity of 0.89 (95% CI: 0.88–0.89), a specificity of 0.71 (95% CI: 0.68–0.74), an AUC of 0.89 (95% CI: 0.88–0.90) (Figure 7), and an f1 score of 0.83 (95% CI: 0.82–0.86). Furthermore, the classification accuracy was measured at 0.86 (95% CI: 0.85–0.87). The average time required for classification was 0.05±0.01 seconds.
Figure 7.
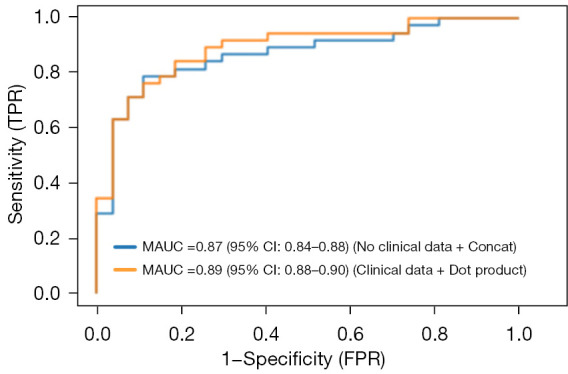
Performance of the deep learning algorithm for classifying high- and low-risk lung adenocarcinoma based on CT in test group of cohort 1 and cohort 2; orange curve represents the AUC of cohort 2 while the blue curve represents the AUC of cohort 1. MAUC, mean area under the curve; CI, confidence interval; TPR, true positive rate; FPR, false positive rate; CT, computed tomography; AUC, area under the curve.
In cohort 2, the model effectively differentiated the high-risk group from the low-risk group, achieving a sensitivity of 0.83 (95% CI: 0.81–0.84), a specificity of 0.70 (95% CI: 0.69–0.72), an AUC of 0.87 (95% CI: 0.84–0.88) (Figure 7), and an f1 score of 0.82 (95% CI: 0.80–0.84). The average diagnostic time was 16.00±3.2 seconds, and the classification accuracy was 0.82 (95% CI: 0.81–0.83).
Ablation study
To assess the impact of incorporating additional electronic health records (EHRs) on diagnostic performance, we conducted an analysis of patient clinical features using a fully connected layer within the deep learning model. Furthermore, we performed ablation comparison experiments to ascertain the utility of this module.
The first experiment involved the exclusion of clinical information, with the input terminal using a concatenation method to merge the original CT image and annotations. In the second experiment, clinical information was integrated, and the input terminal employed element-wise multiplication to combine the original CT image with the labels, focusing solely on central information. In the third experiment, both clinical information and the merging input approach were employed simultaneously.
In the test set of cohort 1, the median AUC values from five cross-validation runs were computed for each of the three experiments, yielding results of 0.87, 0.89, and 0.90 (Figure 8). A comparison between experiment 1 and experiment 3 revealed that clinical information remains beneficial for enhancing deep learning classification results with significant enhanced AUC performance of 3% (0.87 vs. 0.90, P=0.007). Similarly, comparing experiment 2 and experiment 3 demonstrated that by incorporating the merging input approach, the network could learn contextual information surrounding the nodules. However, it should be noted that the AUC improvement under this condition remained relatively modest with enhanced AUC performance of 1% (0.89 vs. 0.90, P=0.24).
Figure 8.
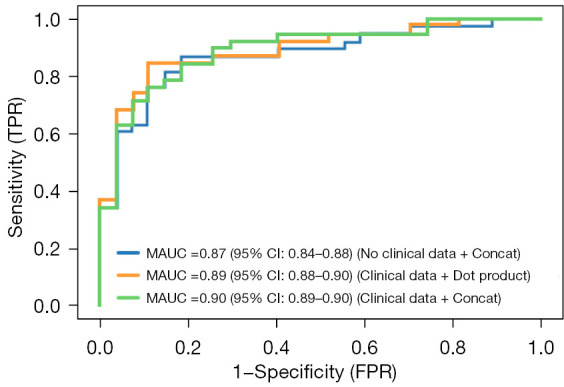
Performance of the deep learning algorithm for classifying high- and low-risk lung adenocarcinoma based on CT and EMR data in test set of cohort 1. MAUC, mean area under the curve; CI, confidence interval; TPR, true positive rate; FPR, false positive rate; CT, computed tomography; EMR, electronic medical records.
Discussion
With the increased utilization of low-dose spiral CT in early lung cancer screening, the detection of stage IA lung cancer has become more prevalent. Given that distinct histological patterns offer significant insights into patient prognosis and survival, the identification of histology subtypes is crucial for tailoring treatments (22). Determining histological subtypes should ideally occur intraoperatively or before surgery to inform surgical planning decisions, such as limited section or lobectomy, as well as the consideration of lymph node sampling or complete lymphadenectomy (23,24). Unfortunately, accurately diagnosing histological subtypes of ADC on intraoperative frozen sections is a challenging task fraught with potential errors. Therefore, the development of alternative methods for preoperative histologic examination becomes paramount for informed surgical planning and postoperative treatment. In this study, we have introduced an AI model designed to automatically segment nodules and preoperatively classify pathological patterns. Our findings indicate that the model’s performance is not only satisfactory but also highly accurate.
Traditionally, the assessment of histological patterns in lung ADC relied on preoperative evaluation using CT or positron emission tomography (PET)-CT images, often based on the expertise of human experts. Several studies have proposed that the progression of histological subtypes in lung ADC, from low to high risk, is closely linked to changes in tumor size. Specifically, it is observed that the larger the tumor, the more advanced the histopathological subtype becomes (25). Additionally, the consolidation tumor ratio (CTR) is a commonly utilized feature to describe the solid component of early lung ADCs. Eriguchi et al. (26), for instance, have demonstrated the ability to distinguish between low- and high-risk cases by incorporating CTR, maximum standard uptake value (SUVmax), and CT values. In practical clinical scenarios, pulmonary nodules often exhibit irregular shapes. Relying solely on the maximum axial diameter of the lesion to characterize tumor size may have limitations. In contrast, deep learning models incorporate a more comprehensive set of information during the classification process, surpassing the capabilities of traditional methods and radiomics analyses.
Intraoperative frozen section analysis has been employed to evaluate the pathological patterns in ADC; however, its accuracy and time consumption have been less than satisfactory (27). While there has been study that have successfully employed frozen sections to determine tissue subtypes (28), these typically involve the analysis of only 1 to 2 slices from the entire tumor. In contrast, CT imaging stands as the sole method capable of non-invasively detecting the entire tumor. Additionally, intraoperative frozen section analysis typically necessitates a time investment of approximately half an hour to an hour to yield results, which is deemed too lengthy for a patient under anesthesia. Our study demonstrates that the deep learning tool can proficiently classify histological patterns with a high degree of accuracy within a mere half-minute interval before surgery. This valuable information equips surgeons with essential insights when formulating their surgical plans. By offering surgeons a pre-resection assessment, they can make more informed decisions, such as opting for lobectomy over sub-lobar resection if the nodule is classified as high-risk. Simultaneously, this tool serves as a reminder to pathologists, motivating them to diligently seek evidence of high-risk patterns during their diagnostic evaluations.
Several studies have explored the application of AI in the preoperative discrimination of lung invasive ADC. For instance, Fan et al. (29) identified a radiomics signature that allows for the preoperative discrimination of lung invasive ADCs from non-invasive lesions manifesting as ground-glass nodules. This radiomics signature demonstrated a strong ability to differentiate between invasive ADCs and non-invasive lesions, achieving accuracy rates of 86.3%. In another study, Wang et al. (30) investigated imaging phenotyping by combining radiomics with deep learning to predict high-grade patterns within lung ADCs. This study included 111 patients who were identified as having ground-glass opacities The proposed method achieved an overall accuracy of 0.913. Compared to other studies, our multi-center research with bigger sample size has validated the generalization of the model to a certain extent. Additionally, the application of deep learning has improved the accuracy of previous radiomics-based studies. Finally, the incorporation of EHR information has allowed our multimodal model to be the first to verify whether EHR data has additional significance in this context.
We acknowledge several limitations in this study. Firstly, the sample size was constrained, warranting cautious interpretation of the findings. Secondly, the absence of prospective validation involving human experts could introduce potential biases. Thirdly, the reliance on single-center data during model training limits its generalizability to broader patient populations. Lastly, it is imperative to exercise caution regarding patient data privacy considerations when deploying the model.
Conclusions
We have developed a deep learning algorithm designed to automatically segment pulmonary nodules and predict high-risk histological patterns in early-stage lung ADC from CT scans. This deep learning pipeline represents a robust, non-invasive, cost-effective, and repeatable approach for preoperative detection and prediction in early-stage lung ADC patients. Using recent AI technologies such as federated learning and large models can potentially improve the data sharing security and increase the accuracy of our models. In the future, we still need to incorporate more centralized data to enhance the generalization of the model.
Supplementary
The article’s supplementary files as
Acknowledgments
The abstract of this study has been presented on the 104th Annual Meeting of AATS (Metro Toronto Convention Center, Toronto, ON, Canada).
Funding: This study was supported by National Key Research and Development Program of China (No. 2022YFB4702600), the Zhongnanshan Medical Foundation of Guangdong Province (No. ZNSA-2021008), and Guangdong High Level Hospital Construction “Reaching Peak” Plan.
Ethical Statement: The authors are accountable for all aspects of the work in ensuring that questions related to the accuracy or integrity of any part of the work are appropriately investigated and resolved. The study was conducted in accordance with the Declaration of Helsinki (as revised in 2013). The study was approved by institutional ethics board of the First Affiliated Hospital of Guangzhou Medical University (IRB number: 2022 NO.70) and individual consent for this study was waived due to its retrospective nature. All participating hospitals were informed and agreed the study.
Footnotes
Reporting Checklist: The authors have completed the TRIPOD reporting checklist. Available at https://tlcr.amegroups.com/article/view/10.21037/tlcr-24-258/rc
Conflicts of Interest: All authors have completed the ICMJE uniform disclosure form (available at https://tlcr.amegroups.com/article/view/10.21037/tlcr-24-258/coif). The authors have no conflicts of interest to declare.
Data Sharing Statement
Available at https://tlcr.amegroups.com/article/view/10.21037/tlcr-24-258/dss
References
- 1.Sung H, Ferlay J, Siegel RL, et al. Global Cancer Statistics 2020: GLOBOCAN Estimates of Incidence and Mortality Worldwide for 36 Cancers in 185 Countries. CA Cancer J Clin 2021;71:209-49. 10.3322/caac.21660 [DOI] [PubMed] [Google Scholar]
- 2.National Lung Screening Trial Research Team , Aberle DR, Adams AM, et al. Reduced lung-cancer mortality with low-dose computed tomographic screening. N Engl J Med 2011;365:395-409. 10.1056/NEJMoa1102873 [DOI] [PMC free article] [PubMed] [Google Scholar]
- 3.Pastorino U, Silva M, Sestini S, et al. Prolonged lung cancer screening reduced 10-year mortality in the MILD trial: new confirmation of lung cancer screening efficacy. Ann Oncol 2019;30:1162-9. 10.1093/annonc/mdz117 [DOI] [PMC free article] [PubMed] [Google Scholar]
- 4.Suzuki K, Watanabe SI, Wakabayashi M, et al. A single-arm study of sublobar resection for ground-glass opacity dominant peripheral lung cancer. J Thorac Cardiovasc Surg 2022;163:289-301.e2. 10.1016/j.jtcvs.2020.09.146 [DOI] [PubMed] [Google Scholar]
- 5.Saji H, Okada M, Tsuboi M, et al. Segmentectomy versus lobectomy in small-sized peripheral non-small-cell lung cancer (JCOG0802/WJOG4607L): a multicentre, open-label, phase 3, randomised, controlled, non-inferiority trial. Lancet 2022;399:1607-17. 10.1016/S0140-6736(21)02333-3 [DOI] [PubMed] [Google Scholar]
- 6.Travis WD, Brambilla E, Burke AP, et al. editors WHO classification of tumours of the lung, pleura, thymus and heart, 4th edition. Lyon: International Agency for Research on Cancer; 2015. [DOI] [PubMed] [Google Scholar]
- 7.Mikubo M, Tamagawa S, Kondo Y, et al. Micropapillary and solid components as high-grade patterns in IASLC grading system of lung adenocarcinoma: Clinical implications and management. Lung Cancer 2024;187:107445. 10.1016/j.lungcan.2023.107445 [DOI] [PubMed] [Google Scholar]
- 8.Xing X, Li L, Sun M, et al. A combination of radiomic features, clinic characteristics, and serum tumor biomarkers to predict the possibility of the micropapillary/solid component of lung adenocarcinoma. Ther Adv Respir Dis 2024;18:17534666241249168. 10.1177/17534666241249168 [DOI] [PMC free article] [PubMed] [Google Scholar]
- 9.Li R, Li Z, Yang Z, et al. The presence of micropapillary and/or solid subtypes is an independent prognostic factor for patients undergoing curative resection for stage I lung adenocarcinoma with ground-glass opacity. Transl Lung Cancer Res 2024;13:256-68. 10.21037/tlcr-23-736 [DOI] [PMC free article] [PubMed] [Google Scholar]
- 10.Huo J, Min X, Luo T, et al. Computed tomography-based 3D convolutional neural network deep learning model for predicting micropapillary or solid growth pattern of invasive lung adenocarcinoma. Radiol Med 2024;129:776-84. 10.1007/s11547-024-01800-3 [DOI] [PMC free article] [PubMed] [Google Scholar]
- 11.Ding H, Xia W, Zhang L, et al. CT-Based Deep Learning Model for Invasiveness Classification and Micropapillary Pattern Prediction Within Lung Adenocarcinoma. Front Oncol 2020;10:1186. 10.3389/fonc.2020.01186 [DOI] [PMC free article] [PubMed] [Google Scholar]
- 12.Collins GS, Reitsma JB, Altman DG, et al. Transparent Reporting of a multivariable prediction model for Individual Prognosis or Diagnosis (TRIPOD): the TRIPOD statement. Ann Intern Med 2015;162:55-63. 10.7326/M14-0697 [DOI] [PubMed] [Google Scholar]
- 13.Moreira AL, Ocampo PSS, Xia Y, et al. A Grading System for Invasive Pulmonary Adenocarcinoma: A Proposal From the International Association for the Study of Lung Cancer Pathology Committee. J Thorac Oncol 2020;15:1599-610. 10.1016/j.jtho.2020.06.001 [DOI] [PMC free article] [PubMed] [Google Scholar]
- 14.Huang W, Zhang H, Zhang Z, et al. A prognostic nomogram based on a new classification of combined micropapillary and solid components for stage IA invasive lung adenocarcinoma. J Surg Oncol 2022;125:796-808. 10.1002/jso.26760 [DOI] [PubMed] [Google Scholar]
- 15.Hung JJ, Jeng WJ, Chou TY, et al. Prognostic value of the new International Association for the Study of Lung Cancer/American Thoracic Society/European Respiratory Society lung adenocarcinoma classification on death and recurrence in completely resected stage I lung adenocarcinoma. Ann Surg 2013;258:1079-86. 10.1097/SLA.0b013e31828920c0 [DOI] [PubMed] [Google Scholar]
- 16.Travis WD, Brambilla E, Noguchi M, et al. International Association for the Study of Lung Cancer/American Thoracic Society/European Respiratory Society: international multidisciplinary classification of lung adenocarcinoma: executive summary. Proc Am Thorac Soc 2011;8:381-5. 10.1513/pats.201107-042ST [DOI] [PubMed] [Google Scholar]
- 17.Shreyamsha Kumar BK. Image denoising based on gaussian/bilateral filter and its method noise thresholding. Signal Image Video Process 2013;7:1159-72. 10.1007/s11760-012-0372-7 [DOI] [Google Scholar]
- 18.He K, Gkioxari G, Dollar P, et al. Mask R-CNN. IEEE Trans Pattern Anal Mach Intell 2020;42:386-97. 10.1109/TPAMI.2018.2844175 [DOI] [PubMed] [Google Scholar]
- 19.Xie S, Girshick R, Dollár P, et al. Aggregated Residual Transformations for Deep Neural Networks. 2017 IEEE Conference on Computer Vision and Pattern Recognition (CVPR); 21-26 July 2017; Honolulu, HI, USA. IEEE; 2017. [Google Scholar]
- 20.Ren S, He K, Girshick R, et al. Faster R-CNN: Towards Real-Time Object Detection with Region Proposal Networks. IEEE Trans Pattern Anal Mach Intell 2017;39:1137-49. 10.1109/TPAMI.2016.2577031 [DOI] [PubMed] [Google Scholar]
- 21.Zhou H, Watson M, Bernadt CT, et al. AI-guided histopathology predicts brain metastasis in lung cancer patients. J Pathol 2024;263:89-98. 10.1002/path.6263 [DOI] [PMC free article] [PubMed] [Google Scholar]
- 22.Fu Z, Shen X, Deng C, et al. Prediction of the pathological subtypes by intraoperative frozen section for patients with cT1N0M0 invasive lung adenocarcinoma (ECTOP-1015): a prospective multi-center study. Int J Surg 2024. [Epub ahead of print]. doi: . 10.1097/JS9.0000000000001667 [DOI] [PMC free article] [PubMed] [Google Scholar]
- 23.Ye T, Wu H, Wang S, et al. Radiologic Identification of Pathologic Tumor Invasion in Patients With Lung Adenocarcinoma. JAMA Netw Open 2023;6:e2337889. 10.1001/jamanetworkopen.2023.37889 [DOI] [PMC free article] [PubMed] [Google Scholar]
- 24.Jiang C, Zhang Y, Fu F, et al. A Shift in Paradigm: Selective Lymph Node Dissection for Minimizing Oversurgery in Early Stage Lung Cancer. J Thorac Oncol 2024;19:25-35. 10.1016/j.jtho.2023.09.1443 [DOI] [PubMed] [Google Scholar]
- 25.Li M, Wang J, Bao X, et al. Minor (≤ 10%) Ground-Glass Opacity Component in Clinical Stage I Non-Small Cell Lung Cancer: Associations With Pathologic Characteristics and Clinical Outcomes. AJR Am J Roentgenol 2024. [Epub ahead of print]. doi: . 10.2214/AJR.24.31283 [DOI] [PubMed] [Google Scholar]
- 26.Eriguchi D, Shimada Y, Imai K, et al. Predictive accuracy of lepidic growth subtypes in early-stage adenocarcinoma of the lung by quantitative CT histogram and FDG-PET. Lung Cancer 2018;125:14-21. 10.1016/j.lungcan.2018.08.027 [DOI] [PubMed] [Google Scholar]
- 27.Dong J, Chen Y, Qian W, et al. Sub-lobar resection versus lobectomy for challenging intraoperative frozen sections in lung adenocarcinoma within 3 cm. Asian J Surg 2024. [Epub ahead of print]. doi: . 10.1016/j.asjsur.2024.05.002 [DOI] [PubMed] [Google Scholar]
- 28.Zhao ZR, Lau RWH, Long H, et al. Novel method for rapid identification of micropapillary or solid components in early-stage lung adenocarcinoma. J Thorac Cardiovasc Surg 2018;156:2310-2318.e2. 10.1016/j.jtcvs.2018.07.054 [DOI] [PubMed] [Google Scholar]
- 29.Fan L, Fang M, Li Z, et al. Radiomics signature: a biomarker for the preoperative discrimination of lung invasive adenocarcinoma manifesting as a ground-glass nodule. Eur Radiol 2019;29:889-97. 10.1007/s00330-018-5530-z [DOI] [PubMed] [Google Scholar]
- 30.Wang X, Zhang L, Yang X, et al. Deep learning combined with radiomics may optimize the prediction in differentiating high-grade lung adenocarcinomas in ground glass opacity lesions on CT scans. Eur J Radiol 2020;129:109150. 10.1016/j.ejrad.2020.109150 [DOI] [PubMed] [Google Scholar]


