

Abstract
The intrinsic mechanisms that regulate neurotoxic versus neuroprotective astrocyte phenotypes and their effects on central nervous system degeneration and repair remain poorly understood. Here we show that injured white matter astrocytes differentiate into two distinct C3-positive and C3-negative reactive populations, previously simplified as neurotoxic (A1) and neuroprotective (A2)1,2, which can be further subdivided into unique subpopulations defined by proliferation and differential gene expression signatures. We find the balance of neurotoxic versus neuroprotective astrocytes is regulated by discrete pools of compartmented cyclic adenosine monophosphate derived from soluble adenylyl cyclase and show that proliferating neuroprotective astrocytes inhibit microglial activation and downstream neurotoxic astrocyte differentiation to promote retinal ganglion cell survival. Finally, we report a new, therapeutically tractable viral vector to specifically target optic nerve head astrocytes and show that raising nuclear or depleting cytoplasmic cyclic AMP in reactive astrocytes inhibits deleterious microglial or macrophage cell activation and promotes retinal ganglion cell survival after optic nerve injury. Thus, soluble adenylyl cyclase and compartmented, nuclear- and cytoplasmic-localized cyclic adenosine monophosphate in reactive astrocytes act as a molecular switch for neuroprotective astrocyte reactivity that can be targeted to inhibit microglial activation and neurotoxic astrocyte differentiation to therapeutic effect. These data expand on and define new reactive astrocyte subtypes and represent a step towards the development of gliotherapeutics for the treatment of glaucoma and other optic neuropathies.
Understanding the molecular and cellular pathways that regulate the balance of protective and harmful astrocyte reactivity remains a major goal in basic and translational neuroscience. In the central nervous system (CNS), the interactions of reactive astrocytes with microglia, neurons and peripheral cells strongly influence the extent of neurodegeneration and repair3. The nature of the underlying insult—for example neuroinflammatory versus ischaemic —regulates reactive astrogliosis responsible for neuronal recovery versus loss of function, previously simplified to neurotoxic (so-called A1) and neuroprotective (so-called A2) reactive astrocytes1. Neurotoxic astrocytes defined by expression of complement component C3 promote lipid-mediated neuronal death induced by activated microglia2,4. In contrast, neuroprotective C3-negative astrocytes are thought to promote neuronal survival and regeneration through upregulation and release of neurotrophic factors and other signalling molecules, as yet poorly defined5. It has been suggested that reactive astrocytes diversify beyond these two simplified states6 but this has not yet been addressed experimentally.
Some distinctions between neuroprotective and neurotoxic astrocyte phenotypes have been identified, including the generation of a glial scar that sequesters inflammatory and neurodegenerative processes in the CNS7,8. Few data link molecular pathways in astrocyte subtypes to these cellular phenotypes, although STAT3 signalling in vivo9 and cyclic adenosine monophosphate (cAMP) signalling in vitro and in vivo have been implicated in some glial-specific functions such as proliferation, differentiation, astrocyte–neuron coupling and vulnerability to oxidative stress10–12. Compartmentation of cAMP plays a critical role in CNS response to injury13–15 and we recently reported that compartmented perinuclear cAMP16 and soluble adenylyl cyclase (sAC)17 promote retinal ganglion cell (RGC) survival and growth after retinal injury, although the relevance of these pathways to glial cells remains unexplored.
The visual system serves as a useful model to investigate the mechanisms that regulate astrocyte reactivity owing to its well-characterized structure, including a pure white matter tract in the optic nerve formed by centrally projecting axons of RGC neurons. This model has proven effective to study traumatic and glaucomatous optic neuropathies whose pathophysiology and progression have been associated with, and in some cases driven by, neurotoxic astrocyte reactivity4. Here, using innovative cellular, molecular and single-cell RNA sequencing (scRNA-seq) approaches we define new reactive astrocyte subtypes in vivo following optic nerve injury and address a significant question in basic and translational neuroscience by uncovering a glial–glial and glial–immune signalling axis that ultimately regulates RGC survival.
White matter astrocyte diversity after CNS injury
To directly address the question of reactive astrocyte heterogeneity after traumatic injury, we performed scRNA-seq on uninjured and crushed optic nerves 3 days after injury. All expected cell types were identified in both sample sets including astrocytes, microglia, oligodendrocytes and their precursors (OPCs), endothelial cells, pericytes and stromal cells (for example, fibroblasts)18,19 (Fig. 1a and Extended Data Fig. 1a). Using Gfap, Sox9 and Slc1a3 as pan-astrocyte markers20,21, we confirmed the identity of two distinct astrocyte populations in uninjured optic nerves, meningeal22 and quiescent fibrous (in other words, ‘resting’) white matter astrocytes, and in injured optic nerves two more putative reactive astrocyte clusters. Both reactive clusters grouped more closely to fibrous resting white matter astrocytes, whereas meningeal astrocytes did not appreciably change after injury.
Fig. 1 |. scRNA-seq shows several reactive astrocyte populations in injured optic nerves.
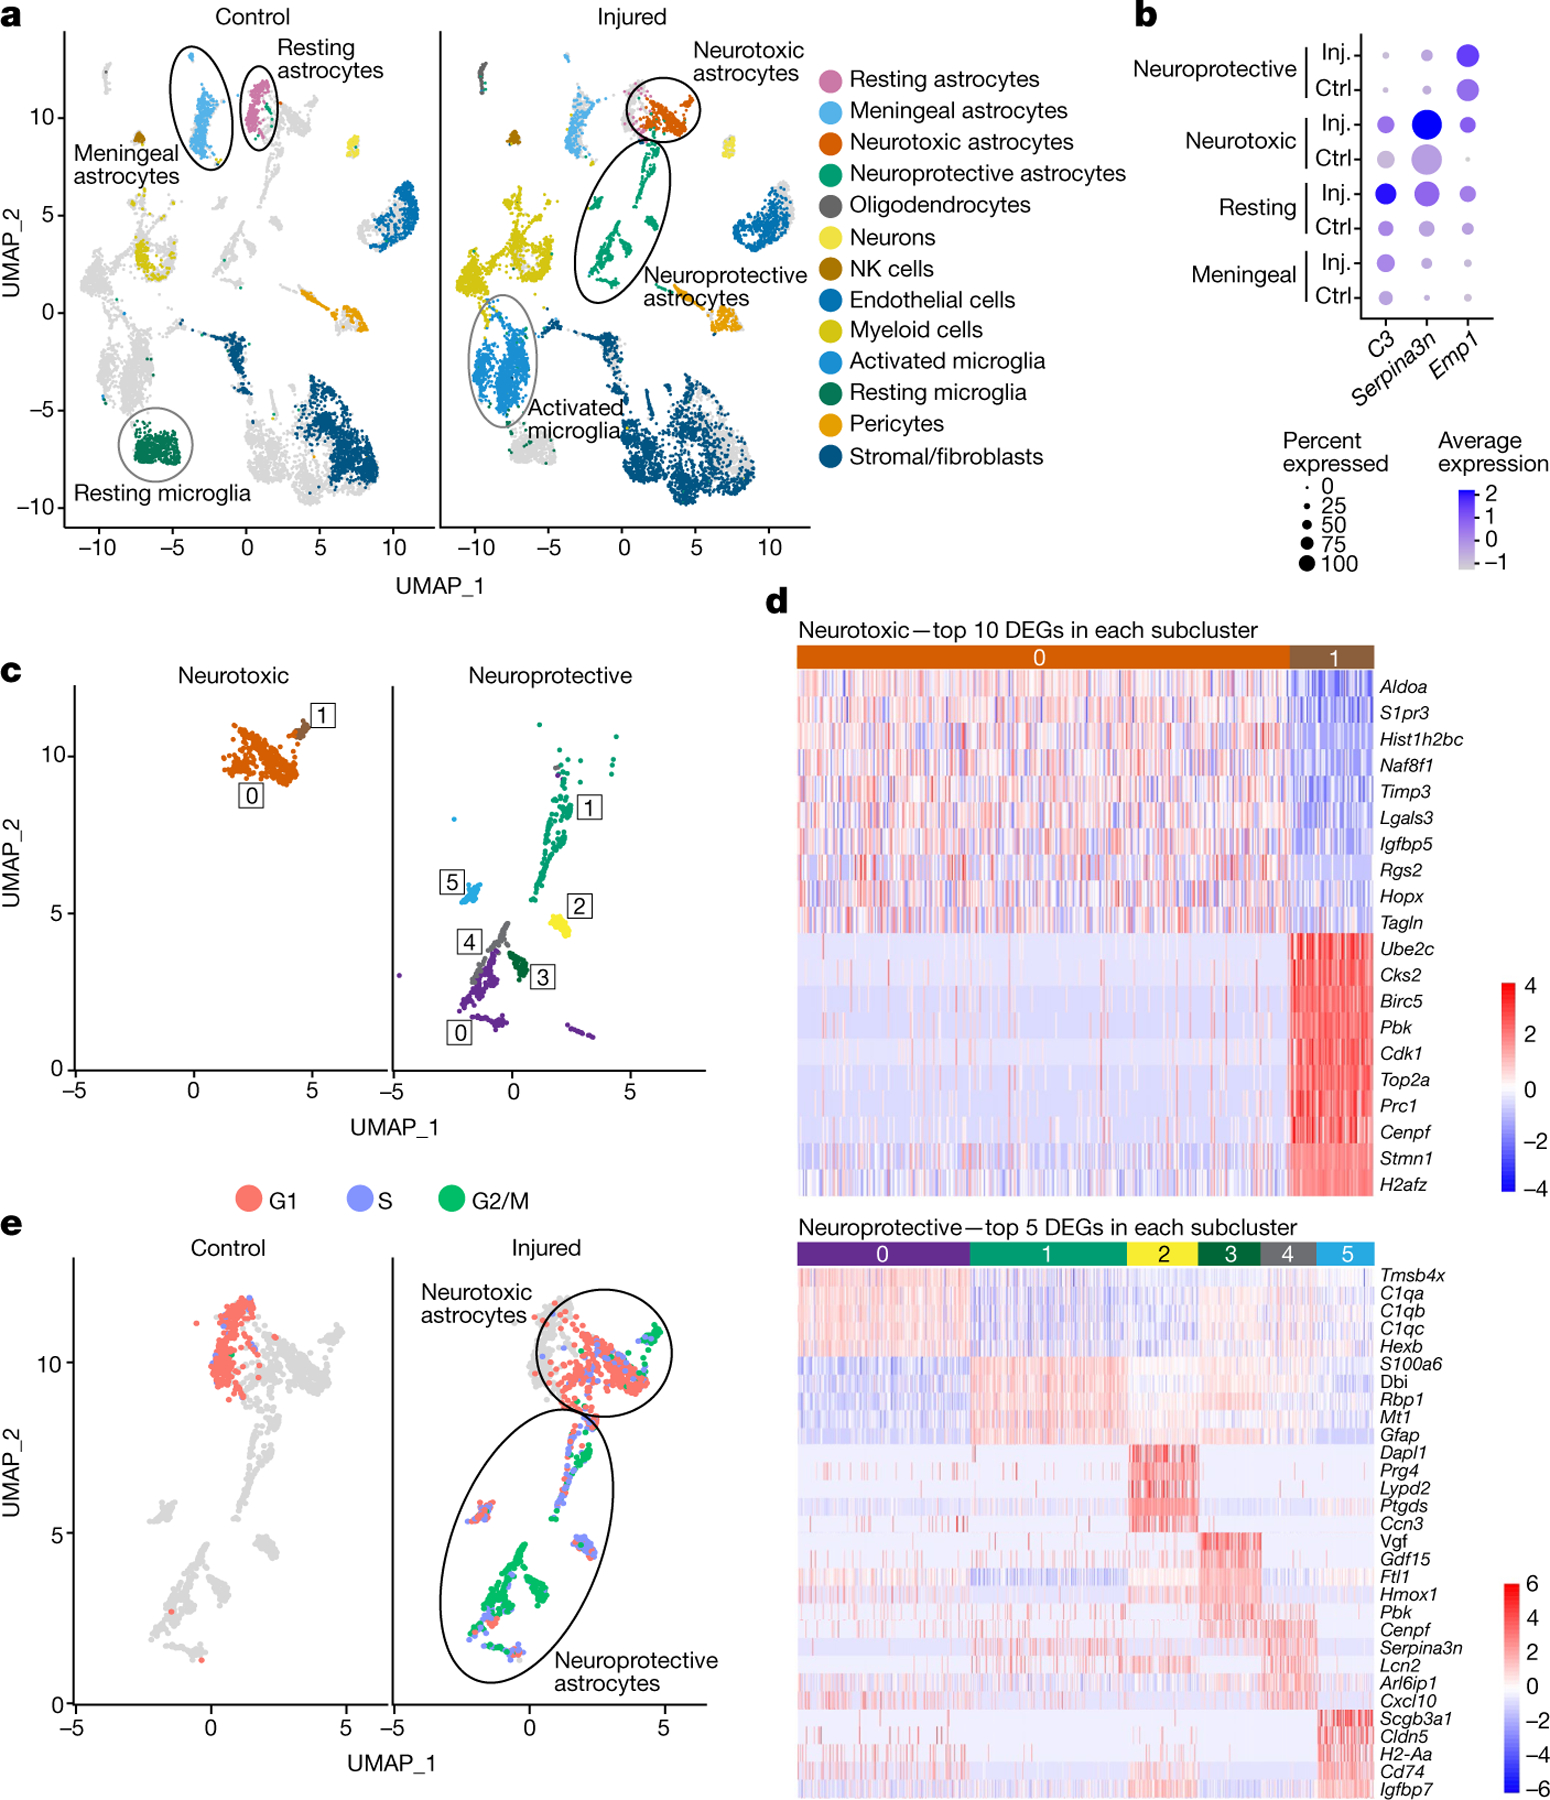
a, Uniform manifold approximation and projection (UMAP) of annotated cell clusters in uninjured and injured optic nerves shows changes in cellular composition 3 days after injury, including several reactive astrocyte populations (n = 5 mice and optic nerve pairs per condition). Clustering based on pooled control and injured cells, with grey masking showing the opposing sample’s distribution. b, Dot plots of canonical reactive astrocyte markers define C3- and Serpina3n-expressing neurotoxic and Emp1-expressing neuroprotective reactive astrocyte superclusters. Dot size indicates fraction of expressing cells and colour indicates relative mean individual cell expression. Ctrl, control; Inj., injured. c, UMAP projections of isolated neurotoxic and neuroprotective reactive astrocyte populations. Neurotoxic astrocytes split into two subclusters defined by inflammatory and proliferative markers. Neuroprotective astrocytes subdivided into six subclusters defined by cytokine and reparative marker expression. d, Top differentially expressed genes (DEGs) in isolated neurotoxic (above) and neuroprotective subclusters (below). Colour scale bar is log2 fold change. e, Astrocyte UMAP plots coloured by distribution of cells in G1, S and G2/M phase. The principal C3-positive neurotoxic astrocyte subcluster is primarily composed of non-proliferating cells. All C3-negative neuroprotective subclusters were proliferative except subcluster 5.
We next analysed cluster-specific gene expression of previously reported markers for neurotoxic (A1; for example, C3+ and Serpina3n+) and neuroprotective (A2; for example, Emp1+) reactive astrocytes1,2,4, finding that C3 and Serpina3n were highly enriched in a single reactive astrocyte supercluster and distinctly downregulated in an opposing supercluster of Emp1+ astrocytes (Fig. 1b). Thus, these markers correlate with two previously defined neurotoxic (A1) and neuroprotective (A2) reactive astrocyte populations in injured optic nerves. When we isolated and re-analysed these reactive superclusters, we found neurotoxic C3+ astrocytes split into one major and one minor subcluster, whereas neuroprotective C3− astrocytes divided into six distinct subclusters, all defined by differential gene expression (Fig. 1c,d). For example, subcluster 1 in the neuroprotective group preferentially expressed classical astrocytic markers and metallothione family members, Mt1, Mt2 and Mt3, shown to promote neuroprotection and regeneration after CNS injury23. Similarly, subcluster 3 preferentially expressed several neurotrophic factors including Vg f, GDF15 and Hmox1 associated with or shown to directly promote neuroprotection24–26. Contrary to a simplified A1/A2 division, however, neuroprotective subclusters 0, 4 and 5 were defined by expression of components of the complement pathway (C1qa, C1qb and C1qc), cytokine-family members and other immune cell-associated regulators previously linked to activation of microglia and neurotoxic astrocyte responses4. In a similar manner, the neurotoxic C3+ supercluster separated on the basis of differential expression of inflammatory and lipid signalling molecules in the major subcluster (0), versus a small second subcluster (1) expressing proliferation and wound healing-associated genes27. Thus, both C3-positive neurotoxic and C3-negative neuroprotective reactive astrocyte superclusters are composed of subclusters that define a spectrum of reactivity at the gene expression level.
Increased astrocyte proliferation has been suggested to be a marker of neuroprotective reactive phenotypes. To test this, we analysed expression of canonical cell-cycle markers, including CCND1, CDK4, CDKN1B and H3f3a, to determine cell-cycle phase (G1, S and G2/M) in control and injured datasets. As expected, virtually every cell in uninjured samples expressed G1 markers, indicating a quiescent state, whereas several cell clusters in injured optic nerve samples, including one of two microglial subsets, macrophages, fibroblasts and reactive astrocytes, had markers of S and G2/M (Extended Data Fig. 1b). Strikingly, almost all C3+ neurotoxic astrocytes were non-proliferative except for the small secondary subcluster, whereas proliferating reactive astrocytes preferentially fell into the C3− Emp1+ neuroprotective supercluster (Fig. 1e). These data point to a combination of cytokine, other inflammatory, and proliferative response gene expression markers together as important classifiers of reactive astrocyte subtypes after injury.
Soluble adenylyl cyclase is required for astrocyte proliferation
On the basis of these data we hypothesized that regulation of proliferation may be one approach to specifically promote neuroprotective astrocyte reactivity. cAMP differentially regulates cell-cycle progression in mammalian cells and is formed by enzymatic activity of a family of nine transmembrane adenylyl cyclases (tmACs) and a single soluble adenylyl cyclase (sAC). We treated primary human cortical astrocytes with the pan-tmAC inhibitor dDADO and two sAC-specific inhibitors, KH7 and 2HE, and measured proliferation by 5-ethynyl-2′-deoxyuridine (EdU) incorporation. Surprisingly, both KH7 and 2HE, but not dDADO, significantly inhibited astrocyte proliferation in a concentration-dependent manner, implicating sAC as a required source of cAMP in astrocyte proliferation (Fig. 2a,b). This observed decrease in proliferation was not the result of sAC inhibition-mediated apoptosis, as KH7 and 2HE did not induce significant astrocyte cell death at the effective concentrations (Fig. 2c). To confirm the putative role of sAC in astrocyte proliferation, we initially attempted siRNA knockdown experiments targeting all sAC isoforms in human astrocytes but were unable to effectively detect knockdown, probably as a result of a combination of extremely low expression of sAC transcripts and poor reagents available to assess human sAC. In lieu of this, we purified and transduced primary cortical sACfl/fl mouse astrocytes (containing loxP-flanked Adcy10 alleles) with lentiviral (LV)- or adeno-associated virus type 2 (AAV2)-Cre (Cre; KO) or LV-deactivated-Cre or AAV2-GFP (GFP; CTRL). Astrocyte purity was determined by immunostaining; about 99% of purified cells expressed the astrocyte-specific transcription factor Sox9 (ref. 21) and about 97% expressed the pan-astrocyte marker ALDH1L1 (ref. 20) (Extended Data Fig. 2a,b). Cre-mediated recombination of the sACfl/fl allele results in deletion of the exon encoding the second catalytic domain (C2), precluding expression of any catalytically active sAC isoform, including both the shorter ‘truncated’ (sACt) and longer ‘full-length’ (sACfull) isoforms28 (Fig. 2d). Penetrant sAC gene recombination in vitro was confirmed by quantitative polymerase chain reaction (qPCR) using primers specific for either the exon encoding the first catalytic domain (C1), present in all sAC isoforms (sACall), or an exon encoding the extended C-terminal tail, present only in sACfull (Fig. 2d,e), as well as by western blot (Extended Data Fig. 2c,d and Supplementary Fig. 1). As with pharmacological inhibition, genetic ablation of sAC significantly inhibited astrocyte proliferation (Fig. 2f,g) and this effect was probably underestimated because of incomplete transduction efficiency. Interestingly, we detected at least two sAC isoforms, sACfull and sACt, in proliferating mouse astrocytes after 15 days in vitro (15 DIV); however, with extended time in culture (30 DIV) we observed a significant decrease in sACfull messenger RNA and protein (Fig. 2e and Extended Data Fig. 2c,d). As observed after genetic ablation of sAC, the decrease of sAC seen in extended culture was also associated with a significant reduction in astrocyte proliferation (Fig. 2f,g), further implicating sACfull as a positive regulator of astrocyte cell-cycle progression.
Fig. 2 |. Soluble adenylyl cyclase regulates astrocyte proliferation.

a, Representative images of proliferating human astrocytes treated with dimethyl sulfoxide, dDADO (pan-tmAC inhibitor) and KH7 or 2HE (sAC-specific inhibitors; 10 μM each). b, KH7 and 2HE but not dDADO significantly inhibit astrocyte proliferation in a concentration-dependent manner relative to dimethyl sulfoxide (n = 3 cultures). c, KH7 and 2HE do not induce significant cell death at effective concentrations inhibiting proliferation (n = 3 cultures). Two-way analysis of variance (ANOVA) with Tukey test (b,c). d, Full-length (sACfull) and truncated sAC (sACt) isoform structure with loxP excision and qPCR primer sites marked. e, Quantification of sAC mRNA expression in cultured mouse astrocytes after 15 days in vitro (DIV), 30 DIV and sAC KO (n = 5 cultures). Mixed-effects analysis ANOVA with Sidak’s correction. f, Representative images of sACfl/fl mouse astrocyte proliferation after 15 DIV, 30 DIV and sAC KO. d/Cre, deactivated Cre. g, Quantification of astrocyte proliferation with time in culture and after sAC KO (n = 3 cultures). One-way ANOVA with uncorrected Fisher’s least significant difference. h, Relative frequency histograms of AAV2-Cre-GFP (sAC KO) and AAV2-GFP (CTRL) sACfl/fl-treated mouse astrocytes. i, sAC KO increases fraction of astrocytes in G2/M (n = 3 cultures). Two-way ANOVA with Sidak’s correction. j, Relative frequency histograms of effects of KH7 treatment on cell-cycle progression in human astrocytes. k, sAC inhibition induces G1 and G2/M cell-cycle arrest (n = 4 cultures). Two-way ANOVA with Tukey test. l, Representative images of proliferating mouse astrocytes following AAV2.shRNA-mediated p21 knockdown and dimethyl sulfoxide or KH7 treatment. m, p21 knockdown significantly inhibits KH7-induced cell-cycle arrest. One-way ANOVA with Sidak’s correction. P > 0.05 is non-significant (NS). All data shown as mean ± s.e.m. Scale bars, 50 μm (a,f), 100 μm (l). Panel d created with BioRender.com.
sAC inhibits p21-dependent cell-cycle arrest
To investigate the mechanisms underlying sAC-dependent astrocyte proliferation, we performed a propidium iodide (PI) cell-cycle analysis of sAC KO and KH7- and 2HE-treated astrocyte cultures (Extended Data Fig. 2e–h). Cre-mediated deletion of sAC in primary sACfl/fl mouse astrocytes induced significant G2/M cell-cycle arrest (Fig. 2h–i). Interestingly, asynchronous human astrocyte cultures treated with KH7 or 2HE arrested in G1, whereas cultures initially synchronized in S phase then arrested in G2/M (Fig. 2j,k and Extended Data Fig. 2i,j). These findings support a conserved mechanism of action for sAC in human and mouse astrocytes, whereby sAC regulates cell-cycle progression through canonical cell-cycle checkpoints.
We next performed bulk RNA sequencing on control dimethyl sulfoxide- and KH7-treated astrocyte cultures to identify potential reactive and cell-cycle-associated transcriptional changes induced by sAC inhibition. Pharmacologically blocking sAC function significantly induced several stress-associated pathways, including NF-Kβ, p53 and HIF-1α, and inhibited signalling associated with canonical cell-cycle checkpoints, E2F transcription and mitotic assembly (Extended Data Fig. 3a,b). Inhibiting cell-cycle progression at the level of DNA polymerase activity with aphidicolin activated and inhibited very similar pathways as sAC inhibition, pointing to possible shared checkpoint biology of sAC activity, whereas inhibiting mitosis with nocodazole induced alternative stress-associated pathways. At the single-gene level, sAC inhibition most significantly induced p21 (CDKN1A) expression (Extended Data Fig. 3c) and downregulated canonical p21-suppressed G2/M-checkpoint cell-cycle genes including cyclin B (CCNB1) and CDC25 family members (CDC25A, CDC25B, CDC25C)29 (Extended Data Fig. 3d). Together with our cell-cycle analysis, these data suggest sAC acts upstream of p21-dependent cell-cycle arrest at both G1 and G2/M checkpoints in proliferating astrocytes. Finally, to test directly the role of p21 in sAC-dependent proliferation, we assayed astrocyte proliferation following anti-p21 short hairpin RNA (shRNA)-mediated p21 depletion and KH7-mediated sAC inhibition. Consistent with p21 expression being repressed by sAC activity, p21 shRNA alone without sAC inhibition had no effect on astrocyte proliferation but p21 depletion significantly rescued KH7-inhibited astrocyte proliferation (Fig. 2l,m). Taken together, these data demonstrate that sAC activity inhibits p21-dependent cell-cycle arrest in proliferating astrocytes to enable cell-cycle progression through at least the G1 checkpoint and suggest sAC may play a larger role in determining reactive astrocyte functions.
sAC promotes neuroprotective reactive astrocyte proliferation
To test whether sAC is necessary for reactive astrocyte proliferation in vivo, we generated a transgenic mouse line in which GFAP-positive reactive astrocytes undergo Cre-mediated deletion of the C2 domain in the sAC locus and express a Cre-dependent GFP reporter (GFAP-cre/ZEG/sACfl/fl)28. Using this line, we assayed the effect of sAC KO on reactive astrocyte proliferation following optic nerve crush injury (Fig. 3a,b), labelling proliferating cells by EdU injection 3, 4 and 5 days after injury. At 7 days after injury, optic nerves were immunostained for astrocyte marker expression and EdU incorporation. Optic nerve injury induced broad Cre recombination in reactive astrocytes identified by dual expression of GFP and the astrocyte-specific transcription factor Sox9 (Fig. 3c). Reactive astrocyte proliferation was highest closest to the site of injury and conditional loss of sAC significantly inhibited proliferation of recombined (Cre+; Sox9+ GFP+) astrocytes compared to non-recombined (Cre−; Sox9+ GFP−) astrocytes or to astrocytes in control mice lacking the floxed sAC allele (Fig. 3d,e). These observed effects were probably underestimated because of the short half-life of EdU in vivo and because of any incorporation of EdU in cells before sAC KO-induced G2/M cell-cycle arrest. Together, these data demonstrate astrocyte-expressed sAC regulates reactive astrocyte proliferation in a cell-autonomous manner after traumatic injury, in vivo.
Fig. 3 |. Soluble adenylyl cyclase promotes neuroprotective astrocyte proliferation and RGC survival after optic nerve crush injury.

a,b, Experimental design (a) and tissue orientation (b) diagrams for investigating effects of sAC KO on optic nerve astrocyte reactivity. c, Representative images of CTRL and sAC KO optic nerves 7 days after injury around lesion core (*). d, Representative images of astrocyte proliferation in CTRL and sAC KO optic nerves. Example proliferating EdU+ GFP+ Sox9+ astrocytes (solid arrowheads) and non-proliferating EdU− GFP+ Sox9+ (open arrowheads) marked. e, Loss of sAC inhibits proliferation in sAC KO GFP+ reactive astrocytes relative to control (CTRL GFP+) and non-recombined astrocytes (sAC KO GFP−) (n = 5 optic nerves). Mixed-effects analysis 2-way ANOVA with Tukey test. f, Representative RBPMS+ RGC labelling in retinal flat-mounts (top) and ×20 magnification (bottom) from control and sAC KO mice. g, Quantification of sAC KO-induced decrease in RGC survival after optic nerve injury (n = 7 retinas). Two-tailed unpaired t-test. h, Reactive astrocyte proliferation in the optic nerve positively correlates with RGC survival (n = 10 retinas and optic nerves). Pearson correlation shown. i, Representative images of Iba1 immunoreactivity and proliferation in CTRL and sAC KO optic nerves 7 days after injury. j–m, Quantification shows increased Iba1+ immunoreactivity ( j,l) and proliferation (k,m) assayed within ( j,k) and outside (l,m) the lesion core (n = 7 optic nerves). Two-tailed unpaired t-tests. n, Iba1+ cell density in the optic nerve and RGC survival are inversely correlated (n = 13 retinas and optic nerves). Pearson correlation. P> 0.05 is non-significant. All data shown as mean ± s.e.m. Scale bars, 50 μm (d,f (bottom)), 500 μm (b,c,f (top),i). Panel a created with BioRender.com.
Perturbing astrocyte reactivity and associated glial scar formation has been described in some contexts to increase and in others to decrease neuronal health and CNS recovery; for example, following traumatic spinal cord injury5,8. To determine if sAC-regulated optic nerve astrocyte proliferation affects the health of adjacent neurons, we quantified RGC survival in retinal flat-mounts by RNA-binding factor mRNA processing factor (RBPMS) immunofluorescence at 7 days following optic nerve crush injury. Remarkably, sAC KO in reactive astrocytes significantly increased RGC death after injury (Fig. 3f,g); and when we analysed the variance between animals, the extent of RGC survival directly correlated with the amount of reactive astrocyte proliferation in the optic nerve (Fig. 3h). Taken together, these results support a new model in which sAC signalling in reactive astrocytes promotes their neuroprotective functions.
Suppression of microglia and neurotoxic astrocytes
Because sAC activity in astrocytes was important in limiting RGC death after optic nerve injury, we next sought to determine whether astrocyte-expressed sAC also served to limit potentially deleterious microglial and macrophage activation. Using Iba1 as a marker of activated microglia and infiltrating macrophages, we found sAC KO optic nerves had significantly larger lesion cores relative to controls (Fig. 3i,j). This increase was due, at least in part, to an increase in cell proliferation within the lesion core, which was also significantly higher than in controls (Fig. 3k). Similar increases in microglial cell density and proliferation were also found outside the lesion core in sAC KO optic nerves (Fig. 3l,m) and microglial cell density inversely correlated with RGC survival (Fig. 3n). These results indicate that sAC in reactive astrocytes promotes their proliferation and neuroprotective reactivity to inhibit deleterious microglial or macrophage cell activation contributing to RGC death.
Given these findings, we proposed that sAC-regulated astrocyte proliferation in vivo may be specific to the neuroprotective, C3− reactive astrocyte populations identified in our scRNA-seq analysis (Fig. 1). To test this, we performed scRNA-seq on injured optic nerves from sAC KO and wild-type mice and analysed reactive astrocyte gene expression 3 and 7 days after injury. At both time points, sAC KO increased the proportion of neurotoxic C3+ astrocytes compared to neuroprotective C3− astrocytes (Fig. 4a,b). This shift towards neurotoxic astrocyte reactivity was associated with a decrease in reactive astrocyte proliferation, increased G2/M cell-cycle arrest (Fig. 4c) and increased p21 expression (Fig. 4d). Immunostaining confirmed a significant increase in astrocyte C3 expression in sAC KO samples measured as average C3 intensity or as a percentage of C3-positive astrocytes relative to controls (Extended Data Fig. 4a–c). We also confirmed elevated p21 expression in sAC KO samples (Extended Data Fig. 4d,e), which together with the decrease in astrocyte proliferation contributed to an even more dramatic increase in the ratio of C3+ to C3− astrocytes. Thus, sAC KO mainly blocks C3− neuroprotective astrocyte proliferation and leads to a downstream increase in neurotoxic C3+ astrocytes, consistent with the increased microglial cell activation and RGC death observed with loss of reactive astrocyte sAC expression.
Fig. 4 |. Soluble adenylyl cyclase inhibits neurotoxic astrocyte differentiation.

a, scRNA-seq UMAP plots of astrocyte clusters for uninjured (control) and crushed optic nerves from WT and sAC KO mice 3 days and 7 days post-crush (dpc) (n = 3 mice and optic nerve pairs per condition). Cohort-specific plots are shown with cells missing from that cohort shown in grey overlays. b, Proportion of resting, neurotoxic and neuroprotective astrocytes in uninjured (Ctrl) and crushed optic nerves from wild-type (WT) and sAC KO mice. c, Proportion of neurotoxic (orange) and neuroprotective (green) astrocytes from WT and sAC KO in G1, S and G2/M phase based on expression of canonical cell-cycle markers. Most neurotoxic astrocytes are non-proliferating, whereas most neuroprotective astrocytes are proliferating. d, Effects of sAC KO on p21 (Cdkn1a) expression. Box plots denote the medians and interquartile ranges, with whiskers of box plots indicating the highest datum within 1.5× interquartile range of the upper quartile.
Effects of compartmented cAMP on astrocyte proliferation
Cyclic-AMP is highly compartmentalized in cells13,15,16 and sAC localizes in several subcellular compartments including the nucleus and cytoplasm17,30. To determine whether compartmented cAMP regulates reactive astrocyte proliferation, we generated and expressed a series of genetically encoded cAMP-binding ‘sponges’ derived from the PKA-R1β subunit31 in primary mouse astrocytes (Fig. 5a). Proper localization of each construct was confirmed by mCherry fluorescence (Fig. 5b,c) and effects on proliferation determined by EdU incorporation relative to mCherry control (Fig. 5d; dotted line) and PKA-R1β cAMP-binding-deficient mutant controls (Fig. 5d; grey bars). Buffering cAMP in all compartments with a construct lacking a targeting sequence (Ubiq) resulted in a small but non-significant decrease in astrocyte proliferation. Buffering cAMP exclusively at the plasma membrane (PM) had no effect on proliferation, consistent with the lack of inhibition observed with the tmAC inhibitor ddADO (Fig. 2). Remarkably, buffering cAMP exclusively in the nucleus (NLS) significantly inhibited astrocyte proliferation, whereas buffering cAMP in the cytoplasm (NES) conversely induced a significant increase in astrocyte proliferation. Thus, nuclear and cytoplasmic pools of cAMP oppose one another in the regulation of astrocyte proliferation, whereby nuclear cAMP promotes and cytoplasmic cAMP inhibits proliferation.
Fig. 5 |. Distinct subcellular pools of cAMP differentially regulate astrocyte proliferation in vitro.

a, PKA-R1β-derived cAMP sponges fused to mCherry and different subcellular targeting sequences. b, Illustration of predicted cAMP sponge localization with non-targeted (Ubiq), PM, NLS and NES targeting sequences. c, Representative images of cAMP sponge effects on astrocyte proliferation. d, Quantification of astrocyte proliferation expressing active (+) and inactive (−) cAMP sponges (n = 4 cultures). Two-way ANOVA with Tukey test. e, Buffering nuclear cAMP induces significant G2/M cell-cycle arrest (n = 3 cultures). One-way paired ANOVA with Dunnett test. f, Representative images of p21 immunofluorescence in sponge-expressing mouse astrocytes. g, Buffering nuclear cAMP induces significant p21 expression (n = 3 cultures). One-way paired ANOVA with Dunnett test. P > 0.05 is NS. All data shown as mean ± s.e.m. Scale bars, 50 μm (c,f). Panel a created with BioRender.com.
Owing to the opposing effects of nuclear and cytosolic cAMP on astrocyte proliferation we next assayed compartmented cAMP effects on cell-cycle progression by PI staining (Fig. 5e). As with sAC KO, depleting cAMP across all compartments (Ubiq) induced a slight but significant increase in G2/M arrest, whereas buffering nuclear cAMP led to even greater G2/M arrest. Conversely, buffering cytoplasmic cAMP had no effect at G2/M, consistent with it promoting astrocyte proliferation. In line with these data, buffering cAMP exclusively in the nucleus induced a significant upregulation in nuclear p21 expression, whereas buffering cAMP in the cytoplasm or throughout the cell led to non-significant changes in p21 (Fig. 5f,g). Cumulatively, these data suggest that nuclear and cytoplasmic pools of sAC-derived cAMP oppose one another in regulation of neuroprotective astrocyte proliferation, through regulation of p21 expression.
A novel retinal astrocyte-targeting AAV vector
We next sought to determine whether compartmented cAMP also regulated astrocyte proliferation and reactivity after injury in vivo. Adeno-associated viral (AAV) vectors of capsid serotypes 5 and 8 have been reported to transduce astrocytes in the brain and spinal cord32 but their use for targeting inner retinal or optic nerve head (ONH) astrocytes has not been reported. To test this, AAV5 and AAV8 expressing tdTomato under control of CMV, GFAP or gfaABC(1)D were administered by intravitreal injection (1 μl of approximately 5 × 10¹³ viral particles (vp) ml−1) into wild-type adult mouse eyes (Extended Data Fig. 5a–e). As expected, neither AAV5 nor AAV8 with a CMV promoter specifically targeted retinal astrocytes, also transducing RGCs, microglia and Muller glia. A full-length GFAP promoter improved the ONH and NFL astrocyte targeting of both AAV5 and AAV8 but also expressed in a small subset of retinal microglia and Muller cells. A similar expression pattern was observed with AAV8 and a truncated GFAP promoter, gfaABC(1)D. Notably, however, AAV5 combined with gfaABC(1)D almost exclusively transduced ONH astrocytes, with little retinal microglia or RGC expression, and only transduced about 9% of NFL astrocytes, less than 2% of Muller glial cells and virtually no other retinal cell types (Fig. 6a–h and Extended Data Fig. 5d–f), supporting its use to deliver molecular constructs to ONH astrocytes.
Fig. 6 |. Compartmented cAMP in ONH astrocytes differentially regulates microglial activation and RGC survival after optic nerve injury.

a, Intravitreal injection of AAV5.gfaABC(1)D specifically transduces ONH astrocytes in mice. b, Retinal cross-sections showing AAV5.gfaABC(1)D-tdTomato expression in the retina and ONH (n = 5 retinas). c, Magnified ONH region (from b) showing transduced ONH astrocytes. d, Magnified retinal region (from b) showing transduced nerve fibre layer (NFL; solid arrows) astrocytes and Muller glial cells (MG; open arrow). e,f, Flat-mount (e) and magnified (f) ONH region showing AAV5.gfaABC(1)D-tdTomato expression in the retina. g, Magnified retinal region (from e) showing AAV5.gfaABC(1)D-tdTomato expression in some NFL astrocytes but not RGCs. h, Quantification of AAV5.gfaABC(1)D.tdTomato expression in astrocytes and principal retinal cell types (n = 5 retinas). i,j, Nuclear (NLS-sp) and cytoplasmic (NES-sp) cAMP sponge and nuclear sACt (NLS-sAC) constructs (i) and experimental design ( j) used to investigate the effects of compartment-specific cAMP signalling in vivo. Proximal (P) region from the ONH. k, Representative retinal flat-mount images showing tdTomato, NLS-sp, NLS-sAC and NES-sp expression and Iba1 immunoreactivity. l,m, Localization and expression of sponge constructs (tdTomato, l) and effects on local Iba1+ cell infiltration (m) at the ONH. n, Representative images of RGC survival following cAMP manipulation in ONH astrocytes. o, Quantification of cAMP effects on Iba1 cell density in the ONH region (n = 12 retinas). p, Quantification of relative RGC survival following cAMP sponge expression in ONH astrocytes (n = 12 retinas). One-way ANOVA with Dunnett test (o,p). q, ONH astrocyte-specific cAMP-mediated RGC survival and local ONH Iba1+ cell density are inversely related (n = 34 retinas). Pearson correlation shown. All data shown as mean ± s.e.m. Scale bars, 10 μm (g), 50 μm (c,d,f,o), 500 μm (b,e,k). Panels i,j created with BioRender.com.
ONH astrocyte cAMP regulates microglia, RGC survival
Using this new ONH astrocyte targeting approach, we next asked whether sAC and the opposing effects of nuclear and cytoplasmic compartment-specific cAMP modulation are relevant to reactive astrogliosis, microglial infiltration and neuronal survival after optic nerve injury in vivo. AAV5.gfaABC(1)D vectors expressing nuclear- and cytoplasmic-targeted cAMP sponges (NLS-sp and NES-sp) and a nuclear-targeted sACt (NLS-sACt) (Fig. 6i) were intravitreally injected into adult C57BL/6J mice followed 1 week later by optic nerve crush injury, with assessment of glial and neuronal responses 2 weeks after injury (Fig. 6j). Robust expression of each construct was detected almost exclusively at the ONH with some variation, reflecting some variability in intravitreal injection, the constructs themselves (for example, cAMP sponge versus sACt) and different subcellular targeting sequences (NLS and NES) (Fig. 6k,l). First, buffering nuclear cAMP (NLS-sp) inhibited ONH astrocyte proliferation and trended towards increasing detection of ONH C3-positive astrocytes, whereas the opposite effects were seen when buffering cAMP in the cytoplasm (Extended Data Fig. 6a–d). AAV5.gfaABC(1)D.Cre-mediated sAC KO in sACfl/fl mice also inhibited ONH astrocyte proliferation after injury, again in line with sAC promoting cell-cycle progression in reactive astrocytes (Extended Data Fig. 6e,f). Consistent with the effects of compartmented cAMP on the balance of reactive astrocytosis, buffering nuclear cAMP in reactive ONH astrocytes induced a significant increase in Iba1+ cells at the ONH. Conversely, Iba1+ cell infiltration in the ONH region was significantly inhibited by expression of nuclear-targeted sAC (NLS-sACt) or buffering cytoplasmic cAMP (NES-sp) in reactive ONH astrocytes. (Fig. 6m,o). These results demonstrate that sAC and cytoplasmic and nuclear pools of cAMP differentially regulate neuroprotective astrocyte proliferation to affect downstream neurotoxic astrocyte differentiation and microglial cell response after optic nerve injury.
Last, the association between sAC-dependent, astrocyte-mediated microglial cell suppression and RGC neuroprotection demonstrated in transgenic KO mice suggested that compartmented cAMP modulation in ONH astrocytes by gene therapy could promote RGC neuroprotection. Indeed, when we assayed RGC survival proximate to the ONH region we found buffering nuclear cAMP in reactive ONH astrocytes significantly exacerbated RGC death, whereas expression of nuclear-targeted sAC or buffering cytoplasmic cAMP in ONH astrocytes led to overall increases in RGC survival (Fig. 6n,p). We did not detect any significant differences in RGC survival distant from the ONH. This relationship between local astrocyte cAMP-regulated reactivity and RGC survival was further supported by the finding that the extent of proximate RGC survival across all conditions was strongly inversely correlated with Iba1+ cell density in the ONH region (Fig. 6q). Thus, proliferating neuroprotective astrocytes act upstream of microglial activation, C3-positive neurotoxic astrocyte differentiation and neuronal survival that can be targeted to therapeutic effect.
Discussion
Taken together, these data support a model by which sAC-derived nuclear and cytoplasmic cAMP differentially regulate neuroprotective astrocyte-mediated suppression of local microglial cell activation, neurotoxic astrocyte reactivity and RGC survival. These data also uncover a previously unappreciated cellular regulation: it was previously shown that microglia-induced activation of neurotoxic astrocytes leads to subsequent death of neurons2,4. We now significantly extend this complex glial–glial regulation, finding that neuroprotective astrocytes normally act upstream of this neurotoxic pathway to suppress deleterious microglia and macrophage recruitment and inhibit C3-positive neurotoxic astrocytes and neuronal death. Our data suggest suppression of microglial activation is probably mediated by secreted factors from proliferating neuroprotective astrocytes that remain to be identified27,33. Thus, manipulating this sAC- and cAMP-dependent neuroprotective astrocyte–microglial–neurotoxic astrocyte–neuron signalling hierarchy should be a useful strategy to treat neurodegenerative disease (Extended Data Fig. 7).
Using state-of-the-art scRNA-seq we show that reactive astrocyte proliferation itself can be used as a unique marker to broadly define neuroprotective white matter astrocytes, which lack expression of C3 and other inflammatory markers that define an opposing neurotoxic astrocyte population after traumatic injury. In doing so, we found that neurotoxic and neuroprotective astrocytes may be further subdivided into unique subpopulations defined by differentially expressed inflammatory and neuroprotective genes, supporting the hypothesis that white matter astrocytes respond to injury through a spectrum of reactive states and functions more diverse and complex than the previous A1/A2 characterization. It will be critical to extend this newly appreciated understanding of the complexity of primary and subclustered reactive astrocyte states across different brain regions after injury and across disease states33,34.
Towards that goal, these data causally link astrocytic sAC expression and differentially compartmented cAMP to reactive astrocyte proliferation, the balance of neurotoxic versus neuroprotective astrocyte reactivity, microglial and macrophage cell activation and neuronal survival. We previously reported that pharmacological inhibition of sAC exacerbates RGC death in the retina, which we originally ascribed to the importance of sAC in promoting RGC survival cell-autonomously17. With our new data, we now appreciate that sAC plays diverse roles across several CNS cell types to influence injury responses and outcomes. Compartmented signalling is a crucial element of this signalling pathway, specifically that cAMP in the cytoplasm acts to inhibit astrocyte proliferation, whereas nuclear cAMP is required to progress through cell-cycle checkpoints and that differentially compartmented astrocyte cAMP similarly plays opposing roles in astrocyte-mediated microglial recruitment and RGC survival. We also find that p21 acts as a direct primary regulator of reactive astrocyte proliferation. Whether sAC-derived cAMP itself, p21 or other signalling molecules influence astrocyte reactivity through direct effects on gene expression remain open questions. In either case, our data also point to developmental downregulation or isoform switching of sAC as a primary determinant of astrocyte reactivity after injury in the adult mammalian CNS. Future experiments using single-cell CHIP–seq, ATAC-seq and RNA-seq with integrated analysis pipelines should be pursued to shed light on this sAC- and cAMP-specific molecular switch underlying functions in reactive astrocytes and other cells.
Finally, ONH astrocytes have been implicated in pathogenesis of optic neuropathies from glaucoma to trauma and others35–37. Therapeutic approaches to target this cell population for preclinical studies of pathophysiology or clinical investigation have been lacking. Targeting specific astrocyte populations, for example retinal versus optic nerve astrocytes, may provide greater therapeutic benefits in different disease contexts, for example in glaucoma for which ONH astrocytes have been more specifically implicated. To our knowledge, our AAV–ONH targeting approach is the first description of such a strategy and, with extension to study of efficacy in human tissues, opens up the further possibility of specifically studying this population and of targeting genetic manipulations towards gliotherapeutics in future work.
Methods
Animals
Timed pregnant embryonic day (E) 17 C57BL/6 mice were purchased from Charles-River for primary astrocyte cultures. GFAP-Cre (B6.Cg-Tg(GFAP-Cre)77.6Mevs/J) and ZEG reporter mice (Tg(CAG-Bgeo/GFP)21Lbe/J) were purchased from Jackson Laboratories. Conditional sAC knockout mice (sAC fl/fl) were generously provided by Jochen Buck and Lonny Levin (Department of Pharmacology, Weill Cornell Medical College). sACfl/fl, GFAP-Cre/ZEG and GFAP-Cre/sAC fl/fl/ZEG mice were generated in-house. Mice of both sexes aged P40–P63 ± 5 were used for in vivo experiments. Sample size was determined on the basis of our extensively published previous experience using similar assays16,38. Inbred mice were used, and all experiments from initiation through data collection were performed by investigators masked to treatment group, ensuring equally unbiased outcomes.
Astrocyte purification and cell culture
Mouse cortical astrocytes were isolated from E17 C57BL/6 and sACfl/fl mice as described39. Briefly, pups were removed at E17 from timed pregnant mice and fetal brains quickly isolated in ice cold DPBS (Gibco, 14287–080). Cortices were carefully dissected away from the olfactory bulbs, hippocampus and subcortical structures, and meninges removed. Dissected cortices were sliced into four pieces per cortex and incubated in 0.25% trypsin in DPBS (Gibco, 14287–080) at 37 °C for 30 min, with gentle shaking every 10 min. Tissue was then pelleted at 200g for 5 min at room temperature, trypsin aspirated and cell pellet vigorously pipetted about 25 times in 10 ml mouse astrocyte medium, consisting of DMEM (Gibco, 10569–010) with 10% fetal bovine serum (Hyclone, sh30071.03) and 1% penicillin and streptomycin (Sigma-Aldrich, P4333 100 ml). All culture vessels were precoated with a solution of 0.01 mg ml−1 of poly-D-lysine (PDL, Sigma-Aldrich P6407) for 1 h at room temperature and then washed twice with water before letting dry. Dissociated cells were plated at 15 million cells per PDL-coated T75 flask (Thermo Fisher Scientific, 430641U) and placed in the incubator at 37 °C. Medium was changed the following day and every third day thereafter. After 7 days, cultures were placed directly on an orbital shaker (Barnstead Thermolyne RotoMix Type 50800) for at least 4 h at maximum speed at 37 °C, then washed twice with 5 ml of DPBS lacking Ca2+ and Mg2+ (Gibco, 14190–144), followed by three rounds of vigorous manual shaking for 30 s in 10 ml of DPBS (−Ca, −Mg) to remove any contaminating microglia and oligodendrocyte precursor cells (OPCs). Adherent astrocytes were released by incubating 5 ml of 0.05% Trypsin-EDTA diluted in DPBS (−Ca, −Mg) for 4 min at 37 °C and were plated accordingly in mouse astrocyte medium. Cultures were passaged a maximum of two times for experimental use.
Human cortical astrocytes purified from normal fetal brain tissue were purchased from ScienCell (no. 1800) and expanded twice before freezing in human astrocyte medium (ScienCell, no. 1801) with 10% dimethyl sulfoxide (Sigma-Aldrich, D2650 100 ml). Cells were plated in PDL-coated T75 flasks and medium replaced every 3 days until the astrocytes were about 90% confluent. Cells were passaged using 5 ml of 0.05% trypsin-EDTA (Thermo Fisher Scientific, 25300062) diluted 1:1 with DPBS (−Ca, −Mg), incubated for 4 min at 37 °C and plated accordingly in human astrocyte medium. All human astrocyte experiments were performed between passages three and five. Astrocyte cultures were grown at 37 °C in 5% CO2 in tissue culture dishes (Falcon, 353046 or 353047) pretreated with PDL.
In vitro proliferation assays
Pharmacological sAC inhibition.
Human astrocytes were plated at a density of 50,000 cells per well in PDL-coated 24-well dishes (Falcon, 353047) and incubated overnight before pharmacological treatment. The following day, astrocytes were treated with KH7 (Sigma-Aldrich, K3394), 2-hydroxyestradiol (2HE, Sigma-Aldrich, H3131), 2′5′-dideoxyadenosine (dDADO, Sigma-Aldrich, D7408), aphidicolin (Tocris, 5736), nocodazole (Tocris, 1228) or dimethyl sulfoxide (vehicle; Sigma, D8418) diluted in human astrocyte medium containing 10 μM 5-ethynyl-2′ deoxyuridine (EdU; Invitrogen, c10640) and incubated for 20 h at 37 °C to label proliferating cells. After 20 h, astrocytes were fixed in 4% paraformaldehyde (PFA, Electron Microscopy Sciences 15710) diluted in 1× PBS for 15 min and washed with 1× PBS three times before EdU visualization using the Click-iT Plus EdU Alexa Fluor 647 or 488 Imaging Kit (Invitrogen c10640 or c10637). Cells were incubated in DAPI (Molecular Probes, D3571) diluted 1:2,000 in 1× PBS for 5 min at room temperature to label all cell nuclei. Automated quantification of proliferating (EdU-positive) astrocytes was performed using the Thermo Fisher Cell Insight CX-5 platform. Human astrocyte experiments were repeated with different batches (commercial lots) to ensure reproducibility. For p21 shRNA proliferation experiments, mouse astrocytes were plated at a density of approximately 25,000 cells per well in PDL-coated 48-well dishes. Cultures were allowed to expand for 24 h before anti-p21 (VectorBuilder, VB210617-1175tgf) or scrambled control (Vectorbuilder, VB210617-1177ytd) shRNA-GFP transfection using Lipofectamine 3000 (Thermo Fisher Scientific, L3000015) according to the manufacturer’s protocol. Anti-p21 shRNA sequences were designed using Invivogen siRNA Wizard Online Tool. Anti-p21 guide sequences were 5′-AAATCTGTCAGGCTGGTCTGCC-3′ and 5′-ATAGAAATCTGTCAGGCTGGTC-3′. Scrambled control guide sequences were 5′-CGAGGGCGACTTAACCTTAGGT-3′ and 5′-TTGGTGCTCTTCATCTTGTTGG-3′. Medium was changed 24 h post-transfection and cultures treated with KH7 (10 μM) or dimethyl sulfoxide in medium containing EdU (10 μM) after 3 days. Cells were fixed with 4% PFA 20 h after KH7 treatment and EdU visualized using the Click-iT Plus EdU Imaging Kit (Invitrogen, 10637). EdU-positive cells were manually counted and plotted as a percentage of GFP+ (transfected) cells using Fiji ImageJ.
Genetic sAC knockout.
Mouse astrocytes were plated at a density of 50,000 cells per well in PDL-coated 24-well dishes (Falcon, 353047) or 250,000 per well in a 6-well plate (Falcon, 353047) and allowed to expand for 2 days before transduction. For in vitro proliferation assays, mouse astrocytes were transduced with crude lentivirus, (VSV-G) LV-Ubiq-eGFP-Cre (Stanford Gene Vector and Virus Core, Stock ID: LV6) or a (VSV-G) LV-Ubiq-eGFP-DeltaCre (Stanford Gene Vector and Virus Core, Stock ID: LV7)40 to account for any non-specific effects of high nuclear Cre expression on astrocyte proliferation. Polybrene (Millapore Sigma, TR-1003-G) was diluted to 10 μg ml−1 in crude virus to increase transduction efficiency. Crude virus was added directly to each well and cells were incubated for 30 min at 37 °C before subsequent centrifugation at 800g for 30 min. Following centrifugation, LV was replaced with fresh mouse astrocyte medium. After 3 days in culture, medium was replaced with fresh mouse astrocyte medium containing EdU (10 μM) and the cultures incubated for 20 h before PFA fixation and EdU visualization. For in vitro cell-cycle assays and western blots, mouse astrocytes were transduced with AAV2-GFP (Addgene, 105530-AAV2) and AAV2-Cre-GFP (Addgene, 105545-AAV2) diluted in mouse astrocyte medium at 20,000 multiples of infection and incubated overnight, followed by a medium change. After 5 days in culture, cells were fixed with ice cold 70% ethanol for PI staining or harvested for western blot as described below.
cAMP sponges
Cyclic-AMP buffering constructs were designed on the basis of ref. 31 and synthesized commercially (vectorbuilder.com). All transfections were performed using Lipofectamine 3000 Transfection Reagent (Thermo Fisher Scientific, L3000015) as per the manufacturer’s protocol. Briefly, cells were seeded at 50,000 cells per well in a PDL-coated 24-well plate and transfected with 500 ng of DNA, 0.75 μl of lipofectamine and 1 μl of P3000 per well, followed by a change of medium the next day. After 3 days in culture, medium was replaced with fresh mouse astrocyte medium containing EdU (10 μM) and incubated for 20 h before PFA fixation and EdU visualization. Cells were incubated in DAPI (Molecular Probes, D3571) diluted 1:2,000 in 1× PBS for 5 min at room temperature to label all cell nuclei. Widefield fluorescent imaging was performed on a Zeiss Axio Observer Inverted microscope and proliferation (EdU) of sponge-expressing cells quantified using the ‘cell counter’ function in Fiji ImageJ. For in vitro cell-cycle assays, cells were ethanol-fixed 4 days after transfection before PI staining, as described below.
In vitro cell-cycle assays
For all cell-cycle assays, astrocytes were fixed with 70% ice cold ethanol for 5 min and washed once with 1× PBS before staining with PI. For pharmacological inhibition assays, human astrocytes were incubated in FxCycle PI/RNase Staining Solution (Thermo Fisher Scientific, F10797) for a least 4 h at room temperature. For sAC KO and cAMP sponge cell-cycle assays, mouse astrocytes were incubated in FxCycle PI Far Red stain (Invitrogen, F10348) and FxCycle PI Violet stain (Invitrogen, F10347) diluted in 1× PBS for at least 4 h at room temperature. Automated imaging and quantification were performed using the Thermo Fisher Cell Insight CX-5 platform and Cell Health Profiling bioapplication module.
In vitro survival assay
To measure cytotoxicity in vitro, pharmacologically treated human astrocytes were stained with DAPI (1:2,000) and SYTOX Orange Nucleic Acid Stain (Invitrogen, s34859) diluted 1:5,000 in human astrocyte medium and incubated for 5 min at 37 °C before imaging and quantification using the Thermo Fisher Cell Insight CX-5 platform.
Western blots
Five days after AAV-Cre transduction, cells were washed with 1 ml of ice cold 1× PBS, then scraped down in 100 μl of RIPA buffer (Pierce, 89901) including 1× Halt Protease and Phosphatase inhibitor cocktail (Thermo Fisher, 78446). Cells were briefly sonicated, cell lysate was spun down at 13,000g for 5 min at 4 °C, and supernatant was transferred to freshly prepared tubes. Protein concentration was determined using the Pierce BCA Protein Assay Kit (Pierce, 23227). Samples were diluted in LDS sample buffer (Thermo Fisher, NP0007) and heated to 69 °C for 10 min, cooled on ice and spun down at 13,000g for 5 min, and 20 μg of total protein was loaded onto a NuPage 3–8% Tris-Acetate gel (Invitrogen, EA0375). Protein was transferred to polyvinyldiene fluoride membranes (Bio-Rad, 1704156) using the Trans-Blot Turbo Transfer Starter System (Bio-Rad, 17001918) and loading confirmed by Ponceau staining (Sigma-Aldrich, 7170). Membranes were blocked with 5% non-fat milk (Labscientific, M0841) diluted in TBST (0.2% Tween) and probed with anti-sAC (Abcam, ab82854) diluted 1:500 or anti-GAPDH (Cell Signalling, 2118) diluted 1:5,000 in TBST overnight at 4 °C on a rocker. The following day, membranes were washed 5× with TBST (Thermo Scientific 28358) containing 0.2% Tween-20 (Sigma-Aldrich P2287) for at least 10 min per wash on a rocker and subsequently probed with anti-rabbit IgG horseradish peroxidase conjugated secondary antibody (GE Healthcare, NA9340), diluted 1:2,000 in TBST for 4 h at room temperature. Proteins were visualized with Pierce ECL Western Blotting Substrate (Thermo Scientific, 32106) and imaged on an Amersham Imager 600. Relative protein expression was normalized to Ponceau or GAPDH and determined by densitometry using Fiji ImageJ. See Supplementary Table 1 for detailed antibody information.
RNA sequencing
Bulk RNA sequencing of cultured astrocytes.
Human astrocytes were seeded on PDL-coated 100 × 25 mm2 tissue culture dishes (Corning 353003) at a density of 1 × 10⁶ cells per dish and incubated for 48 h to allowadherence andexpansion. Astrocyteswere treatedwith KH7(10 μM; Sigma-Aldrich, K3394), aphidicolin (10 μM; Tocris, 5736), nocodazole (1 μM; Tocris, 1228) or dimethyl sulfoxide (vehicle; Sigma, D8418) diluted in fresh human astrocyte medium and incubated for 20 h at 37 °C. The following day, astrocytes were washed twice with ice-cold 1× PBS, scraped down in 500 μl of 1× PBS and transferred to 1.5 ml Eppendorf tubes. Astrocytes were spun down at 800g, supernatant decanted and cell pellets snap frozen on dry ice. Frozen cell pellets were shipped for RNA extraction, library construction and RNA sequencing (genewiz.com). Each experimental condition was repeated in triplicate. RNA-seq reads were aligned to the human genome hg38 by using STAR aligner and gene counting was performed by using RSEM. Gene set enrichment analysis was performed by using FGSEA package in R and displayed in GraphPad Prism. Differentially expressed genes were called by using limma-voom in R and genes with a false discovery rate < 0.05 and a fold change (FC) higher than 1.2 (UP-regulated genes) or lower than −1.2 (DOWN-regulated genes) were considered for downstream analysis. The functional enrichment of differentially expressed genes was computed in enrichR package and the density and volcano plots were displayed in R and GraphPad Prism, respectively.
Single-cell RNA sequencing of optic nerve astrocytes.
Three to six optic nerve pairs per condition were dissected from globe to chiasm, digested in papain (64 U ml−1, Worthington Biochemical LS003126) at 37 C° for 1 h and pipetted 20 times using a P1000 pipette tip, letting cell clumps settle and transferring 1 ml of supernatant each time until the sample was completely dissociated. The resulting suspension was passed through a 40 μm cell strainer (Corning 352340), centrifuged at 40g for 5 min and resuspended in 500 μl of DPBS with 3% BSA (Sigma-Aldrich, A4161) and 55 μl of myelin removal beads (Miltenyi Biotec, 130-096-733) for 15 min on ice. The cell suspension was then passed through an LS magnetic column (Miltenyi Biotec, 130-042-401) to remove beads. Cell flow-through was centrifuged at 200g for 5 min at room temperature, resuspended in 50 μl of DPBS with 3% BSA, counted and verified to be free of debris, with a viability of approximately 70% based on Trypan blue exclusion (Gibco, 15250061). Single-cell capture and library preparation were performed using the Chromium Next GEM Single Cell 3′ kit v.3.1 for scRNA-seq using the Illumina HiSeq platform. All datasets were preprocessed, merged and normalized; followed by dimensionality reduction, clustering, resolution-filtering, differential expression analysis and cell-cycle scoring using Cell Ranger (v.7.1.0) and Seurat R Packages (v.4.2). Samples were analysed using the following criteria: control: 500–7,000 genes detected, <20% reads from mitochondria (n = 7,278 cells); injured: 500–5,000 genes detected, <15% reads from mitochondria (n = 3,741 cells). Gene expression matrixes were merged followed by SCTransform function with the regression variables including mitochondria read abundance and gene number and cell-cycle stages estimated using the Cell Cycle Scoring function. Principal component analysis (PCA), uniform manifold approximation and projection (UMAP) with the top 30 PCs obtained from PCA, shared nearest neighbour analysis and clusters identified using Louvain algorithm with 0.5 resolution. Neurotoxic and neuroprotective clusters were isolated and re-analysed at 0.05 and 0.1 resolution and subclusters characterized on the basis of their top DEGs.
Intravitreal injections and optic nerve injury
Intravitreal injections, optic nerve crush and sample preparations were performed as described38. For intravitreal injections, 1 μl of approximately 5 × 10¹³ vp ml−1 of AAV5.gfaABC(1)D was injected into the vitreous chamber of each eye using a Hamilton syringe (see Supplementary Table 2 for AAV construct information). For crush experiments, each optic nerve was exposed from the lateral canthus and crushed for 3 s with Dumont no. 5 forceps (FST, 91150–20) about 1.5 mm behind the globe. Care was taken to avoid damaging the blood supply to the retina. Mice with any significant postoperative complications (for example, retinal ischaemia and cataract) were excluded from further analysis. On days 3, 4 and 5 post-crush, EdU (10 mg ml−1; Thermo Fisher, A10044) diluted in 1× PBS was injected intraperitoneally (100 μg g−1 of body weight) to label proliferating cells. Mice were perfused intracardially with 4% PFA and optic nerves and retinas were prepared as described previously. Briefly, eyes were enucleated, and optic nerves carefully dissected and then postfixed in 4% PFA for 2 h at room temperature. Optic nerves were sequentially cryoprotected in 15% and 30% sucrose overnight, mounted in OCT (Fisher Scientific, 23-730-571) and sectioned in 12 μm sections on Superfrost Plus glass slides (VWR, 48311–703) for immunostaining. Retinas were carefully dissected from the eye cup, lens removed and prepared for cyrosectioning (as above) or partitioned into quadrants and postfixed in ice cold methanol before immunostaining. See Supplementary Table 3 for list of animals used in this study.
Immunohistochemistry
Cell culture.
Cells were fixed with 4% PFA for 15 min and then washed three times with 1× PBS. Cells were blocked and permeabilized with 0.5% Trition-X100 (Sigma-Aldrich, ×100–100 ml) and 5% normal goat serum (Thermo Fisher Scientific, 16-210-064) in PBS for 1 h at room temperature and then incubated with primary antibodies at 4 °C overnight in the same solution: anti-GFAP (Abcam, ab4674, 1:2,000), anti-mCherry (Abcam, ab167453, 1:500) and anti-p21 (Abcam, ab218311, 1:2,50). The following day, cells were washed three times in 1× PBS for 5 min each and then incubated in Alexa Fluor secondary antibodies diluted 1:500 in blocking buffer for 4 h at room temperature. Cells were then washed three times for 5 min each with 1× PBS and stained with DAPI before imaging.
Sectioned retinas and optic nerves.
Sectioned tissues were thawed at room temperature for 10 min and a hydrophobic barrier was drawn around each section using a pap-pen (VWR 100306–170). EdU visualization was performed using the Click-iT Plus EdU Alexa Fluor 647 or 488 Imaging Kit (Invitrogen, c10640 or c10637) as per the manufacturer’s protocol. Following EdU visualization, sections were blocked and permeabilized in approximately 200 μl of PBS with 0.5% Trition-X100 (Sigma-Aldrich, ×100–100 ml) and 5% normal goat serum (Thermo Fisher Scientific, 16-210-064) for 1 h at room temperature. Blocking buffer was then replaced with anti-GFP (Abcam, ab13970, 1:200), anti-GFAP (Abcam, ab4674, 1:1,000, anti-Sox9 (Abcam, ab76997, 1:250), anti-Iba1 (Fujifilm, 019–19741, 1:250), anti-C3 (Abcam, ab97462, 1:500) and anti-p21 (Abcam, ab107099, 1:200) diluted in blocking buffer and incubated on a flat surface overnight. The following day, slides were washed three times in 1× PBS for 10 min each and incubated in Alexa Fluor secondary antibodies diluted 1:500 in blocking buffer overnight at 4 °C. Slides were washed three times in 1× PBS and coverslipped with mounting medium including DAPI (Cell Signalling Technologies 8961S). Images were acquired with an inverted Zeiss microscope or confocal laser scanning microscope (Zeiss 880) at ×20 or ×63 magnification. Astrocyte proliferation was quantified by EdU incorporation in Sox9+ and GFP+ tdTomato+ astrocytes.
Flat-mount retinas.
Dissected retinas were transferred to a 48-well dish and incubated for 1 h at room temperature on a rocker in approximately 500 μl of flat-mount blocking buffer consisting of 1× PBS, 3% Triton-X100, 0.5% Tween-20, 1% BSA and 0.1% sodium azide. RGCs were immunostained with RNA-binding protein with multiple splicing (RBPMS) antibody (PhosphoSolutions, 1832-RBPMS) diluted 1:250 in flat-mount blocking buffer and placed on a rocker at 4 °C for 48 h. Retinas were washed three times with 1× PBS for 10 min per wash and incubated in Alexa Fluor secondary antibodies diluted 1:250 in flat-mount blocking buffer for 24 h at 4 °C. The following day, retinas were washed three times with 1× PBS for 10 min each and then mounted RGC-side up on Superfrost Plus glass slides (VWR, 48311–703). Images were acquired with a confocal laser scanning microscope (Zeiss LSM880) at ×20 magnification. Imaging and quantification were performed in a masked fashion as previously described. Briefly, retinas were divided into quadrants and one digital micrograph was taken from a fixed distance from the centre of each of the four fields. See Supplementary Table 1 for detailed antibody information.
Statistical analyses
Data were acquired and analysed using Zen Blue (v.3.5), Thermo Scientific HCS Studio (v.4.0), Amersham Imager 600 software, Fiji ImageJ (v.1.51), GraphPad Prism (v.9.3.1), Cell Ranger (v.7.1.0, mm10), R, Seurat (v.4.2), DittoSeq (v.1.10.0), Harmony (v.0.1.1), FastQC (v.0.11.2), Trimmomatic (v.0.38), RSEM (v.1.2.30), Samtools (v.1.9), STAR:RNAseq aligner (v.2.6.0a) and Limma (v.3.56). All data are shown as mean ± s.e.m. with sample size and statistical details for each experiment indicated in the corresponding figures and figure legends. All data were tested for normality before statistical analyses.
Study approval
All animal experiments were approved and conducted in accordance with the guidelines of the Administrative Panel on Laboratory Animal Care (protocol no. 30550, exp.04/24/26) at Stanford University and in compliance with the ARVO Statement for the Use of Animals in Ophthalmic and Vision Research.
Reporting summary
Further information on research design is available in the Nature Portfolio Reporting Summary linked to this article.
Extended Data
Extended Data Fig. 1 |. Annotation and cell cycle profiles of optic nerve cell types shown in Fig. 1.

a. Dot plots of canonical cellular markers in 13 identified optic nerve cell types. Fraction of expressing cells shown as dot size and mean expression shown as dot colour. b. UMAP plots as in Fig. 1e showing all optic nerve cell clusters coloured by distribution of cells in G1, S and G2/M phase.
Extended Data Fig. 2 |. Characterization of sAC expression and function in primary cortical astrocytes.

a-b. Astrocyte marker immunostaining and characterization of primary cortical astrocyte culture purity (n = 4 cultures). Scale bars are 50 μm. c. Western blots showing sACfull (180 kDa) and sACt (50 kDa) protein expression in sACfl/fl mouse astrocytes after 15 days in vitro (DIV), 30DIV and following AAV2-GFP (Ctrl) or AAV2-Cre-GFP (KO) transduction. d. Quantification of sAC KO determined by the relative difference of sACt band intensity between CTRL and sAC KO samples with protein expression normalized to ponceau or GAPDH (n = 3 cultures). Two-tailed paired t-test. e. Illustration of cell cycle phase progression and canonical checkpoints located at the G1, G2/M and metaphase-to-anaphase transitions (spindle checkpoint). f. Experimental design to assess the role of sAC in cell cycle progression in astrocyte cultures. g. Synchronization of astrocyte proliferation with aphidicolin. Relative frequency histogram of genomic DNA content after 20 hr aphidicolin treatment and removal with hours after release indicated. h. Fraction of cells in S phase (cells between dotted lines in panel g) following the indicated hours after removal of aphidicolin (n = 3 cultures). i. Relative frequency histograms of effects of 2HE treatment on cell cycle arrest in asynchronous (A) and synchronized (S) human astrocyte cultures. j. Quantification of panel i (n = 4 cultures). Two-way ANOVA with Tukey test. p > 0.05 is non-significant, n.s. All data are shown as mean values ± s.e.m. e,f, Created with BioRender.com.
Extended Data Fig. 3 |. Soluble adenylyl cyclase inhibits stress-associated p21 expression in proliferating astrocytes.

Bulk RNA-seq for human astrocytes shown in Fig. 2j–k and studied using the experimental paradigm shown Extended Data Fig. 2f. a. Inhibiting sAC induces p53, HIF-1α and NF-Kβ stress signalling pathways (red) and downregulation of canonical cell cycle signalling pathways (green) in proliferating astrocytes. Gene set enrichment analysis (GSEA) of KH7-, S-phase inhibitor aphidocolin- and G2/M inhibitor nocodazole-treated human astrocyte cultures. Aphidicolin and nocodazole differentially affect stress and cell cycle signalling consistent with their unique mechanisms of action. b. Volcano plots highlighting an upregulation of p53-, HIF-1α- and NF-κB-associated gene expression (red) and downregulation of canonical cell cycle genes (green). c. Gene expression analysis of p53-, NF-κB- and Hif-1α-associated genes demonstrating p21 (CDKN1A) is the most significantly upregulated stress-associated gene induced by KH7. d. Gene expression analysis of cell cycle-associated genes showing KH7 treatment induces a significant downregulation of known p21 targets including CCNB1, CDC25A, CDC25B and CDC25C. Moderated t-statistics test; b-d .
Extended Data Fig. 4 |. Effects of sAC KO on astrocyte C3 and p21 expression.
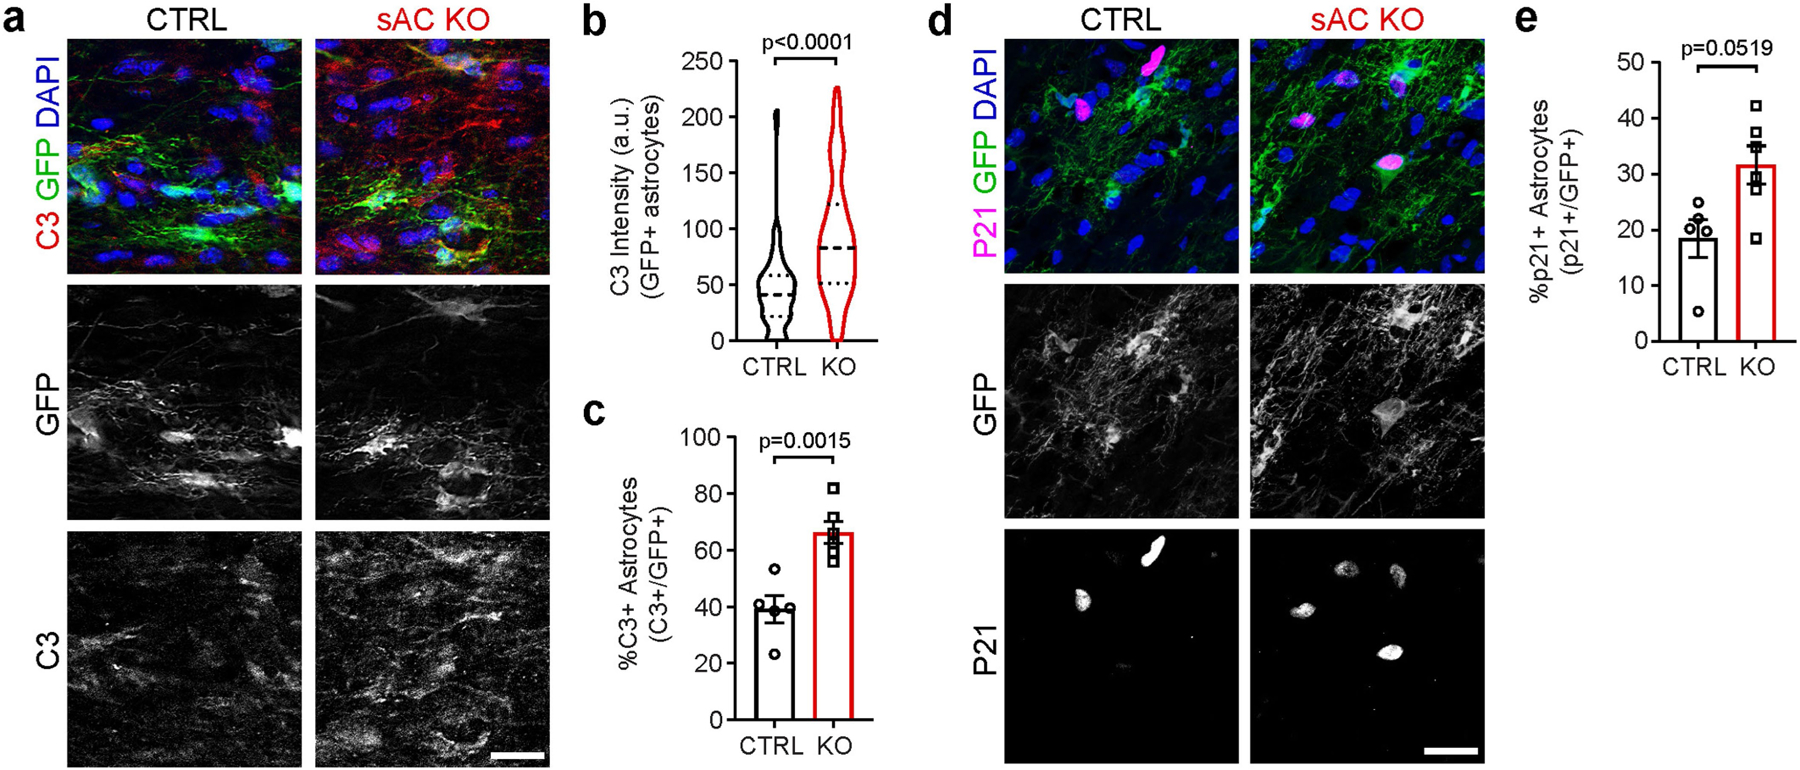
a. Loss of sAC in reactive optic nerve astrocytes induces C3 expression. Representative images of C3 immunostaining in CTRL and sAC KO optic nerve astrocytes 500 μm from the crush site. Scale bar is 20 μm. b. sAC KO leads to significantly increased C3 intensity (n = 91 cells from 5 optic nerves). Dotted lines represent 25th and 75th percentiles. Dashed line represents median. Two-sided Kolmogorov-Smirnov test. c. sAC KO leads to a significant increase in neurotoxic C3-positive reactive astrocytes using CTRL median as a threshold (n = 5 optic nerves). Two-tailed unpaired t-test. d. Representative images of p21 immunostaining in CTRL and sAC KO optic nerve astrocytes 500 μm from the crush site. Scale bar is 20 μm. i. Quantification of p21+ astrocytes demonstrating a significant increase in p21 expression in GFP-positive sAC KO astrocytes relative to controls (n = 5 optic nerves). Two-tailed unpaired t-test. All data are shown as mean values ± s.e.m.
Extended Data Fig. 5 |. AAV5 and AAV8 transduction in the retina with CMV, GFAP and gfaABC(1)D promoters.

a. Representative optic nerve head (ONH) cross-sections demonstrating tdTomato reporter expression for each viral vector tested. ONH region defined as the area between the glial lamina and optic disc rim ~200 μm from the centre of the retina. Scale bar is 50 μm. b. Representative cross-sections of transduced retinas at a distance (>500 μm) from the ONH. Closed arrowheads showing transduced NFL astrocytes. Open arrowheads showing transduced Muller glial cells in the inner nuclear layer (INL). NFL astrocytes defined by GFAP and Sox9 in the inner retina. Muller glia defined by Sox9 and DAPI in the INL. Photoreceptors defined by DAPI in the outer nuclear later (ONL). Scale bar is 50 μm. c. Representative retinal flat-mounts showing tdTomato reporter expression for each viral vector tested. RGCs identified by RBPMS immunostaining. Scale bar is 500 μm. d. Magnified ONH and retinal regions from retinal flat-mount (dashed in c). Open arrowheads showing transduced RGCs. Scale bar is 50 μm. e. Representative ONH cross-sections immunostained for Iba1 showing microglia and virus co-localization. Scale bar is 50 μm. f. Quantification of reporter expression in principal retinal cell types (AAV5.gfaABC(1)D, n = 5 retinas; AAV8.gfaABC(1)D, n = 3 retinas; AAV5.GFAP, n = 3 retinas; AAV8.GFAP, n = 3 retinas; AAV5.CMV, n = 2 retinas; AAV8.CMV, n = 2 retinas). One-way ANOVA with Tukey test. All data are shown as mean values ± s.e.m.
Extended Data Fig. 6 |. Compartmented cAMP in optic nerve head (ONH) astrocytes differentially regulates proliferation and C3 expression after optic nerve crush injury.
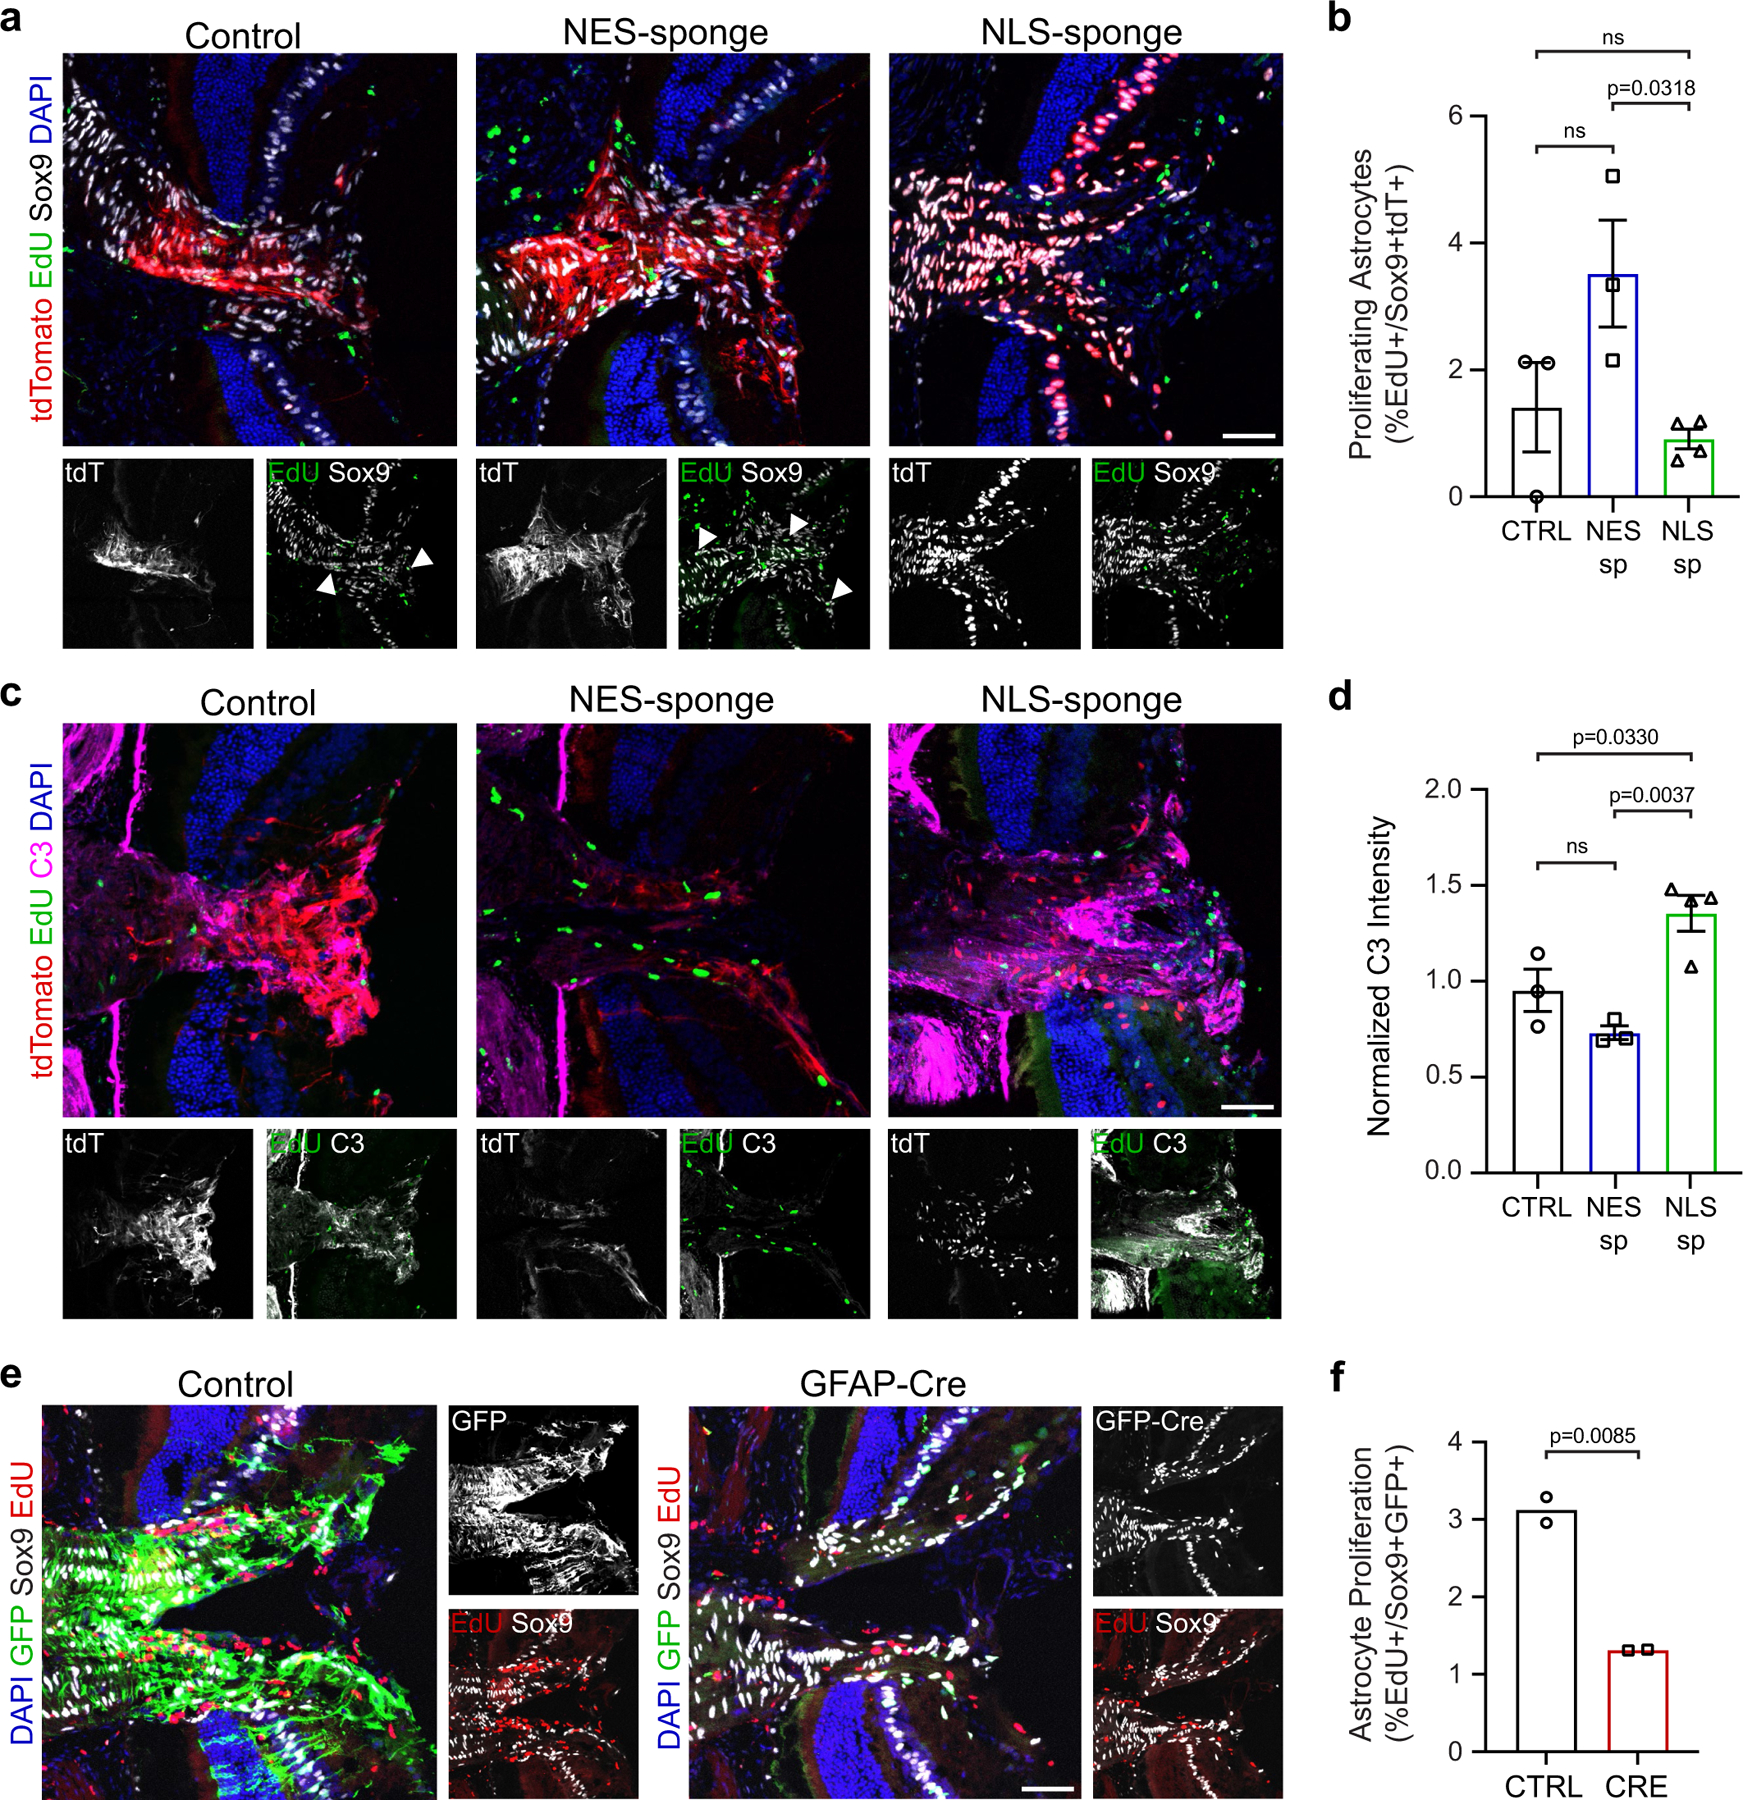
a. Representative images of AAV5.gfaABC(1)D. tdTomato (control), NES-sponge and NLS-sponge effects on ONH astrocyte proliferation after injury. Scale bar is 50 μm. b. Buffering cytoplasmic cAMP in ONH astrocytes promotes proliferation after injury (n = 4 retinas). One-way ANOVA with Tukey test. c. Representative images of ONH C3 immunoreactivity in AAV5.gfaABC(1)D.tdTomato (control), NES-sponge and NLS-sponge transduced retinas after injury. Scale bar is 50 μm. d. Buffering nuclear cAMP in ONH astrocytes induces significant C3 expression (n = 4 retinas). One-way ANOVA with Tukey test. e. Representative images of ONH astrocyte proliferation in AAV5.gfaABC(1)D.GFP (control) and AAV5.gfaABC(1)D.Cre-GFP (sAC KO) injected sACfl/fl mouse eyes following injury. f. sAC KO inhibits ONH astrocyte proliferation after injury (n = 2 retinas). p > 0.05 is non-significant, n.s. All data are shown as mean values ± s.e.m.
Extended Data Fig. 7 |. Model for sAC-dependent reactive astrocyte differentiation and regulation of glial–glial and glial-neuronal signalling in response to injury.

Nuclear and cytoplasmic sAC-derived cAMP differentially regulate neuroprotective astrocyte proliferation through the regulation of p21. Proliferating neuroprotective reactive astrocytes inhibit deleterious microglial activation and downstream neurotoxic astrocyte reactivity, thus influencing the balance between neuroprotective and neurotoxic reactive phenotypes and the extent of retinal ganglion cell (RGC) survival.
Supplementary Material
Acknowledgements
This work was supported in part by National Eye Institute grants R01-EY026766, R01-EY032416 (M.S.K. and J.L.G.), F32-EY025915 (E.G.C.), T32-EY027816 (A.B.T.), P30-EY026877 (J.L.G.), Medical Technology Enterprise Consortium, the Gilbert Family Foundation Vision Restoration Initiative and an unrestricted grant from Research to Prevent Blindness. We also thank the Stanford Gene Vector and Virus Core (GVVC) and the Stanford Genetics Bioinformatics Service Center for their critical contributions to this work. Illustrations created with BioRender.com.
Footnotes
Online content
Any methods, additional references, Nature Portfolio reporting summaries, source data, extended data, supplementary information, acknowledgements, peer review information; details of author contributions and competing interests; and statements of data and code availability are available at https://doi.org/10.1038/s41586-023-06935-3.
Code availability
Cell Ranger can be found at http://10xgenomics.com/support/soft-ware/cell-ranger/downloads. All analysis packages can be found at http://bioconductor.org and original R package repository at http://cran.r-project.org.
Competing interests Stanford University has prepared provisional patent applications (file numbers pending) based on the ONH astrocyte-specific viral vector and the manipulation of astrocyte cAMP, on which E.G.C., A.B.T. and J.L.G. are included as inventors.
Additional information
Supplementary information The online version contains supplementary material available at https://doi.org/10.1038/s41586-023-06935-3.
Peer review information Nature thanks Xin Duan and the other, anonymous, reviewer(s) for their contribution to the peer review of this work.
Data availability
All data are available in the manuscript, Supplementary Information and online. Bulk and scRNA-seq data can be found at the NCBI Gene Expression Omnibus through accession numbers GSE245816 and GSE237675. Source data are provided with this paper.
References
- 1.Zamanian JL et al. Genomic analysis of reactive astrogliosis. J. Neurosci 32, 6391–6410 (2012). [DOI] [PMC free article] [PubMed] [Google Scholar]
- 2.Liddelow SA et al. Neurotoxic reactive astrocytes are induced by activated microglia. Nature 541, 481–487 (2017). [DOI] [PMC free article] [PubMed] [Google Scholar]
- 3.Burda JE & Sofroniew MV Reactive gliosis and the multicellular response to CNS damage and disease. Neuron 81, 229–248 (2014). [DOI] [PMC free article] [PubMed] [Google Scholar]
- 4.Guttenplan KA et al. Neurotoxic reactive astrocytes drive neuronal death after retinal injury. Cell Rep 31, 107776 (2020). [DOI] [PMC free article] [PubMed] [Google Scholar]
- 5.Anderson MA et al. Required growth facilitators propel axon regeneration across complete spinal cord injury. Nature 561, 396–400 (2018). [DOI] [PMC free article] [PubMed] [Google Scholar]
- 6.Escartin C et al. Reactive astrocyte nomenclature, definitions and future directions. Nat. Neurosci. 24, 312–325 (2021). [DOI] [PMC free article] [PubMed] [Google Scholar]
- 7.Wanner IB et al. Glial scar borders are formed by newly proliferated, elongated astrocytes that interact to corral inflammatory and fibrotic cells via STAT3-dependent mechanisms after spinal cord injury. J. Neurosci 33, 12870–12886 (2013). [DOI] [PMC free article] [PubMed] [Google Scholar]
- 8.Anderson MA et al. Astrocyte scar formation aids central nervous system axon regeneration. Nature 532, 195–200 (2016). [DOI] [PMC free article] [PubMed] [Google Scholar]
- 9.Herrmann JE et al. STAT3 is a critical regulator of astrogliosis and scar formation after spinal cord injury. J. Neurosci 28, 7231–7243 (2008). [DOI] [PMC free article] [PubMed] [Google Scholar]
- 10.Choi HB et al. Metabolic communication between astrocytes and neurons via bicarbonate-responsive soluble adenylyl cyclase. Neuron 75, 1094–1104 (2012). [DOI] [PMC free article] [PubMed] [Google Scholar]
- 11.Shim MS et al. Elevated intracellular cAMP exacerbates vulnerability to oxidative stress in optic nerve head astrocytes. Cell Death Dis 9, 285 (2018). [DOI] [PMC free article] [PubMed] [Google Scholar]
- 12.Paco S, Hummel M, Pla V, Sumoy L & Aguado F Cyclic AMP signaling restricts activation and promotes maturation and antioxidant defenses in astrocytes. BMC Genomics 17, 304 (2016). [DOI] [PMC free article] [PubMed] [Google Scholar]
- 13.Averaimo S et al. A plasma membrane microdomain compartmentalizes ephrin-generated cAMP signals to prune developing retinal axon arbors. Nat. Commun 7, 12896 (2016). [DOI] [PMC free article] [PubMed] [Google Scholar]
- 14.Goldberg JL et al. Retinal ganglion cells do not extend axons by default: promotion by neurotrophic signaling and electrical activity. Neuron 33, 689–702 (2002). [DOI] [PubMed] [Google Scholar]
- 15.Cameron EG & Kapiloff MS Intracellular compartmentation of cAMP promotes neuroprotection and regeneration of CNS neurons. Neural Regen. Res 12, 201–202 (2017). [DOI] [PMC free article] [PubMed] [Google Scholar]
- 16.Boczek T et al. Regulation of neuronal survival and axon growth by a perinuclear cAMP compartment. J. Neurosci 39, 5466–5480 (2019). [DOI] [PMC free article] [PubMed] [Google Scholar]
- 17.Corredor RG et al. Soluble adenylyl cyclase activity is necessary for retinal ganglion cell survival and axon growth. J. Neurosci 32, 7734–7744 (2012). [DOI] [PMC free article] [PubMed] [Google Scholar]
- 18.Lein ES et al. Genome-wide atlas of gene expression in the adult mouse brain. Nature 445, 168–176 (2007). [DOI] [PubMed] [Google Scholar]
- 19.Chen EY et al. Enrichr: interactive and collaborative HTml5 gene list enrichment analysis tool. BMC Bioinf 14, 128 (2013). [DOI] [PMC free article] [PubMed] [Google Scholar]
- 20.Zhang Y et al. Purification and characterization of progenitor and mature human astrocytes reveals transcriptional and functional differences with mouse. Neuron 89, 37–53 (2016). [DOI] [PMC free article] [PubMed] [Google Scholar]
- 21.Sun W et al. SOX9 is an astrocyte-specific nuclear marker in the adult brain outside the neurogenic regions. J. Neurosci 37, 4493–4507 (2017). [DOI] [PMC free article] [PubMed] [Google Scholar]
- 22.Kettenmann H & Ransom BR Neuroglia (Oxford Univ. Press, 2013). [Google Scholar]
- 23.Leung JY et al. Metallothionein promotes regenerative axonal sprouting of dorsal root ganglion neurons after physical axotomy. Cell. Mol. Life Sci 69, 809–817 (2012). [DOI] [PMC free article] [PubMed] [Google Scholar]
- 24.Malik VA et al. GDF15 promotes simultaneous astrocyte remodeling and tight junction strengthening at the blood–brain barrier. J. Neurosci. Res 98, 1433–1456 (2020). [DOI] [PubMed] [Google Scholar]
- 25.Jiwaji Z et al. Reactive astrocytes acquire neuroprotective as well as deleterious signatures in response to Tau and Ass pathology. Nat. Commun 13, 135 (2022). [DOI] [PMC free article] [PubMed] [Google Scholar]
- 26.Takeuchi H et al. VGF nerve growth factor inducible is involved in retinal ganglion cells death induced by optic nerve crush. Sci. Rep 8, 16443 (2018). [DOI] [PMC free article] [PubMed] [Google Scholar]
- 27.Burda JE et al. Divergent transcriptional regulation of astrocyte reactivity across disorders. Nature 606, 557–564 (2022). [DOI] [PMC free article] [PubMed] [Google Scholar]
- 28.Chen J, Martinez J, Milner TA, Buck J & Levin LR Neuronal expression of soluble adenylyl cyclase in the mammalian brain. Brain Res 1518, 1–8 (2013). [DOI] [PMC free article] [PubMed] [Google Scholar]
- 29.Gire V & Dulic V Senescence from G2 arrest, revisited. Cell Cycle 14, 297–304 (2015). [DOI] [PMC free article] [PubMed] [Google Scholar]
- 30.Zippin JH et al. Compartmentalization of bicarbonate-sensitive adenylyl cyclase in distinct signaling microdomains. FASEB J 17, 82–84 (2003). [DOI] [PubMed] [Google Scholar]
- 31.Lefkimmiatis K, Moyer MP, Curci S & Hofer AM “cAMP sponge”: a buffer for cyclic adenosine 3’, 5’-monophosphate. PLoS ONE 4, e7649 (2009). [DOI] [PMC free article] [PubMed] [Google Scholar]
- 32.O’Carroll SJ, Cook WH & Young D AAV targeting of glial cell types in the central and peripheral nervous system and relevance to human gene therapy. Front. Mol. Neurosci 13, 618020 (2020). [DOI] [PMC free article] [PubMed] [Google Scholar]
- 33.Hasel P, Rose IVL, Sadick JS, Kim RD & Liddelow SA Neuroinflammatory astrocyte subtypes in the mouse brain. Nat. Neurosci 24, 1475–1487 (2021). [DOI] [PubMed] [Google Scholar]
- 34.Patani R, Hardingham GE & Liddelow SA Functional roles of reactive astrocytes in neuroinflammation and neurodegeneration. Nat. Rev. Neurol 19, 395–409 (2023). [DOI] [PubMed] [Google Scholar]
- 35.Wang R, Seifert P & Jakobs TC Astrocytes in the optic nerve head of glaucomatous mice display a characteristic reactive phenotype. Invest. Ophthalmol. Vis. Sci 58, 924–932 (2017). [DOI] [PMC free article] [PubMed] [Google Scholar]
- 36.Quillen S et al. Astrocyte responses to experimental glaucoma in mouse optic nerve head. PLoS ONE 15, e0238104 (2020). [DOI] [PMC free article] [PubMed] [Google Scholar]
- 37.Lozano DC, Choe TE, Cepurna WO, Morrison JC & Johnson EC Early optic nerve head glial proliferation and Jak-Stat pathway activation in chronic experimental glaucoma. Invest. Ophthalmol. Vis. Sci 60, 921–932 (2019). [DOI] [PMC free article] [PubMed] [Google Scholar]
- 38.Cameron EG et al. Optic nerve crush in mice to study retinal ganglion cell survival and regeneration. Bio. Protoc. 10.21769/BioProtoc.3559 (2020). [DOI] [PMC free article] [PubMed] [Google Scholar]
- 39.Schildge S, Bohrer C, Beck K & Schachtrup C Isolation and culture of mouse cortical astrocytes. J. Vis. Exp 10.3791/50079 (2013). [DOI] [PMC free article] [PubMed] [Google Scholar]
- 40.Ho A et al. Genetic analysis of Mint/X11 proteins: essential presynaptic functions of a neuronal adaptor protein family. J. Neurosci 26, 13089–13101 (2006). [DOI] [PMC free article] [PubMed] [Google Scholar]
Associated Data
This section collects any data citations, data availability statements, or supplementary materials included in this article.
Supplementary Materials
Data Availability Statement
All data are available in the manuscript, Supplementary Information and online. Bulk and scRNA-seq data can be found at the NCBI Gene Expression Omnibus through accession numbers GSE245816 and GSE237675. Source data are provided with this paper.