Abstract
The pore structure of coal plays a key role in the effectiveness of gas extraction. Conventional hydraulic fracturing techniques have limited success in modifying the pore structure using clean fracturing fluid (CFF), and the stimulating effects of ultrasonic can enhance the effectiveness of CFF in modifying coal pore structures. To research the effects of ultrasonic stimulation on the pore structure of medium to high-rank coal when using CFF, this study employed mercury intrusion porosimetry (MIP) and low-temperature nitrogen adsorption (LT-N2A) methods to analyze the changes in pore structures after cooperative modification. The results indicate that the pore volume and surface area of medium to high rank coal exhibit an increase and followed by a decrease with increasing Ro,max values, while the average pore diameter and permeability demonstrate a decrease and followed by an increase with Ro,max. Although there are some variations in the results of MIP and LT-N2A analysis for different pore size ranges, the overall findings suggest that ultrasonic stimulation in conjunction with CFF effectively alters the coal pore structure. The most significant improvement was observed in coking coal, where pore volume increased by 22%, pore area decreased by 11% and tortuosity decreased by 47%. The improvement of lean coal is the smallest, the pore volume increases by about 7%, and the surface area decreases by about 14%. It is found that the modification of coal pore volume is mainly concentrated in transition pores and macropores. These research outcomes provide valuable insights into the application of ultrasonic technology in coalbed gas extraction.
Keywords: Clean fracturing fluid, Ultrasonic, Pore structure, Coalbed gas, Fractal dimension
Subject terms: Environmental impact, Coal, Natural gas
Introduction
In the future, coal will remain the main energy source for many countries, such as China and India. Coalbed methane (CBM) can induce coal and gas outbursts, and other disasters, which restricts the high-efficient mining of coal1–3. CBM is a kind of clean energy source, and its direct emission will also aggravate the greenhouse effect4,5. Therefore, mining CBM can reduce coal mine accidents, increase energy supply and help achieve carbon peaking6,7.
In the last 20 years, water jet cutting technology, water jet perforation technology, hydraulic fracturing technology, and other technologies have emerged one after another and have become the main technologies to enhance CBM extraction8–10. Among them, the application effect of hydraulic fracturing is more prominent, and it has been applied in most highly gassy mine in China11. To further improve the effectiveness of hydraulic fracturing technology, many new hydraulic fracturing technologies were proposed12–14, such as pulse fracturing15, tree-type fracturing16, and the fracturing pressure, fracturing range, and extraction effect also researched17–19. These research results have more or less promoted the development of hydraulic fracturing technology. In addition to optimizing fracturing technology, improving fracturing fluid is also an important means to improve hydraulic fracturing20–23, such as CFF, foam fracturing fluid, guar gum fracturing fluid and so on. Among them, CFF is one of the fracturing fluids with better application effect24. The research25 shows that the fracturing fluid has stronger fracturing ability, can form wider and more complex hydraulic fractures, and is conducive to CBM extraction. Fracturing fluid will also produce physicochemical reactions with minerals in coal, increase the pore structure and average pore diameter of coal. Zhou et al.26 found that CFF has a better wetting effect, can also reduce the functional groups, reduce the ash content, and increase the calorific value of coal combustion. Xue et al.27 compared the effects of Slickwater, Guar gel and VES fracturing fluid on the shape and fractal dimension of coal pores, and the effect of VES clean fracturing fluid was the most significant. Huang et al.28 compared different fracturing fluids on gas flow, and found that compared with foam fracturing fluid, water-based fracturing fluid gels have adverse effects on the permeability of gas. Ge et al.29 studied the impact of different types of fracturing fluids on pore volume and connectivity, and compared the effects by combining the changes in pore volume of different pore.
In addition, changing the external physical field can also promote the extraction of CBM, such as ultrasonic30,31, high-voltage electricity23,32 and so on. Among them, the study on the use of ultrasonic to enhance CBM has been carried out for many years, and its application potential is huge33. Scholars have also researched the use of ultrasonic to stimulate coal seam fracturing and promote gas desorption and flow34,35. Scholars such as Liu36 and Tang37 found that ultrasound can improve the shape and size of pores, expand the original cracks in coal seam and increase their connectivity, thus improving the permeability. Jiang et al.38 also confirmed the influence of ultrasonic on fracture width and permeability through numerical simulation, and found that coal body properties and ultrasonic incident angle are the main factors affecting the effect of ultrasonic on increasing coal seam permeability. Jiang et al.39 studied the effect of ultrasonic on the desorption rate and desorption amount of coalbed methane, and also established a model of CBM desorption under the action of ultrasonic according to the experimental results. Liu et al.40 studied the gas adsorption and diffusion of coal samples with different water content after ultrasonic stimulation, and found that the gas adsorption and diffusion coefficient increased significantly after ultrasonic stimulation, and the higher the water content, the more obvious.
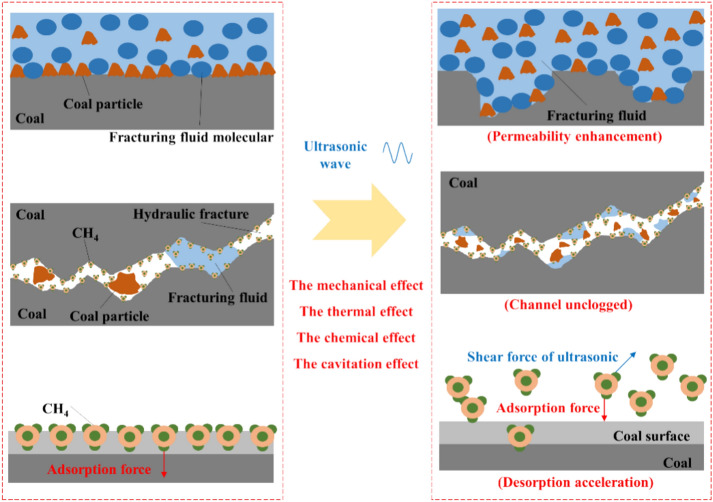
Zuo et al. combined the advantages of the above technologies to propose a new technology of ultrasonic and hydraulic fracturing to increase the permeability and gas extraction effect41. The research found that the fracturing fluid and ultrasonic can significantly improve the modification effect of coal seam, the ultrasonic power and temperature will also affect the modification effect42. As shown in Fig. 1, the thermal, cavitation, mechanical and chemical effects of ultrasonic waves can induce the extension direction of fractures, accelerate the reaction rate between coal and CFF, clear the extraction channel, promote the desorption and flow of CBM, and finally enhance the gas extraction effect. However, the applicability of this technology to different coal ranks is still unclear. Therefore, this paper carries out an immersion test of different coal samples affected by ultrasonic, and analyzes the changes of coal pore structure after treated by CFF. The research conclusions can expand the theory and technology of CBM mining and promote the development of ultrasonic assisted hydraulic fracturing technology.
Fig. 1.
Principle diagram of ultrasonic assisted hydraulic fracturing.
Experimental design
Samples preparation
Four samples of different coal ranks were obtained from four mines in Guizhou and Yunnan, China. The basic parameters were determined, as shown in Table 1. According to the China National Standards: Chinese classification of in seam coal (GB/T 17607-1998), the DH, WJ, and TC are medium-rank coal, and BL is high-rank coal.
Table 1.
The basic parameters of the coal samples.
| Sample | Coal ranks | Ro,max | Mad/% | Aad/% | Vdaf/% | FCad/% | Porosity/% |
|---|---|---|---|---|---|---|---|
| DH | Gas coal | 0.72 | 2.81 | 21.14 | 31.76 | 44.29 | 3.71 |
| WJ | Fat coal | 1.15 | 1.89 | 18.73 | 21.96 | 57.42 | 2.97 |
| TC | Coking coal | 1.53 | 2.17 | 17.67 | 18.85 | 61.31 | 5.06 |
| BL | Lean coal | 2.13 | 2.57 | 12.32 | 12.24 | 72.87 | 3.23 |
Experimental process
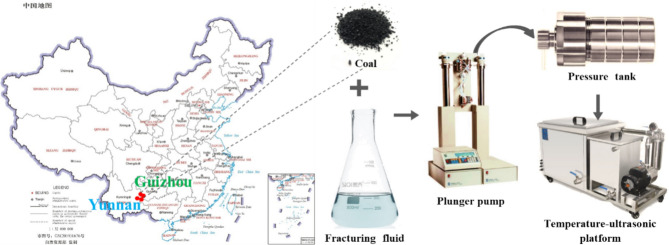
The coal samples were immersed in a high-pressure sealed tank for a duration of 4 h, the immersion pressure was 1.0 MPa, as shown in Fig. 2. The experimental temperature was maintained at a constant 40 °C. The ultrasonic parameters during the immersion process were set at 40 kHz with a total power of 1 kW. CFF was employed for the experiment, consisting of a mixture of 0.2 wt% Nasal, 0.8 wt% CTAC, and 1 wt% KCl. Preliminary experiments have indicated that this CFF can undergo chemical reactions with coal, and ultrasonic waves can significantly enhance the rate of these chemical reactions, thereby substantially improving the micro-pore structure of coal.
Fig. 2.
Flow chart of the experiment (the map from the Map Technology Review Center, Department of Natural Resources; http://bzdt.ch.mnr.gov.cn/browse.html?picId=%224o28b0625501ad13015501ad2bfc0280%22).
Testing methods
To assess the influence of ultrasonic-assisted CFF on coal samples of varying degrees of metamorphism, MIP and LT-N2A were chosen to analyze the changes in coal sample pore structure before and after the treatment.
Experimental results
MIP analysis
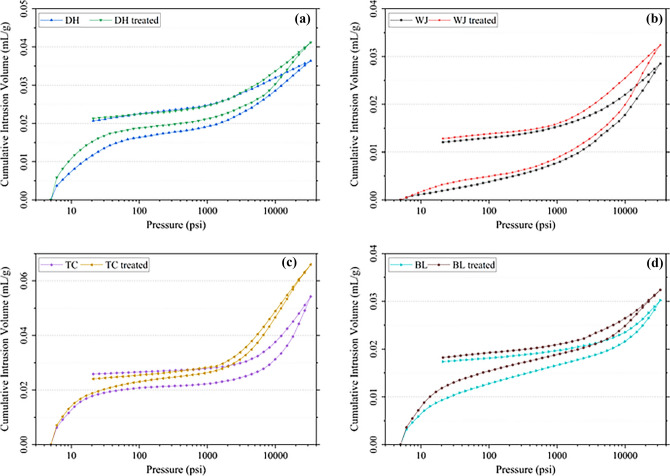
The MIP curves for the four coal samples are depicted in Fig. 3. Among them, the TC coal sample exhibits the highest pore volume, while the WJ sample shows the lowest, corresponding to the variations in porosity. It is evident that after the application of ultrasonic-assisted CFF, the MIP curves of the coal samples demonstrate varying degrees of alteration, with increased pore volumes observed across all coal ranks. This suggests that ultrasonic-assisted fracturing technology enhances permeability in different medium-ranked coals, although the extent of improvement varies. Furthermore, the efficiency of mercury withdrawal differs before and after the treatment. After the application of ultrasonic-assisted CFF, the mercury withdrawal rates for all coal samples increase, indicating improved pore connectivity and a reduction in the proportion of closed pores. Compared to the raw coal samples, ultrasonic-assisted CFF widens pore fractures, connects some closed pores, and reduces the complexity of pore throat structures, thereby facilitating the removal of mercury from closed pores during withdrawal.
Fig. 3.
The MIP curves of different coal samples. (a) The DH coal sample; (b) The WJ coal sample; (c) The TC coal sample; (d) The BL coal sample.
Intrusion volume
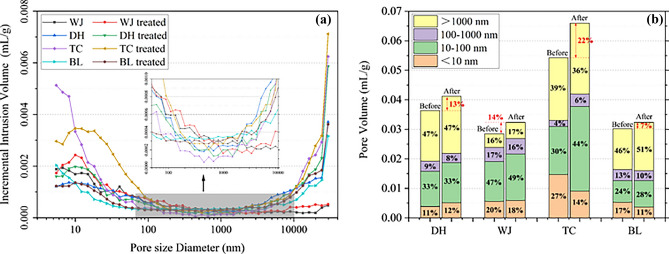
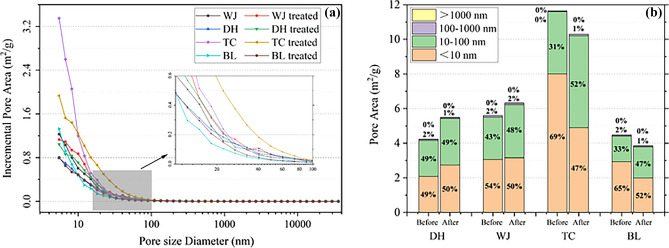
According to Hodott's aperture classification standard, pores with diameters less than 10 nm are referred to as micropores, pores ranging from 10 to 100 nm are termed transition pores, pores between 100 and 1000 nm are considered mesopores, and pores larger than 1000 nm are classified as macropores. Figure 4 presents the pore volume distribution curves and the distribution percentages of different pore sizes, respectively. The DH, TC, and BL coal samples exhibit similar pore size distributions, primarily consisting of transition pores and macropores, with fewer mesopores. In contrast, the lower-ranked WJ coal sample primarily consists of transition pores, with fewer macropores and mesopores. Notably, after the application of CFF, the different coal ranks show variations in the distribution of pore size categories: (a) For the DH coal sample, the percentage of pore volume in different pore sizes remains basically unchanged after the experiment, but the overall volume increases from 0.036 to 0.041 mL/g, a 13% increase. The volumes of micropores, transition pores, and macropores increase, while the volume of mesopores decreases, particularly for pores smaller than 20 nm and larger than 10,000 nm. Mid-sized pores show a decrease. This is primarily because the interaction of CFF with the coal widens existing pores to varying degrees, increasing their sizes, with fewer new micropores generated. (b) In the case of the WJ coal sample, there is a slight increase in transition pores after the experiment, while the distribution percentages of other pore sizes remain relatively stable. However, the overall volume increases from 0.029 to 0.032 mL/g, approximately a 14% increase. This suggests that some micropores in the coal sample have transformed into transition pores during the process. (c) For the TC coal sample, the volume increased from 0.054 to 0.066 mL/g after the experiment, a 22% increase, indicating that the interaction between CFF and TC coal is the most effective. The changes in the pore volumes of micropores and transition pores are particularly pronounced. Treated with ultrasonic-assisted CFF, the number of micropores decreases, while the number of transition pores increases, with little change in mesopores and macropores. This is primarily because the TC coal sample has the highest number of micropores, providing the largest contact area between CFF and coal, which facilitates the reaction and significantly alters the micropore sizes. Additionally, since transition pores range from 10 to 100 nm, under the same conditions, micropores are more likely to transform into transition pores. (d) The BL coal sample exhibits similarities to the TC coal sample, with a decrease in micropores and mesopores and a slight increase in transition pores and macropores. However, the total pore volume for the BL coal sample increases from 0.030 to 0.032 mL/g, representing an approximately 7% increase. This suggests that the interaction between CFF and the BL coal sample is less effective, mainly because the micropores are widened into transition pores, and relatively few new micropores are generated.
Fig. 4.
The pore volume distribution curves and percentages of different pore sizes. (a) The pore volume distribution curves; (b) The percentages of different pore sizes.
Pore area
It can also be found that, affected by the properties of specific surface area, the pore surface area (PSA) of coal samples of different coal ranks is principally micropores and transition pores, for about 98%. The PSA of DH, WJ, and BL coal samples are relatively small, while that of TC coal samples is larger. In Fig. 5, the PSA of DH and WJ coal samples increased after treated by ultrasonic assisted CFF, while the PSA of TC and BL samples decreased after the action of CFF. (a) For DH coal samples, after the experiment, the total PSA increased from 4.2 to 5.5 m2/g, an increase of about 30%, but the proportion of PSA of different pore sizes remained basically unchanged, which meant that the PSA of micropores and transition pores increased. Combined with the changes in the number of pore volumes, the pore size of the coal sample becomes larger after treated by CFF, and the micropores become transition pores. Besides, a small number of new micropores will be generated, ultimately resulting in an increase in the PSA of both micropores and transition pores with unchanged distribution percentages. (b) For the WJ coal sample, the total PSA increased from 5.6 to 6.3 m2/g after the experiment, an increase of about 13%. Specifically, the PSA of micropores changed a little, the PSA of transition pores increased, and the proportion of PSA increased by about 5%, indicating that new micropores were generated when the original micropores became transition pores in the WJ coal. (c) For TC coal, the total PSA decreased from 11.6 to 10.3 m2/g after the experiment, with a reduction of about 11%. The PSA of micropores decreased from 8.0 to 4.9 m2/g, and the PSA of transition pores increased from 3.6 to 5.3 m2/g, indicating that relatively few new micropores were generated after the interaction of CFF and TC coal. The possible reason is that there are many micropores in TC coal, and the contact area between CFF and coal is the largest, which is conducive to chemical reaction between CFF and coal. Finally, during the immersion process, CFF will chemically react with minerals around the micropores and expand the pores to become transition pores, without generating too many new micropores. It is also possible that there is less mineral content in the coal, making it difficult for the CFF to react with the coal. (d) Similar to the TC coal, the BL coal sample exhibits a decrease in the PSA of micropores and an increase in the PSA of transition pores after the experiment. The total PSA for the BL coal sample decreases from 4.5 to 3.9 m2/g, indicating a roughly 14% decrease. The PSA of micropores decreases from 2.9 to 2.0 m2/g, while the PSA of transition pores increases from 1.5 to 1.8 m2/g. This is also attributed to the limited generation of new micropores.
Fig. 5.
The pore area distribution curves and percentages of different pore sizes. (a) The pore area distribution curves; (b) The percentages of different pore sizes.
Fractal dimension
The fractal dimension can characterize the uniformity coefficient of coal seam pore structures. A smaller fractal dimension indicates a more uniform distribution of reservoir pore throats and stronger homogeneity. The fractal dimension of porous rocks typically falls between 2 and 3. The Menger model43 is used to analyze the fractal dimension of pores. The relationship between and is expressed by Eq. (1).
| 1 |
where VP is the cumulative mercury intake when the mercury intake pressure is P, D = A + 4, A is the slope of Eq. (1), D is the fractal dimension, and the larger D is, the stronger the pore heterogeneity is.
To get the average fractal dimension (DT) with data divided into micropores (< 100 nm), mesopores (100–1000 nm), and macropores (> 1000 nm) according to the aperture size44, and the fractal dimensions D1, D2, and D3 were calculated respectively. Then DT can be calculated as Eq. (2).
| 2 |
where , , and is the proportion of pore volume of micropores (< 100 nm), mesopores (100–1000 nm), and macropores (> 1000 nm), respectively.
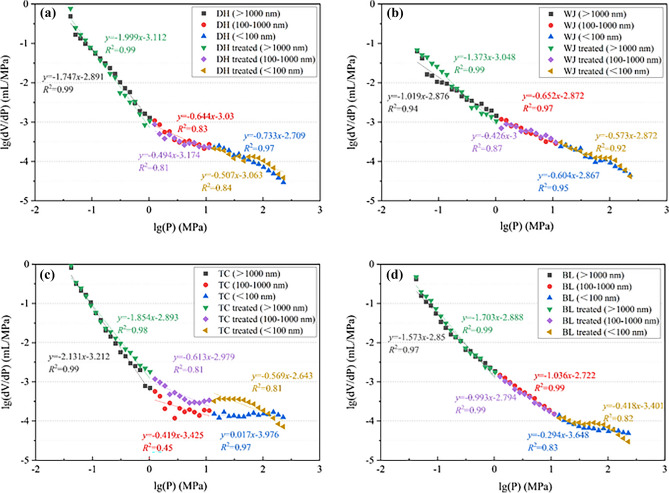
The D1, D2, and D3 can be obtained by piecewise fitting of the and data, as shown in Fig. 6.
Macropores: The fractal dimensions of DH, WJ, and BL coal samples all decreased after treated by CFF, with a reduction of approximately 11%. This suggests that the pore structure became simpler, and pore homogeneity increased. Combined with Fig. 4, it can be seen that after treated by CFF, the pore volume of macropores becomes larger, that is, the pore diameter becomes larger. Additionally, any protruding particles within the pores were eliminated, resulting in reduced pore tortuosity. Only the fractal dimension of TC increased after the treatment, with an increase of about 15%. Combined with Fig. 4, the pore volume of macropores is basically unchanged after CFF action, indicating that CFF action has little influence on macropores.
Mesopores: In contrast to macropores, the fractal dimensions of DH, WJ, and BL all increased by approximately 5% after the CFF treatment, while the fractal dimension of TC coal decreased by about 5%. Combined with the changes in the pore volume after treated by CFF in Fig. 4, only the pore volume of TC coal sample increases, and the pore structure becomes simple.
Micropores: The fractal dimensions of DH and WJ coal samples increased by 7% and 1% after the CFF treatment, respectively. While the fractal dimensions of TC and BL decreased by 15% and 3%, respectively. Combined with Fig. 4, it is found that the transition pores volume increases after CFF action, while the pore volume decreases in TC and BL coal samples and increases in DH and WJ coal samples after CFF action This indicates that micropores play a crucial role in determining the fractal dimension within this size range, primarily because micropores have smaller diameters, making them more sensitive to changes in pore shape.
Fig. 6.
Fractal dimension of coal samples. (a) The DH coal sample; (b) The WJ coal sample; (c) The TC coal sample; (d) The BL coal sample.
LT-N2A
Figure 7 shows the LT-N2 adsorption and desorption curves of four coal samples of different ranks before and after CFF action. The adsorption and desorption curves of different raw coal samples are basically similar. Among them, DH, TC, and BL exhibit relatively small hysteresis loops, while the hysteresis loop in WJ is not very pronounced. In the nitrogen adsorption curve, when the relative pressure is less than 0.9, the N2 adsorption amount increases relaxedly with the increase of the relative pressure. When the relative pressure is greater than 0.9, the adsorption amount of N2 increases rapidly. After treated by CFF, all coal samples exhibit varying degrees of hysteresis loops. Among them, the DH-treated coal sample has the most pronounced hysteresis loop, with the most significant changes occurring around a relative pressure of 0.5. This suggests that the morphological structure of the pores has changed. In addition, the volume of nitrogen adsorbed by different treated coals also changes to different degrees, indicating that the size and quantity of pores have changed.
Fig. 7.
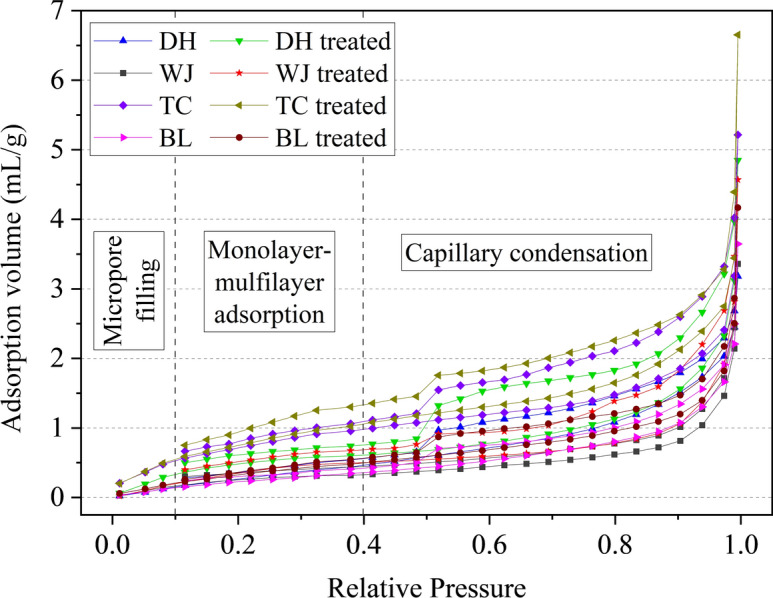
LT-N2 adsorption and desorption curves.
Pore morphology
The maximum nitrogen adsorption capacity of different raw coal samples does not vary significantly, but it increases to different degrees after the combined action of ultrasonic-assisted CFF. Among the raw coal samples, the TC coal exhibited the highest N2 adsorption capacity, while the DH coal showed the most significant increase after ultrasonic-assisted CFF treatment. The maximum nitrogen adsorption capacities for the DH, WJ, TC, and BL coal samples were 3.18 cm3/g, 3.36 cm3/g, 5.22 cm3/g, and 3.65 cm3/g, respectively. After the treatment with ultrasonic-assisted CFF, these capacities increased by 52.3%, 35.9%, 27.6%, and 14.3%, respectively. The number, size, and shape of pores are the dominant factors influencing nitrogen adsorption capacity. As coal rank increases, the rate of increase in maximum nitrogen adsorption capacity gradually decreases. This is primarily because higher-ranked coals typically have fewer mineral impurities, which reduces the efficacy of the reaction between CFF and the coal, limiting effective pore modification.
The adsorption and desorption curves provide insight into the morphology and quantity of micropores. It is observed that there is no coincidence between desorption and adsorption curves across the full pore size range of different coal samples, with the extent of the difference varying. The primary reason for this is capillary condensation of N2 in larger pores, leading to the formation of "hysteresis loops" of varying degrees. These hysteresis loops indicate the presence of micropores, especially at lower relative pressures, where significant adsorption hysteresis occurs. Notably, the desorption and adsorption curves for the DH-treated and WJ-treated coal samples exhibit a large gap, with pronounced hysteresis loops, indicating a relatively strong chemical reaction between CFF and coal. The pores formed in these samples are primarily open, with many micropores and a significant number of slit or parallel plate pores. In contrast, other coal samples, particularly the raw ones, exhibit smaller hysteresis loops, suggesting fewer slit or parallel plate pores and more poorly connected pores (such as wedge-shaped, conical, or cylindrical pores).
It is worth mentioning that inflection points appear near a relative pressure of 0.5, with the inflection point being most pronounced in the DH-treated coal sample and least in the WJ coal sample. This indicates varying numbers of ink-bottle-shaped pores in the samples. The specific reason for this is that the desorption rate of nitrogen slows at the bottleneck of ink-bottle-shaped pores. As the relative pressure decreases and the bottleneck is overcome, the desorption rate accelerates, causing the condensed liquid N2 in these pores to gush out rapidly, resulting in a steep decline in the desorption curve and forming an inflection point. Mineral impurities in coal generally exist as particles or layers and are connected with the original natural pores. When CFF reacts with these mineral impurities, it likely erodes the coal through the original natural pores, forming ink-bottle-shaped pores deep within the coal. Additionally, when the relative pressure approaches 1, the adsorption curve rises sharply and partially coincides with the desorption curve. This phenomenon is due to multimolecular layer adsorption in large pores within the coal, where the interaction between N2 molecules and the pore surface area (PSA) is relatively weak.
The fractal dimension
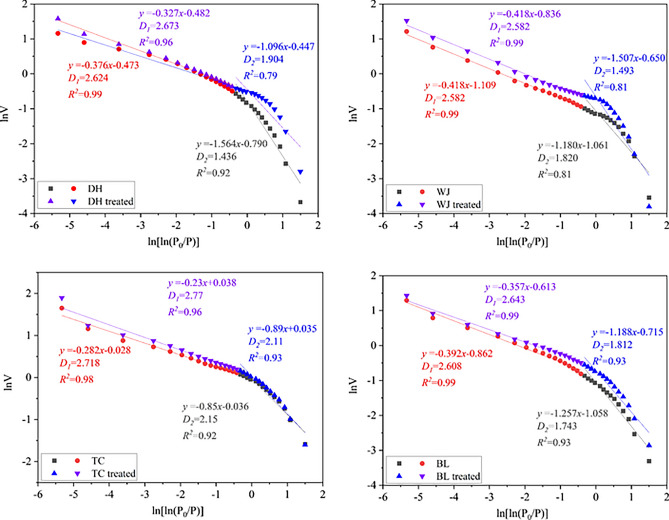
To further analyze the pore structure, the fractal dimension D of the pore was calculated using the Frenkel-Halsey-Hill (FHH) model45, as shown in Eq. (3). The specific results are shown in Fig. 8. Due to the existence of many ink-bottle shaped pores in the coal sample, an inflexion point appeared on the desorption curve. The fractal dimension calculated in sections can get accurate results. When the relative pressure is larger than 0.5, the fractal dimension is D1, and when the relative pressure is less than 0.5, the fractal dimension is D2. When the relative pressure is 0.5, the corresponding aperture is about 4.5 nm. The aperture measured by fractal dimension D1 is in the range of 4.5–100 nm, and the aperture measured by fractal dimension D2 is in the range of 2.0–4.5 nm.
| 3 |
where P0 is the gas-saturated vapor pressure of N2, MPa; P is the actual pressure, MPa; V is the corresponding N2 adsorption capacity, mL/g; V0 is the monolayer volume of N2 adsorption at standard temperature and pressure (ml/g); C is the constant; and A is the slope of the fitted curve. So the fractal dimension is A + 3. The fractal dimension always between 2 and 3, and the closer it is to 2, the smoother the pores.
Fig. 8.
The fractal dimension fitting results.
It can be observed that the fractal dimension D1 is approximately around 2.5 when the relative pressure exceeds 0.5, while D2 is generally less than 2 when the relative pressure is less than 0.5. When ultrasonic and CFF works together, the fractal dimension D1 shows a small increase with relatively minor changes. In contrast, D2 exhibits varying changes, with some increasing and others decreasing. Moreover, except for WJ coal, D2 of other treated coal was closer to 2.
Based on the principles of LT-N2A, when the relative pressure is less than 0.5, smaller pores are measured, otherwise is larger pores are measured. The relatively minor changes in fractal dimension D1 and the more substantial changes in fractal dimension D2 imply that the combined effect of ultrasonic and CFF treatment has a more pronounced impact on smaller pores and a less significant effect on larger pores. This is primarily due to the reactions between the CFF and coal, which results in the disappearance of mineral particles around smaller pores. The same mineral particles have a more significant impact on smaller pores, result in the greater variations in fractal dimension D2.
SEM
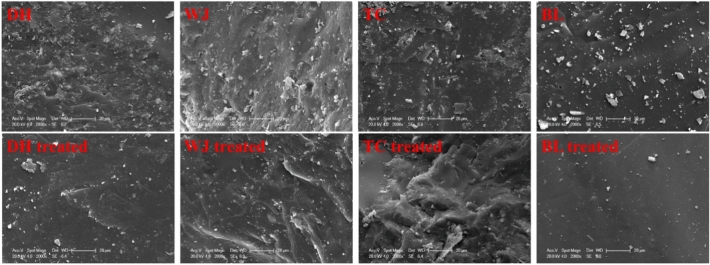
To analyze the changes in pore structure across different coal ranks after treatment with ultrasonic-assisted CFF, SEM was used to observe the coal samples before and after treatment. Figure 9 shows the specific scanning results. It is evident that the mineral particles attached to the coal of different ranks are significantly reduced after treatment. This reduction occurs because the mechanical vibrations from the ultrasound generate shear and tensile stresses, causing the attached mineral particles to detach from the coal sample surface. Additionally, the acid in the fracturing fluid chemically reacts with the mineral particles, dissolving them within the CFF. Regarding the pore morphology on the sample surfaces, slight differences are observed across the various coal ranks, primarily reflected in surface roughness and the presence of micropores. The SEM images reveal noticeable differences in the number and size of pores, indicating the creation of many new micron-scale pores. These microscale pores often develop from nanoscale pores, suggesting that new nanoscale pores are also generated during processing. Overall, the surfaces of the TC and BL coal samples appear smoother, while the surfaces of the WJ and TC coal samples show slightly more porosity. This difference is primarily due to the coal becoming denser and more brittle during the metamorphism process, making it easier to form a flat section during crushing. After treatment with ultrasonic-assisted CFF, the surfaces of all coal samples became smoother, with some of the original small undulations disappearing. These changes result from the chemical reaction between the CFF and the coal, combined with the surface washing effect of the ultrasound.
Fig. 9.
SEM photos of different coal samples.
Discussion
Variation rules of pore parameters
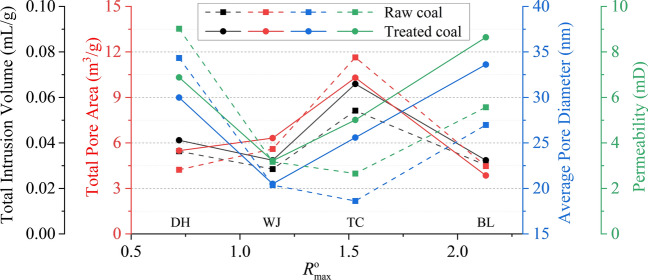
With the increase of the coal metamorphism degree, the total pore volume and total PSA both increase first and then decrease, and the peak value occurs when coking coal (Ro,max is 1.5), and the pore volume and total PSA are the largest. As shown in Fig. 10, the average pore diameter and permeability showed a trend of decreasing first and then increasing, and both showed a trough value when coking coal (Ro,max is 1.5). This is mainly because the porosity of coal is affected by the degree of metamorphism, and the porosity will first decrease and then rise as the metamorphism degree increase. This is mainly because in the process of metamorphism, affected by temperature and geological conditions, the molecular structure of coal has changed, resulting in changes in the porosity of coal. After treated by ultrasonic and CFF, the total pore volume and total PSA still increase first and then decrease, and the peak value appears when coking coal (Ro,max is 1.5). The average pore diameter and permeability still showed a trend of decrease first and then increase, but the valley value appeared in the fat coal (Ro,max is 1.1). The reason for this phenomenon is that TC coal sample has the most pronounced response to CFF, which has a great influence on pore diameter and permeability.
Fig. 10.
Variation rules of pore parameters by MIP data.
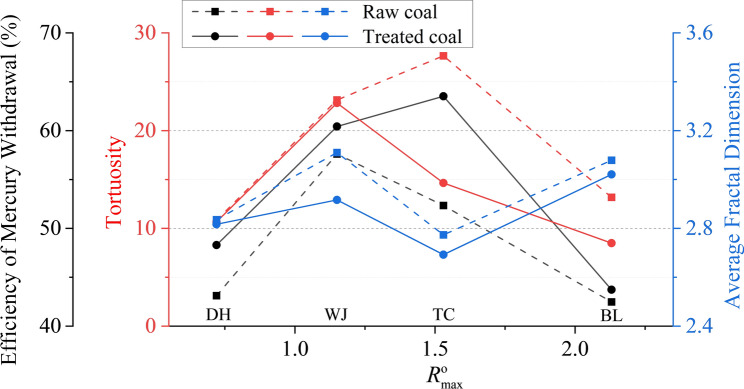
Mercury withdrawal efficiency and tortuosity are also parameters used to assess coal seam pore structure and gas flow efficiency. The higher mercury withdrawal efficiency, the less proportion of closed holes and the more proportion of open holes in the coal sample, the more helpful the gas desorption and flow. The greater the tortuosity of cracks, the greater the gas flow resistance. For the raw coal in Fig. 11, both mercury withdrawal efficiency and tortuosity show an initial increase followed by a decrease when metamorphism degree increase. The tortuosity is the largest when it is coking coal (Ro,max is 1.5), and the mercury withdrawal efficiency is the highest when it is fat coal (Ro,max is 1.1). After the combined treatment of ultrasonic and CFF, the trends for mercury withdrawal efficiency and tortuosity remain consistent. However, the peak of mercury withdrawal efficiency is observed at the coke coal (Ro,max is 1.5), while tortuosity reaches its maximum at the fat coal (Ro,max is 1.1). Besides, the average fractal dimension increases first, then decreases and then increases, and the minimum value appears in coking coal (Ro,max is 1.5).
Fig. 11.
Variation rules of pore structure by MIP data.
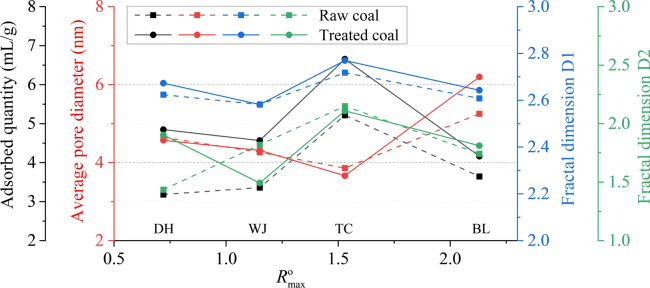
We also analyzed the variation trend of LT-N2A results with coal rank, which show some differences compared to the MIP results, as detailed in Fig. 12. It can be found that with the increase of metamorphism degree, the N2 adsorption capacity of the raw coal shows a trend of first increasing and then decreasing, and the peak value appears when it is coking coal (Ro,max is 1.5). The average pore diameter also shows the same trend, and also appears the maximum value at coking coal (Ro,max is 1.5). These changes are related to the coal metamorphism degree, as the pore distribution and porosity of coal continuously change during the coal's metamorphic process. After combined treatment of ultrasonic and CFF, the adsorption amount of N2 increases in all coal rank samples, and the average size of pore shows both decreases and increases. The main reason is that the pore structure and mineral impurities of different coal samples are different, and the effect of CFF is also different. Only the BL treated coal samples show a significant increase in the average pore size, with an increase of approximately 18%, while the average pore size of the other samples remains relatively unchanged. The primary reason is that the CFF changes the natural pore diameter, but also produces new small pores, so the average pore diameter does not have a big change. Combined with MIP data, it can be found that due to the development of pore structure of BL coal sample, it is more conducive to chemical reaction with CFF, so the pore volume and average pore diameter change greatly.
Fig. 12.
Variation rules of pore structure by LT-N2A data.
Furthermore, the changes in fractal dimensions D1 and D2 for different pore size ranges exhibit distinct trends, with D2 showing significantly larger variations compared to D1. The D1 of raw coal and treated coal decreased first and then increased as the metamorphism degree increase, and the variation of D1 after the action of CFF was small, about 2% on average. The D2 of raw coal samples exhibits a trend of increasing first and then decreasing, while for treated coal samples, D2 shows a pattern of decreasing initially, then increasing, and finally decreasing again with increasing metamorphism degree. It's notable that DH and WJ coal samples exhibit relatively large changes in D2 after CFF treatment, with variations of 33% and 18%, respectively. This is because, with the increase in coal metamorphism, the micropore structure in the smaller pore sections becomes more complex and is more susceptible to significant changes after the action of CFF. In contrast, larger pores are less affected by CFF and are less likely to undergo substantial changes. Additionally, differences were observed in the trends of fractal dimensions obtained from MIP and LT-N2A. We believe there are three main reasons for these differences. First, MIP and LT-N2A are based on different testing principles, and the high pressure used in MIP can damage the pores, leading to inaccuracies in the results. Second, MIP targets pores within the size range of 5 to 340,000 nm, while LT-N2A focuses on pores ranging from 2 to 500 nm. The differences in the targeted pore sizes between these two methods contribute to the variations in fractal dimension trends. Third, CFF has a significant influence on micropores and transition pores, leading to substantial changes in fractal dimensions and pore volume in these regions. These factors collectively result in the differing fractal dimension trends observed.
The reasons and forms of pore changes
Coal is a mixture containing various mineral impurities, including Montmorillonite ((Na,Ca)0.33(Al,Mg)2[Si4O10](OH)2·nH2O), Calcite (CaCO3), Kaolinite (Al[Si4O10](OH)8), Dolomite (CaMg(CO3)2), Fe2O3, and other minerals that are randomly distributed within coal seams. The CFF NaSal undergoes ionization to produce H+, as represented by the possible ionization Eq. (4). H+ then react chemically with minerals such as Calcite (CaCO3), Kaolinite (Al[Si4O10](OH)8), Fe2O3, and other minerals. The four samples belong to different coal ranks, and the mineral impurities contained in them will be different. The possible chemical equations for these reactions are presented in Eqs. (5)–(14).
During the chemical reactions between CFF and mineral impurities within coal, the effectiveness of these reactions depends on the degree of contact between the CFF and the minerals. The more extensive the contact, the more active the CFF molecules become, resulting in better chemical reaction outcomes. In the case of TC coal samples, the change in pore volume is most significant and evident. Mainly because the TC coal sample has the largest surface area, it can ensure that the CFF is in full contact with mineral impurities, increasing the possibility of chemical reactions. Additionally, under normal conditions, chemical reactions can lead to concentration gradients and steric hindrance, resulting in a gradual decrease in the chemical reaction rate. However, ultrasonic can accelerate the activity of chemical molecules in the CFF, effectively promoting and enhancing the progress of these reactions46,47.
| 4 |
| 5 |
| 6 |
| 7 |
| 8 |
| 9 |
| 10 |
| 11 |
| 12 |
| 13 |
| 14 |
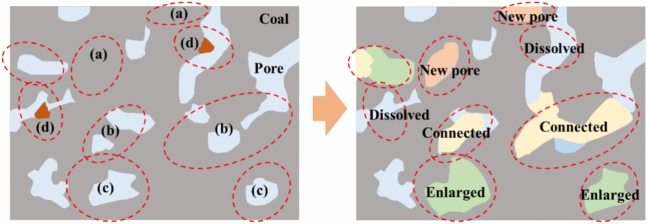
CFF and coal undergo physical or chemical reactions that can have four key effects on coal samples, as illustrated in Fig. 13: (a) New Pore Formation: CFF interacts with coal, eroding and damaging the coal sample, leading to the creation of micropores or small pores on the coal’s surface. The location of these newly formed pores is random but generally influenced by the positions of mineral particles on the coal surface. While a significant number of new pores are generated, their small size does not notably impact the overall pore volume but does increase the coal sample’s specific surface area (PSA), particularly for small pores. (b) Pore Enlargement: CFF may penetrate pre-existing pores in the coal, where it undergoes physical and chemical reactions with the surrounding mineral particles, thereby enlarging these pores. Typically, the number of small pores increases the most, while the number of medium and large pores increases less. This is primarily determined by the distribution of pore numbers and the classification of pore sizes. Since micropores are the most abundant in coal samples, and because the size intervals of micropores (< 10 nm) and transition pores (10–100 nm) are similar, micropores are more likely to transform into transition pores. (c) Pore Connectivity: The chemical reaction between CFF and the coal sample may widen and connect multiple pores, leading to the formation of new, larger pores. Additionally, the pressure exerted by CFF within the pores can cause the coal sample’s pores to break through barriers with previously closed pores, allowing access to these closed pores during the expansion process, thus forming new and larger pores. This process significantly increases pore size and may also impact the tortuosity of the pores. (d) Dissolution: As CFF enters the pores, attached particles within the pores may restrict its flow, reducing the permeability of the coal. The flow of CFF scours these attached particles, accelerates the physicochemical reactions between CFF and the particles, and smoothens the pores, thereby reducing their tortuosity.
Fig.13.
The possible four effects on coal samples.
The rate of interaction between the coal sample and the CFF depends on the concentration of the CFF and the contact area between the CFF and the coal sample (the surface area of the coal sample). When the concentration of CFF remains constant, a larger coal sample surface area ensures more extensive contact between the CFF and the coal, resulting in more chemical reactions and improved treatment effectiveness. This lead to the pore volume and mercury withdrawal efficiency of TC coal increase the most.
Conclusion
Under the action of ultrasonic stimulation, the CFF can effectively modify the micropore structure. In this paper, the modification effect of coal pore structure of different ranks was analyzed by MIP and LT-N2A. The conclusions as bellow:
The original pore parameters and pore complexity of coal samples differ across various coal ranks. In medium to high-rank coals, pore volume and surface area show an initial increase followed by a decrease trend with respect to Ro,max, where coking coal exhibits relatively higher pore volume and surface area. Conversely, the average pore size and permeability decreased first and then increased with Ro,max, with fat coal having a relatively smaller average pore diameter and permeability.
Based on the data obtained from MIP, the pore volume of coal from different ranks increased after modification. However, the surface area from various ranks exhibited different degrees of increase or decrease. This is mainly due to the changes in the average pore diameter resulting from the modification by CFF under the influence of ultrasonic waves. Overall, the modification of coking coal by CFF under the influence of ultrasonic waves is the most significant.
According to the LT-N2A results, the gas adsorption capacity of different coal ranks significantly increased after modification under the influence of ultrasonic waves, with coking coal exhibiting a relatively large increase in average pore diameter (approximately 18%). The different effects on the pores also lead to distinct trends in the changes of fractal dimensions D1 and D2 in various pore size ranges.
CFF will chemically react with coal, which may have the following effects on coal samples: CFF will erode coal and form new pore on the coal surface; CFF enters the pores in the coal sample and enlarges the pore size; CFF connects multiple pores to form new large pores; CFF dissolves attached mineral particles on the coal surface.
Acknowledgements
This study was financially supported by the National Natural Science Foundation of China (No. 52304129), Guizhou Provincial Science and Technology Projects (ZK[2023] general 446, Zhi Cheng [2022] General 016). Part of this work was also jointly founded by the open project of Guizhou Provincial Double Carbon and Renewable Energy Technology Innovation Research Institute (DCRE-2023-14).
Author contributions
Zuo Shaojie: Writing-Original draft preparation, Conceptualization, Methodology. Xu Zhiyuan: Data curation, Software. Zhou Dongping: Visualization, Investigation. Ma Zhenqian: Writing-review and editing, Resources, Visualization, Supervision. Liu Chengwei: Supervision, Investigation. Zhao Fuping: Visualization.
Data availability
The datasets used and analysed during the current study available from the corresponding author on reasonable request.
Competing interests
The authors declare no competing interests.
Footnotes
Publisher's note
Springer Nature remains neutral with regard to jurisdictional claims in published maps and institutional affiliations.
References
- 1.Checko, J., Urych, T., Magdziarczyk, M. & Smolinski, A. Research on the processes of injecting CO2 into coal seams with CH4 recovery using horizontal wells. Energies10.3390/en13020416 (2020). 10.3390/en13020416 [DOI] [Google Scholar]
- 2.Liu, P., Fan, J. Y., Jiang, D. Y. & Li, J. J. Evaluation of underground coal gas drainage performance: Mine site measurements and parametric sensitivity analysis. Process Saf. Environ. Prot.148, 711–723. 10.1016/j.psep.2021.01.054 (2021). 10.1016/j.psep.2021.01.054 [DOI] [Google Scholar]
- 3.Okere, C. J. et al. Experimental, algorithmic, and theoretical analyses for selecting an optimal laboratory method to evaluate working fluid damage in coal bed methane reservoirs. Fuel10.1016/j.fuel.2020.118513 (2020). 10.1016/j.fuel.2020.118513 [DOI] [Google Scholar]
- 4.Lekontsev, Y. M., Sazhin, P. V., Novik, A. V. & Mezentsev, Y. B. Methane production rate in hydraulic fracturing of coal seams. J. Min. Sci.57, 595–600. 10.1134/S1062739121040062 (2021). 10.1134/S1062739121040062 [DOI] [Google Scholar]
- 5.Zou, Q. L., Liu, H., Jiang, Z. B. & Wu, X. Gas flow laws in coal subjected to hydraulic slotting and a prediction model for its permeability-enhancing effect. Energy Source Part A10.1080/15567036.2021.1936692 (2021). 10.1080/15567036.2021.1936692 [DOI] [Google Scholar]
- 6.Lloyd, M. K. et al. Methoxyl stable isotopic constraints on the origins and limits of coal-bed methane. Science374, 894. 10.1126/science.abg0241 (2021). 10.1126/science.abg0241 [DOI] [PubMed] [Google Scholar]
- 7.Serdyukov, S. V., Kurlenya, M. V., Rybalkin, L. A. & Shilova, T. V. Hydraulic fracturing effect on filtration resistance in gas drainage hole area in coal. J. Min. Sci.55, 175–184. 10.1134/S1062739119025432 (2019). 10.1134/S1062739119025432 [DOI] [Google Scholar]
- 8.Lu, Y. Y., Ge, Z. L., Yang, F., Xia, B. W. & Tang, J. R. Progress on the hydraulic measures for grid slotting and fracking to enhance coal seam permeability. Int. J. Min. Sci. Technol.27, 867–871. 10.1016/j.ijmst.2017.07.011 (2017). 10.1016/j.ijmst.2017.07.011 [DOI] [Google Scholar]
- 9.Zuo, S. J., Peng, S. Q., Zhou, D. P., Wang, C. W. & Zhang, L. An analytical model of the initiation pressure for multilayer tree-type hydraulic fracturing in gas-bearing coal seams. Geomech. Geophys. Geo10.1007/s40948-022-00509-9 (2022). 10.1007/s40948-022-00509-9 [DOI] [Google Scholar]
- 10.Zuo, S. J., Zhang, L. & Deng, K. Experimental study on gas adsorption and drainage of gas-bearing coal subjected to tree-type hydraulic fracturing. Energy Rep.8, 649–660. 10.1016/j.egyr.2021.12.003 (2022). 10.1016/j.egyr.2021.12.003 [DOI] [Google Scholar]
- 11.Li, L. W. & Wu, W. B. Variation law of roof stress and permeability enhancement effect of repeated hydraulic fracturing in low-permeability coal seam. Energy Sci. Eng.9, 1501–1516. 10.1002/ese3.909 (2021). 10.1002/ese3.909 [DOI] [Google Scholar]
- 12.Lu, W. Y. & He, C. C. Numerical simulation of the fracture propagation of linear collaborative directional hydraulic fracturing controlled by pre-slotted guide and fracturing boreholes. Eng. Fract. Mech.10.1016/j.engfracmech.2020.107128 (2020). 10.1016/j.engfracmech.2020.107128 [DOI] [Google Scholar]
- 13.Talapatra, A., Halder, S. & Chowdhury, A. I. Enhancing coal bed methane recovery: Using injection of nitrogen and carbon dioxide mixture. Pet. Sci. Technol.39, 49–62. 10.1080/10916466.2020.1831533 (2021). 10.1080/10916466.2020.1831533 [DOI] [Google Scholar]
- 14.Zhong, J. Y., Ge, Z. L., Lu, Y. Y., Zhou, Z. & Zheng, J. W. New Mechanical model of slotting-directional hydraulic fracturing and experimental study for coalbed methane development. Nat. Resour. Res.30, 639–656. 10.1007/s11053-020-09736-x (2021). 10.1007/s11053-020-09736-x [DOI] [Google Scholar]
- 15.Wei, C., Zhang, B., Li, S. C., Fan, Z. X. & Li, C. X. Interaction between hydraulic fracture and pre-existing fracture under pulse hydraulic fracturing. Spe. Prod. Oper.36, 553–571. 10.2118/205387-Pa (2021). 10.2118/205387-Pa [DOI] [Google Scholar]
- 16.Zuo, S. J., Ge, Z. L., Deng, K., Zheng, J. W. & Wang, H. M. Fracture initiation pressure and failure modes of tree-type hydraulic fracturing in gas-bearing coal seams. J. Nat. Gas Sci. Eng.10.1016/j.jngse.2020.103260 (2020). 10.1016/j.jngse.2020.103260 [DOI] [Google Scholar]
- 17.Liu, P., Ju, Y., Feng, Z. & Mao, L. T. Characterization of hydraulic crack initiation of coal seams under the coupling effects of geostress difference and complexity of pre-existing natural fractures. Geomech. Geophys. Geo.10.1007/s40948-021-00288-9 (2021). 10.1007/s40948-021-00288-9 [DOI] [Google Scholar]
- 18.Ren, Q. S. et al. CDEM-based simulation of the 3D propagation of hydraulic fractures in heterogeneous coalbed Methane reservoirs. Comput. Geotech.10.1016/j.compgeo.2022.104992 (2022). 10.1016/j.compgeo.2022.104992 [DOI] [Google Scholar]
- 19.Zuo, S. J., Ge, Z. L., Lu, Y. Y., Cao, S. R. & Zhang, L. Analytical and experimental investigation of perforation layout parameters on hydraulic fracture propagation. J. Energ. Resour. ASME10.1115/1.4047596 (2021). 10.1115/1.4047596 [DOI] [Google Scholar]
- 20.Lu, Y. Y. et al. Influence of viscoelastic surfactant fracturing fluid on coal pore structure under different geothermal gradients. J. Taiwan Inst. Chem. E.97, 207–215. 10.1016/j.jtice.2019.01.024 (2019). 10.1016/j.jtice.2019.01.024 [DOI] [Google Scholar]
- 21.Meng, Y., Li, Z. P. & Lai, F. P. Evaluating the filtration property of fracturing fluid and fracture conductivity of coalbed methane wells considering the stress-sensitivity effects. J. Nat. Gas Sci. Eng.10.1016/j.jngse.2020.103379 (2020). 10.1016/j.jngse.2020.103379 [DOI] [Google Scholar]
- 22.Wang, Z. P. et al. Effects of acid-based fracturing fluids with variable hydrochloric acid contents on the microstructure of bituminous coal: An experimental study. Energy10.1016/j.energy.2021.122621 (2022).36569119 10.1016/j.energy.2021.122621 [DOI] [Google Scholar]
- 23.Zhu, C. J. et al. Experimental study on the microscopic characteristics affecting methane adsorption on anthracite coal treated with high-voltage electrical pulses. Adsorpt. Sci. Technol.36, 170–181. 10.1177/0263617416686977 (2018). 10.1177/0263617416686977 [DOI] [Google Scholar]
- 24.Yang, F., Ge, Z. L., Zheng, J. L. & Tian, Z. Y. Viscoelastic surfactant fracturing fluid for underground hydraulic fracturing in soft coal seams. J. Pet. Sci. Eng.169, 646–653. 10.1016/j.petrol.2018.06.015 (2018). 10.1016/j.petrol.2018.06.015 [DOI] [Google Scholar]
- 25.Zhao, H. F., Liu, C. S., Xiong, Y. G., Zhen, H. B. & Li, X. J. Experimental research on hydraulic fracture propagation in group of thin coal seams. J. Nat. Gas Sci. Eng.10.1016/j.jngse.2022.104614 (2022). 10.1016/j.jngse.2022.104614 [DOI] [Google Scholar]
- 26.Zhou, G. et al. Experimental study and analysis on physicochemical properties of coal treated with clean fracturing fluid for coal seam water injection. J. Ind. Eng. Chem.108, 356–365. 10.1016/j.jiec.2022.01.012 (2022). 10.1016/j.jiec.2022.01.012 [DOI] [Google Scholar]
- 27.Xue, S., Huang, Q. M., Wang, G., Bing, W. & Li, J. Experimental study of the influence of water-based fracturing fluids on the pore structure of coal. J. Nat. Gas Sci. Eng.10.1016/j.jngse.2021.103863 (2021). 10.1016/j.jngse.2021.103863 [DOI] [Google Scholar]
- 28.Huang, Q. M., Li, M. Y., Li, J., Gui, Z. & Du, F. Comparative experimental study on the effects of water- and foam-based fracturing fluids on multiscale flow in coalbed methane. J. Nat. Gas Sci. Eng.10.1016/j.jngse.2022.104648 (2022). 10.1016/j.jngse.2022.104648 [DOI] [Google Scholar]
- 29.Ge, Z. L. et al. Effect of different types of fracturing fluid on the microstructure of anthracite: an experimental study. Energy Source Part A10.1080/15567036.2021.1980635 (2021). 10.1080/15567036.2021.1980635 [DOI] [Google Scholar]
- 30.Sun, Y. et al. Changes of coal molecular and pore structure under ultrasonic stimulation. Energy Fuels35, 9847–9859. 10.1021/acs.energyfuels.1c00621 (2021). 10.1021/acs.energyfuels.1c00621 [DOI] [Google Scholar]
- 31.Zhang, J., Luo, W., Wan, T. Y., Wang, Z. W. & Hong, T. Y. Experimental investigation of the effects of ultrasonic stimulation on adsorption, desorption and seepage characteristics of shale gas. J. Pet. Sci. Eng.10.1016/j.petrol.2021.108418 (2021). 10.1016/j.petrol.2021.108418 [DOI] [Google Scholar]
- 32.Jia, Q. F. et al. AFM characterization of physical properties in coal adsorbed with different cations induced by electric pulse fracturing. Fuel10.1016/j.fuel.2022.125247 (2022). 10.1016/j.fuel.2022.125247 [DOI] [Google Scholar]
- 33.Wang, Z. J., Xu, Y. M. & Suman, B. Research status and development trend of ultrasonic oil production technique in China. Ultrason. Sonochem.26, 1–8. 10.1016/j.ultsonch.2015.01.014 (2015). 10.1016/j.ultsonch.2015.01.014 [DOI] [PubMed] [Google Scholar]
- 34.Chen, X. X., Zhang, L. & Shen, M. L. Experimental research on desorption characteristics of gas-bearing coal subjected to mechanical vibration. Energy Explor. Exploitation38, 1454–1466. 10.1177/0144598720956286 (2020). 10.1177/0144598720956286 [DOI] [Google Scholar]
- 35.Peng, S. Q. et al. Research status and trend of coal and gas outburst: a literature review based on VOSviewer. Int. J. Oil Gas Coal T.33, 248–281. 10.1504/Ijogct.2023.131646 (2023). 10.1504/Ijogct.2023.131646 [DOI] [Google Scholar]
- 36.Liu, P., Liu, A., Zhong, F. X., Jiang, Y. D. & Li, J. J. Pore/fracture structure and gas permeability alterations induced by ultrasound treatment in coal and its application to enhanced coalbed methane recovery. J. Pet. Sci. Eng.10.1016/j.petrol.2021.108862 (2021). 10.1016/j.petrol.2021.108862 [DOI] [Google Scholar]
- 37.Tang, Z. Q., Zhai, C., Zou, Q. L. & Qin, L. Changes to coal pores and fracture development by ultrasonic wave excitation using nuclear magnetic resonance. Fuel186, 571–578. 10.1016/j.fuel.2016.08.103 (2016). 10.1016/j.fuel.2016.08.103 [DOI] [Google Scholar]
- 38.Jiang, Y. P. & Xing, H. L. Numerical modelling of acoustic stimulation induced mechanical vibration enhancing coal permeability. J. Nat. Gas Sci. Eng.36, 786–799. 10.1016/j.jngse.2016.11.008 (2016). 10.1016/j.jngse.2016.11.008 [DOI] [Google Scholar]
- 39.Jiang, Y. D., Song, X., Liu, H. & Cui, Y. Z. Laboratory measurements of methane desorption on coal during acoustic stimulation. Int. J. Rock Mech. Min. Sci.78, 10–18. 10.1016/j.ijrmms.2015.04.019 (2015). 10.1016/j.ijrmms.2015.04.019 [DOI] [Google Scholar]
- 40.Liu, P., Fan, L., Fan, J. Y. & Zhong, F. X. Effect of water content on the induced alteration of pore morphology and gas sorption/diffusion kinetics in coal with ultrasound treatment. Fuel10.1016/j.fuel.2021.121752 (2021).33408422 10.1016/j.fuel.2021.121752 [DOI] [Google Scholar]
- 41.Zuo, S. J. et al. Mechanism of a novel ultrasonic promoting fracturing technology in stimulating permeability and gas extraction. Energy Rep.8, 12776–12786. 10.1016/j.egyr.2022.09.132 (2022). 10.1016/j.egyr.2022.09.132 [DOI] [Google Scholar]
- 42.Zuo, S. J. et al. The effect of temperature and ultrasonic power on the microstructure evolution of coal modified by clean fracturing fluid: An experimental study. Energy10.1016/j.energy.2024.132436 (2024). 10.1016/j.energy.2024.132436 [DOI] [Google Scholar]
- 43.Cai, Y. D., Liu, D. M., Yao, Y. B., Li, J. Q. & Liu, J. L. Fractal characteristics of coal pores based on classic geometry and thermodynamics models. Acta Geol. Sin.-Engl. Ed.85, 1150–1162. 10.1111/j.1755-6724.2011.00247.x (2011). 10.1111/j.1755-6724.2011.00247.x [DOI] [Google Scholar]
- 44.Li, P., Zheng, M., Bi, H., Wu, S. T. & Wang, X. R. Pore throat structure and fractal characteristics of tight oil sandstone: A case study in the Ordos Basin, China. J. Pet. Sci. Eng.149, 665–674. 10.1016/j.petrol.2016.11.015 (2017). 10.1016/j.petrol.2016.11.015 [DOI] [Google Scholar]
- 45.Zheng, Y. F. et al. Microstructure evolution of bituminite and anthracite modified by different fracturing fluids. Energy10.1016/j.energy.2022.125732 (2023). 10.1016/j.energy.2022.125732 [DOI] [Google Scholar]
- 46.Jung, Y., Ko, H., Jung, B. & Sung, N. Application of ultrasonic system for enhanced sewage sludge disintegration: A comparative study of single- and dual-frequency. Ksce J. Civ. Eng.15, 793–797. 10.1007/s12205-011-0832-6 (2011). 10.1007/s12205-011-0832-6 [DOI] [Google Scholar]
- 47.Shi, Q. M., Qin, Y., Zhou, B. Y. & Wang, X. K. Porosity changes in bituminous and anthracite coal with ultrasonic treatment. Fuel10.1016/j.fuel.2019.115739 (2019). 10.1016/j.fuel.2019.115739 [DOI] [Google Scholar]
Associated Data
This section collects any data citations, data availability statements, or supplementary materials included in this article.
Data Availability Statement
The datasets used and analysed during the current study available from the corresponding author on reasonable request.


