
Figure 1.
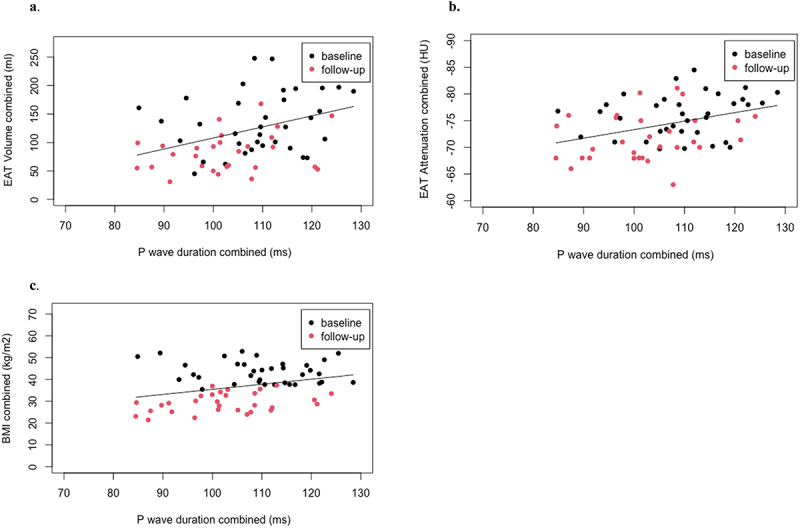
Figure 1 shows the relation between p-wave duration on the x-axes and EAT characteristics and BMI on the y-axes. Analyses were performed with linear mixed models: 10 ms increase in p-wave relates to 1a: a 19.4 ml larger volume of EAT (p = 0.005), 1b: −1.7HU units lower EAT attenuation (p = 0.002), and 1c: a 2.4 kg/m2 higher BMI (p = 0.02).