Abstract
We have used oligonucleotides containing molecular beacons to determine melting profiles for intramolecular DNA duplexes, triplexes and quadruplexes (tetraplexes). The synthetic oligonucleotides used in these studies contain a fluorophore (fluorescein) and quencher (methyl red) attached either to deoxyribose or to the 5 position of dU. In the folded DNA structures the fluorophore and quencher are in close proximity and the fluorescence is quenched. When the structures melt, the fluorophore and quencher are separated and there is a large increase in fluorescence. These experiments were performed in a Roche LightCycler; this requires small amounts of material (typically 4 pmol oligonucleotide) and can perform 32 melting profiles in parallel. We have used this technique to compare the stability of triplexes containing different base analogues and to confirm the selectivity of a triplex-binding ligand for triplex, rather than duplex, DNA. We have also compared the melting of inter- and intramolecular quadruplexes.
INTRODUCTION
Melting studies are widely used for determining the stability of nucleic acids and their interaction with ligands (1–3). As the temperature of a solution containing a structured nucleic acid is raised then the strands will separate or melt. The temperature at the mid-point of this transition (Tm) indicates the stability of the structure, and changes in this value (ΔTm) are used to compare the effect of experimental conditions, base substitutions or drug binding. Melting transitions can be detected by a variety of techniques including UV absorbance, circular dichroism, calorimetry, NMR and electrophoresis, although UV absorbance is the most commonly used technique. This is usually achieved by measuring changes in absorbance at 260 nm. As the structured nucleic acid melts, the bases become unstacked and are exposed to solvent, thereby causing an increase in absorbance.
Although this technique is simple to use and the results are qualitatively easy to interpret, it suffers from a number of limitations. First, the absorbance changes are not large (typically only 25%) and the technique has low throughput, as most spectrophotometers measure no more than four samples at once. Second, it requires relatively large volumes (1–3 ml) of a solution with an OD260 of at least 0.2 (i.e. a total of ∼20 nmol bases). Third, higher order nucleic acid structures, such as triplexes (4,5) and quadruplexes (tetraplexes) (6,7), have several components in their melting profiles (e.g. triplex→duplex→single strands). These often overlap and it is not possible to resolve the different transitions. Fourth, the formation of some triplexes is not accompanied by changes in absorbance (8). The absorbance change on quadruplex formation is also small (9).
We have therefore devised a novel method for measuring DNA melting profiles which overcomes these limitations. This technique is based on molecular beacon methods (10) and measures changes in the fluorescence yield of oligonucleotides containing suitably placed fluorophores and quenchers. A number of previous studies have employed fluorescence resonance energy transfer, using oligonucleotides labelled with fluorescein at one end and rhodamine at the other, to assess triplex (11–15) and quadruplex (16,17) stability. Fluorescently labelled oligonucleotides have also been used to measure triplex formation using fluorescein-labelled oligo(dT) (18). Another approach has used molecular beacons to examine triplex formation by a hairpin third strand oligonucleotide containing fluorescein at one end and methyl red at the other (19). This hairpin opened when it bound to its target site, causing a large increase in fluorescence. The molecular beacon technique that we describe in this paper also uses oligonucleotides containing fluorescein and methyl red. These are attached to either deoxyribose or dU and can be incorporated within the oligonucleotide sequences as well as at either end. These modified bases were first prepared for use with Scorpion oligonucleotides in real-time PCR (20–22) and the preparation of these phosphoramidite monomers has recently been described (J.L.Brown, C.McKeen, J.M.Mellor, J.T.G.Nicol and T.Brown, submitted for publication). The fluorescence melting profiles are measured using a Roche LightCycler. In this way we are able to determine 32 melting profiles in parallel using 20 µl samples each containing 0.25 µM oligonucleotide.
MATERIALS AND METHODS
Oligonucleotides
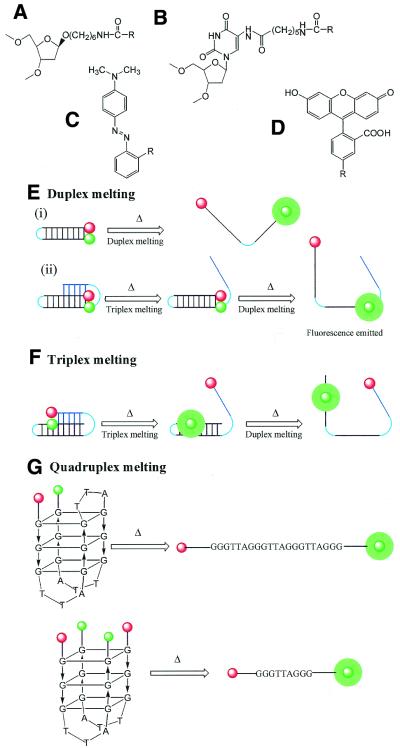
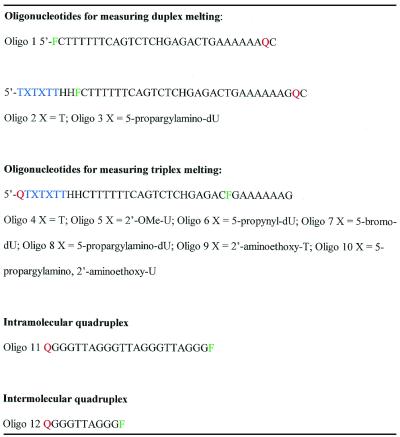
Oligonucleotides were synthesised on an Applied Biosystems 394 DNA/RNA synthesiser on either the 0.2 or 1.0 µM scale and were prepared and HPLC purified by Oswel Research Products Ltd (Southampton, UK). Phosphoramidite monomers were purchased from Cruachem Ltd (Glasgow, UK). 2′-Aminoethoxy-T (23,24) was obtained from Dr B. Cuenoud (Novartis). 5-Propargylamino-dU (25) and 2′-aminoethoxy, 5-propargylamino-U (26) were prepared as previously described. Methyl red (Fig. 1C) was incorporated at various positions in the oligonucleotides, using MeRed-dR (Fig. 1A). Fluorescein (Fig. 1D) was incorporated using either Fam-dR (Fig. 1A) or Fam-cap-dU (Fig. 1B). The synthesis of these phosphoramidites will be described elsewhere. The sequences of oligonucleotides used in these studies are shown in Table 1. The triplex-forming oligonucleotides were designed so that the third strand was shorter than the underlying duplex, as in our previous studies (25), to ensure that the two transitions occurred at different temperatures.
Figure 1.
(A) Chemical structure of FAM-dR (R = FAM) and MeRed-dR (R = MeRed). (B) Chemical structure of Fam-cap-dU (R = FAM). (C) Chemical structure of methyl red (MeRed). (D) Chemical structure of fluorescein (FAM). (E) Schematic representation of the melting of oligonucleotides designed to show duplex melting: (i) a simple DNA duplex; (ii) the underlying duplex of a triplex. (F) Schematic representation of the melting of oligonucleotides designed to show triplex melting. (G) Schematic representation of oligonucleotides designed to show the melting of intra- and intermolecular quadruplexes. The folded structures show one of the possible forms that these quadruplexes can adopt.
Table 1. Sequences of fluorescently labelled oligonucleotide used in this work.
In each case the quencher (Q) is MeRed-dR. The fluorophore (F) is FAM-dR, except for oligos 4–10, for which it is FAM-cap-dU. H represents a hexaethylene glycol linker connecting the strands. For oligos 2–10 the Hoogsteen strand is shown in blue.
Buffers and ligands
For intramolecular triplexes the following buffers were used: pH 5.0–6.0, 50 mM sodium acetate containing 100 mM NaCl and 0.1 mM EDTA; pH 7.0–8.0, 50 mM sodium phosphate containing 100 mM NaCl and 0.1 mM EDTA; pH 9.0, 50 mM sodium borate containing 100 mM NaCl and 0.1 mM EDTA. The buffer used for the experiments with quadruplexes was either 50 mM potassium phosphate pH 7.4 or 50 mM sodium phosphate pH 7.4. The naphthylquinoline triplex-binding ligand (27,28) was a gift from Dr L. Strekowski (Department of Chemistry, Georgia State University).
Fluorescence melting
Fluorescence melting curves were determined in a Roche LightCycler, using a total reaction volume of 20 µl. The melting profiles for up to 32 samples could be recorded simultaneously. For each reaction the final oligonucleotide concentration was 0.25 µM, diluted in an appropriate buffer. In a typical experiment the samples were first denatured by heating to 95°C at a rate of 0.1°C s–1. The samples were then maintained at 95°C for 5 min before annealing by cooling to 25°C at 0.1°C s–1 (this is the slowest heating and cooling rate for the LightCycler). They were held at 25°C for a further 5 min and then melted by heating to 95°C at 0.1°C s–1. Recordings were taken during both the melting steps as well as during annealing. The LightCycler has one excitation source (488 nm) and three channels for recording fluorescence emission at 520, 640 and 705 nm. For the studies in this work we measured the changes in fluorescence at 520 nm.
Data analysis
Tm values were determined from the first derivatives of the melting profiles using the Roche LightCycler software, or from van’t Hoff analysis of the melting profiles using FigP for Windows. The van’t Hoff analysis assumed a simple two-state equilibrium between the folded and unfolded forms. This is a unimolecular reaction for the intramolecular complexes, but is a bimolecular reaction for the intermolecular quadruplex. In several instances the triplex melting curves revealed a biphasic profile. These were fitted by assuming a coupled equilibrium in which the third strand dissociates first yielding a species with high fluorescence, followed by dissociation of the underlying duplex producing a random coil with a lower fluorescence. In some instances the melting curves showed a linear change in fluorescence with temperature in regions outside the melting transition. This was accounted for by first fitting a linear regression curve to the first and last 20 data points of the fluorescence curve. Each reaction was performed in triplicate and the Tm values usually differed by <0.5°C.
RESULTS
Although UV melting curves have been widely used for assessing DNA stability, the technique suffers from a number of limitations, as outlined in the Introduction. We have therefore devised a sensitive fluorescence-based method which allows us to observe these two transitions independently. The oligonucleotides used for this work are shown in Table 1 and each contains a fluorophore (F, fluorescein) and quencher (Q, methyl red) positioned so that they are in close proximity and the fluorescence is quenched when the oligonucleotide folds into an intramolecular structure. When the complex melts these two groups are separated and there is a large increase in fluorescence, as illustrated diagrammatically in Figure 1E–G. Previous studies have used end-labelled oligonucleotides to examine the stabilisation of DNA quadruplexes. The technique described in this paper requires much lower quantities of material and achieves a high throughput. In addition, by attaching the fluorophore and quencher to the DNA bases, we are able to measure the stability of DNA triplexes.
DNA triplexes
In oligos 4–10 the fluorophore and quencher are in the duplex purine strand and the third strand, respectively; the fluorescence melting curves will therefore represent dissociation of the third strand, as illustrated in Figure 1F. Subsequent melting of the underlying duplexes was not expected to affect the fluorescence signal. In contrast, oligos 2 and 3 form similar intramolecular triplexes, but the fluorophore and quencher are positioned on either strand of the duplex. In this instance dissociation of the third strand will not affect the fluorescence signal and the changes will represent melting of the duplex, as illustrated in Figure 1E(ii). Oligo 1 is an intramolecular duplex corresponding to the underlying duplex in the other triplexes and its dissociation is illustrated in Figure 1E(i).
Comparison of triplex and duplex melting profiles
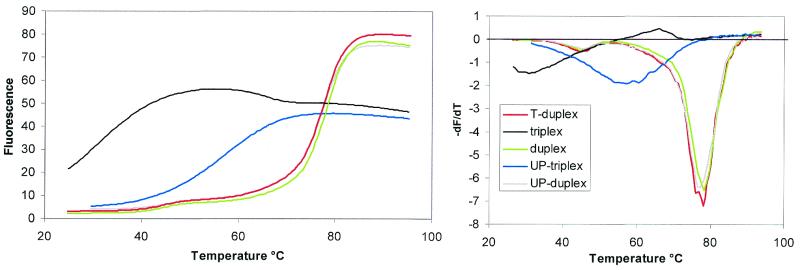
Figure 2 shows the representative fluorescence melting curves for the triplexes and duplexes formed by oligos 1–4 and 8. These experiments were performed at pH 7.0 in buffer containing 50 mM sodium phosphate, 100 mM NaCl, 0.1 mM EDTA. It can be seen that oligo 4, with the fluorophore and quencher on the duplex and third strand, produces a temperature-dependent increase in fluorescence (black curve). This broad transition has a Tm of ∼31°C, typical of that expected for an intramolecular triplex→duplex transition under these conditions. Since the triplex Tm is 31°C the oligonucleotide is not fully folded at the starting temperature (25°C). However, the LightCycler cannot cool the samples below ambient temperature. Surprisingly, we found that this transition was followed by a small decrease in fluorescence. We postulate that this is related to melting of the underlying duplex and this is considered further in the Discussion.
Figure 2.
Fluorescence melting profiles for oligos 1 (duplex, green), 2 (T-duplex, red), 3 (UP-containing duplex, grey), 4 (triplex, black) and 8 (UP-containing triplex blue). The left panel shows plots of fluorescence against temperature (°C), while the right panel shows the first derivative of the melting profile. The fluorescence is expressed in arbitrary units.
When the fluorophore and quencher are placed within the duplex portion of the same triplex (oligo 2) the melting transition is at a higher temperature (77.7°C), corresponding to the duplex–single strand transition. This was confirmed using a labelled oligonucleotide corresponding to the intramolecular duplex alone (oligo 1), which produced an identical melting profile (Tm = 77.0°C). As expected, the presence of the third strand did not affect the stability of the underlying duplex. These Tm values are summarised in Table 2, along with those for oligonucleotides containing base modifications, which are described below.
Table 2. Melting temperature (°C) for intramolcular triplexes containing different base modifications.
| Oligo | X | Tm (°C) | ||||
|---|---|---|---|---|---|---|
| pH 5.0 | pH 6.0 | pH 7.0 | pH 8.0 | pH 9.0 | ||
| Duplexes | ||||||
| 1 | Duplex | 74.6 | 75.9 | 76.9 | 77.0 | |
| 2 | T | 73.1 | 77.4 | 77.7 | 77.7 | 73.7 |
| 3 | 5-Propargylamino-dU | 74.4 | 76.5 | 76.6 | 76.6 | 73.0 |
| Triplexes | ||||||
| 4 | T | 36.0a | 31.4a | 31.2a | 31.2a | 30.5a |
| 5 | 2′-OMe | 27.2a | 28.7a | 27.8a | 28.7a | 27.8a |
| 6 | 5-Propynyl-dU | 36.5a | 36.5a | 32.0a | 31.6a | 28.3a |
| 7 | 5-Bromo-dU | 45.9a | 42.1a | 41.0a | 39.1a | 31.0a |
| 8 | 5-Propargylamino-dU | 58.2 | 57.9 | 58.8 | 54.1 | 36.0a |
| 9 | 2′-Aminoethoxy-T | 50.8a | 45.1a | 43.6a | 41.6a | 33.4a |
| 10 | 5-Propargylamino, 2′-aminoethoxy-dU | 72.5 | 72.4 | 71.2 | 67.6 | 50.8 |
The sequences of the oligonucleotides are shown in Table 1. For duplex melts the fluorophore and quencher are positioned on the pyrimidine and purine strands of the Watson–Crick duplex, respectively. For the triplexes the fluorophore is located on the purine strand of the duplex, while the quencher is on the Hoogsteen strand.
aThese curves showed two transitions, as described in the text. In these cases the Tm value shown is that of the first transition.
Base modifications
We have used similar experiments to assess the melting of various intramolecular triplexes that have been substituted with base analogues at two positions in the third strand. Figure 2 (blue curve) shows the melting profile for the oligonucleotide containing 5-propargylamino-dU (UP), a base analogue which we have previously shown produces a large increase in triplex stability (25). This again shows a temperature-dependent increase in fluorescence, which occurs at a higher temperature than for the unmodified triplex (Tm = 58.8°C). In this instance the transition was not followed by a subsequent decrease in fluorescence. When this UP-containing triplex was labelled on the underlying duplex (oligo 3) the melting curve was identical to that of both the duplex alone and the duplex portion of the unmodified triplex (Tm = 76.6°C). Similar experiments were also performed with intramolecular triplexes containing a selection of third strand substitutions and the results are summarised in Table 2.
These results demonstrate that oligonucleotides containing appropriately positioned fluorophores and quenchers can be used in the LightCycler to generate accurate DNA melting profiles. In contrast to UV melting curves, which typically show only a 25% increase in absorbance at 260 nm and require relatively large amounts of oligonucleotide (1 ml of OD 0.2), this method uses only 20 µl of a 0.25 µM solution of oligonucleotide and shows a 10-fold increase in fluorescence. By altering the location of the fluorophore and quencher the method allows separate determination of the triplex–duplex and duplex–single strand transitions.
Effect of pH
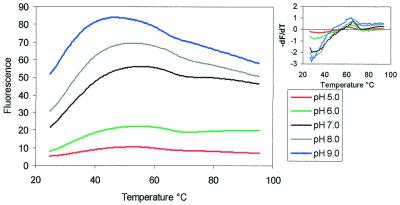
The fluorescence yield of fluorescein is pH dependent and is lower at acidic pH when the molecule is unionised. We have therefore performed similar experiments with the unmodified triplex (oligo 4) at a range of different pH values and the results are shown in Figure 3. As expected, the fluorescence yield was significantly lower at pH 6.0 and below, but was still sufficient to allow accurate determination of the melting temperatures. The melting profiles were similar to those determined at pH 7.0 and revealed very similar melting temperatures, which are summarised in Table 2, along with those for triplex base substitutions.
Figure 3.
Effect of pH on the fluorescence melting profiles for triplex-forming oligo 4. pH 5.0 (red), pH 6.0 (green), pH 7.0 (black), pH 8.0 (grey) and pH 9.0 (blue). The left panel shows plots of fluorescence against temperature (°C), while the right panel shows the first derivative of the melting profile. The fluorescence is expressed in arbitrary units.
Rate of heating
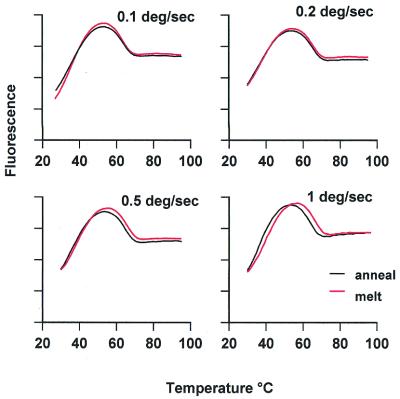
The kinetics of intermolecular DNA triplex formation are known to be very slow and are about three orders of magnitude slower than that of duplex DNA. Melting and annealing profiles can therefore show considerable hysteresis, as the reaction is not at thermodynamic equilibrium during the heating process (29). We are not aware of any data on the kinetics of intramolecular triplex formation, although we would expect this to be much faster. The slowest rate of temperature change on the LightCycler is 0.1°C s–1; this is much faster than that usually employed to determine UV melting profiles, which is typically 0.5–1°C min–1. Figure 4 compares the annealing and melting profiles for the intramolecular triplex formed by oligo 4, and the thermodynamic parameters obtained from these transitions are summarised in Table 3. It can be seen that, at this slowest rate of temperature change, the melting and annealing curves are very similar, suggesting that the reaction is at thermodynamic equilibrium. Although we could not examine slower rates of heating, due to the limitations of the instrument, we compared faster rates and the results are shown in Figure 4 and Table 3. At 0.2°C s–1 the annealing and melting profiles are also very similar. Although these transitions are at slightly higher temperatures than determined with the slower rate of heating, this small change was due to experimental variation; it is more significant that the heating and cooling curves do not show any hysteresis. Further increases in the rate of heating to 0.5 and 1°C s–1 are also shown in Figure 4 and Table 3. It can be seen that these faster rates generate melting and annealing profiles that show some hysteresis, in which the annealing occurs at a lower temperature than the melting. The annealing temperature was constant for all the curves while the apparent melting temperature moved to higher temperatures at the faster rates of heating.
Figure 4.
Fluorescence melting profiles for oligo 4, determined at different rates of heating and cooling. The red curves correspond to melting, while black curves show annealing. The fluorescence is expressed in arbitrary units.
Table 3. Effect of heating and cooling rates on the fluorescence melting curves obtained with the intramolecular triplex formed by oligo 4.
| Rate of heating (°C s–1) | Transition 1 | Transition 2 | |||
|---|---|---|---|---|---|
| Tm (°C) | ΔH (kJ mol–1) | Tm (°C) | ΔH (kJ mol–1) | ||
| 0.1 | Melt | 36.0 | 157 | 62.0 | 360 |
| Anneal | 36.0 | 149 | 62.1 | 338 | |
| 0.2 | Melt | 37.9 | 170 | 63.8 | 378 |
| Anneal | 37.4 | 167 | 63.7 | 355 | |
| 0.5 | Melt | 38.8 | 169 | 64.3 | 372 |
| Anneal | 36.6 | 163 | 63.3 | 380 | |
| 1.0 | Melt | 39.8 | 168 | 64.9 | 413 |
| Anneal | 36.7 | 176 | 62.3 | 419 | |
Effect of a triplex-binding ligand
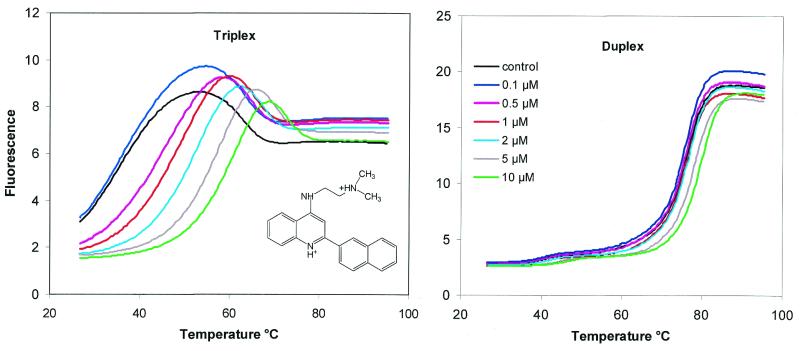
Several studies have examined the interaction of naphthylquinoline with DNA (27,28) and shown that this ligand stabilises DNA triplexes much more effectively than duplexes. We have examined the effect of this ligand on the fluorescence melting transitions of the intramolecular triplexes and duplexes generated by oligos 4 and 1. The results are presented in Figure 5 and Table 4. As expected, the ligand had very little effect on the melting profile of the intramolecular duplex (Fig. 5, right) and produced a ΔTm of only 2 and 4°C in the presence of 5 and 10 µM ligand, respectively. In contrast, the ligand had a dramatic effect on the first melting transition of the intramolecular triplex (Fig. 5, left), which was increased by 23.4 and 27.7°C in the presence of 5 and 10 µM ligand, respectively. The second transition was also affected by the ligand, although by a much smaller amount, with a ΔTm of only 8°C in the presence of the highest ligand concentration. These data confirm the specificity of naphthylquinoline for triplex DNA and demonstrate that this fluorescence melting technique can be used to assess the effect of DNA-binding ligands.
Figure 5.
The effect of the naphthylquinoline triplex-binding ligand (chemical structure shown in left panel) on the fluorescence melting curves for oligo 1 (right panel) and oligo 4 (left panel). The ligand concentration for each curve is shown in the inset. The fluorescence is expressed in arbitrary units.
Table 4. Effect of naphthylquinoline on the fluorescent melting curves of intramolecular DNA triplexes and duplexes.
| Naphthylquinoline (µM) | Triplex | Duplex | ||||
|---|---|---|---|---|---|---|
| Transition 1 | Transition 2 | |||||
| Tm (°C) | ΔH (kJ mol–1) | Tm (°C) | ΔH (kJ mol–1) | Tm (°C) | ΔH (kJ mol–1) | |
| Control | 35.8 | 154 | 61.6 | 374 | 75.4 | 352 |
| 0.1 | 36.8 | 139 | 61.9 | 415 | 75.1 | 353 |
| 0.5 | 45.4 | 126 | 62.6 | 413 | 75.3 | 356 |
| 1 | 48.8 | 139 | 63.7 | 430 | 75.4 | 360 |
| 2 | 53.0 | 149 | 65.0 | 429 | 75.9 | 364 |
| 5 | 59.4 | 149 | 67.3 | 394 | 77.4 | 387 |
| 10 | 63.5 | 149 | 69.5 | 396 | 79.3 | 432 |
The Tm and ΔH values were obtained from van’t Hoff analysis of the melting curves. For the intramolecular triplex the first transition corresponds to the triplex→duplex melt.
Quadruplexes
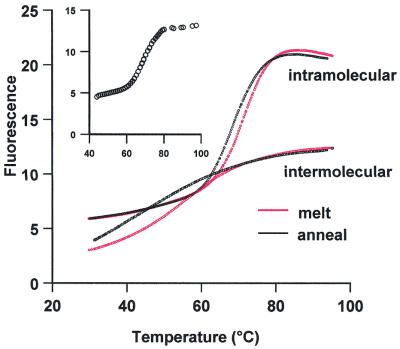
We have also used this technique to determine the stability of both intra- and intermolecular DNA quadruplexes, using oligos 11 and 12, and the results are presented in Figure 6 and Table 5. These experiments were performed in 50 mM potassium phosphate buffer pH 7.4. Although quadruplexes are extremely stable, they are known to form very slowly. We therefore compared the annealing and melting curves for these oligonucleotides. Although both oligonucleotides produced clear melting profiles the transition was much sharper for the intramolecular complex and the Tm was ∼10°C higher. For the intermolecular complex the melting and annealing curves are a similar shape, although there is some hysteresis and the Tm for annealing is ∼2°C lower than that determined from the melting curve. The hysteresis is especially pronounced for the intermolecular complex, with a large difference in the melting and annealing curves. The annealing curve was especially shallow and it was difficult to determine an accurate Tm. These results confirm that these quadruplexes form extremely slowly. The lower stability of the intermolecular complex is expected, as it is a bimolecular reaction. Other experiments (not shown) revealed that the Tm of the intermolecular complex increased with oligonucleotide concentration, as expected for a bimolecular reaction, whereas the Tm of the intramolecular complex was independent of concentration.
Figure 6.
Fluorescence melting curves for the intramolecular quadruplex formed by oligo 11 and the intermolecular quadruplex formed by oligo 12. Annealing curves are shown in black, while melting curves are shown in red. The insert shows the annealing curve obtained when the complex was left to equilibrate for 10 min after each 1°C decrease in temperature, before recording the fluorescence. The fluorescence is expressed in arbitrary units.
Table 5. Thermodynamic parameters obtained for the fluorescence melting curves for intramolecular (oligo 11) and intermolecular (oligo 12) quadruplexes, measured in 50 mM potassium phosphate pH 7.4.
| Tm (°C) | ΔH (kJ mol–1) | |
|---|---|---|
| Intramolecular melt | 71.4 | 252 |
| Intramolecular anneal | 69.2 | 253 |
| Intramolecular slow anneal | 69.0 | 231 |
| Intermolecular melt | 61.2 | 135 |
| Intermolecular anneal | 46.0 | 61.2 |
The Tm and ΔH values were obtained from van’t Hoff analysis of the melting profiles using both the annealing and melting curves. The data for the slow anneal were obtained by increasing the temperature in 1°C steps and leaving the mixture to equilibrate for 1 min before recording the fluorescence.
Although the Roche LightCycler cannot heat at <0.1°C s–1, this limitation can be overcome by programming the machine to increase the temperature in small steps, taking the fluorescence at each temperature after a set equilibration time. We have used this technique to measure annealing of the intramolecular quadruplex, by decreasing the temperature in 1°C steps, leaving 10 min between readings. This annealing curve is shown in the inset to Figure 6 and yields a Tm of 69.0°C and ΔH of 231 kJ mol–1 (Table 5).
DISCUSSION
The results presented in this paper demonstrate that molecular beacons can be used to generate accurate DNA melting and annealing curves, using a Roche LightCycler. By attaching the fluorophore and quencher to deoxyribose or dU these residues can be incorporated within the oligonucleotide sequences and can be employed to determine the stability of a range of different structures.
Rate of heating
We were at first concerned that the slowest rate of temperature change in the LightCycler might be too fast to determine accurate melting curves. UV melting curves are typically performed at a heating rate of 1°C min–1, compared with 0.1°C s–1 (or faster) used in these experiments. The rate of heating is a problem for slow reactions in which re-equilibration does not keep pace with the change in temperature, and this has previously been shown to produce different heating and annealing profiles for intermolecular triplexes (29). We showed that this is not a problem for intramolecular triplexes, although some hysteresis is apparent at faster rates of heating and cooling. The rate of heating is a greater problem for the experiments with quadruplex DNA. There is some hysteresis between the heating and cooling curves for the intramolecular quadruplex and a large (15°C) difference for the intermolecular complex. However, these problems can be overcome by increasing the temperature in small steps, leaving the reaction to equilibrate between each change before recording the fluorescence. Although the smallest step size for the Roche LightCycler is 1°C, we have shown that this can be used to produce accurate melting data.
Triplex stability
We have demonstrated the use of this technique by comparing the stability of triplexes that contain different base modifications at two (out of six) positions in the third strand. Although each of these modifications has been tested in independent studies (23–26,30–34), this is the first time in which they have all been compared together. It can be seen that the 2′-O-methyl substitution decreases triplex stability. This contrasts with previous reports, which show that oligoribonucleotides generate more stable triplexes than their deoxy counterparts (30,31) and that the stability is further increased by the 2′-O-methyl substitution (31). However, these previous studies used fully substituted oligonucleotides and it is possible that partial substitution destabilises the structure. Similarly, the 5-propynyl substitution would be expected to increase stability, as previously reported (32,33). The lack of observed stabilisation is most probably because, in these oligonucleotides, the propynyl-dU residues are not adjacent. The stabilisation by 5-bromo-dU is consistent with earlier reports that triplex stability increases in the order U < T < BrU (34). The melting data confirm the effect of amino substitutions on triplex stability (23–25) and demonstrate the potency of the doubly modified analogue 2′-aminoethoxy, UP (26). Detailed studies with this analogue will be reported elsewhere.
The technique also allows us to independently study the stability of the underlying duplex, by selectively labelling the two duplex strands. The results demonstrate that addition of the third strand does not affect the stability of the underlying duplex.
Triplex melting profiles
The second transition (a decrease in fluorescence) in the triplex melting profiles was unexpected. This is observed for the less stable triplexes but is not present with the triplexes containing propargylamino-dU or the doubly modified analogue 2′-aminoethoxy, UP. We presume that this second transition is a property of the underlying duplex, since the average distance between the fluorophore and quencher will be greater for the partially melted triplex than for the fully melted random coil. When the third strand dissociates, the remaining duplex will be relatively rigid and hold the fluorophore and quencher apart. One problem with this explanation is that the second transition occurs at a lower temperature than the duplex Tm measured with oligos 1–3. However, this difference may be explained by the location of the fluorescein substitution on the different oligonucleotides. For the oligonucleotides designed to measure the duplex melt (oligos 1–3) this is attached to deoxyribose, at the 5′-end of the duplex portion. In contrast, it is attached as Fam-cap-dU within the underlying duplex for the triplex oligos 4–10. The internal Fam residue may cause some destabilisation of the underlying duplex. Indeed, we have shown that moving the fluorophore away from the pyrimidine ring by including a propargyl group before the caproyl linker produces more stable DNA duplexes (unpublished observations). Although this internal residue affects the stability of the underlying duplex, it should not cause a problem for binding the third strand, as it is located 2 bp beyond the end of the Hoogsteen strand. It is not clear why this second transition is more sensitive to addition of the triplex-binding ligand than the intramolecular duplex alone (ΔTm of 8°C compared with 4°C).
The experiments with the naphthylquinoline compound demonstrate that this technique can be used to assess the effects of triplex-binding ligands. In other studies we have shown that it can also be used to study the effects of ligands on quadruplex stability. In the present study the ligand does not affect the fluorescence signal, although we are aware that some compounds may directly interact with the fluorophore and quench the fluorescence. In such instances it may therefore be necessary to confirm the binding reaction with unmodified oligonucleotides using conventional techniques. However, if the ligand quenches the fluorescence by binding to the folded complex, then the change in signal can be used to monitor its dissociation.
Acknowledgments
ACKNOWLEDGEMENTS
This work was supported by grants from Cancer Research UK and the European Union. C.B. was supported by a Nuffield undergraduate research bursary. The Roche LightCycler was partly funded by the BBSRC (JREI).
REFERENCES
- 1.Wilson W.D., Tanious,F.A., Fernandez-Siaz,M. and Rigi,T. (1997) Evaluation of drug-nucleic acid interactions by thermal melting curves. Methods Mol. Biol., 90, 219–240. [DOI] [PubMed] [Google Scholar]
- 2.SantaLucia J. (2000) The use of spectroscopic techniques in the study of DNA stability. In Gore,M.G. (ed.), Spectrophotometry and Spectrofluorimetry. Oxford University Press, Oxford, UK, pp. 329–356.
- 3.Benight A.S., Pancoska,P., Owczarzy,R., Vallone,P.M., Nesetril,J. and Riccelli,P.V. (2001) Calculating sequence-dependent melting stability of duplex DNA oligomers and multiplex sequence analysis by graphs. Methods Enzymol., 340, 165–192. [DOI] [PubMed] [Google Scholar]
- 4.Soyfer V.N. and Potoman,V.N. (1996) Triple-helical Nucleic Acids. Springer-Verlag, New York, NY.
- 5.Fox K.R. (2000) Targeting DNA with triplexes. Curr. Med. Chem., 7, 17–37. [DOI] [PubMed] [Google Scholar]
- 6.Keniry M.A. (2000) Quadruplex structures in nucleic acids. Biopolymers , 56, 123–146. [DOI] [PubMed] [Google Scholar]
- 7.Lane A.N. and Jenkins,T.C. (2001) Structures and properties of multi-stranded nucleic acids. Curr. Org. Chem., 5, 845–869. [Google Scholar]
- 8.Jetter M.C. and Hobbs,F.W. (1993) 7,8-Dihydro-8-adenine as a replacement for cytosine in the third strand of triple helices. Triplex formation without hypochromicity. Biochemistry, 32, 3249–3253. [DOI] [PubMed] [Google Scholar]
- 9.Mergny J.L., Phan,A.-T. and Lacroix,L. (1998) Following G-quartet formation by UV-spectroscopy. FEBS Lett., 435, 74–78. [DOI] [PubMed] [Google Scholar]
- 10.Tyagi S. and Kramer,F.R. (1996) Molecular beacons: probes that fluoresce upon hybridization. Nat. Biotechnol., 14, 303–308. [DOI] [PubMed] [Google Scholar]
- 11.Yang M.S., Ghosh,S.S. and Millar,D.P. (1994) Direct measurement of thermodynamic and kinetic-parameters of DNA triple-helix formation by fluorescence spectroscopy. Biochemistry, 33, 15329–15337. [DOI] [PubMed] [Google Scholar]
- 12.Aich P., Ritchie,S., Bonham,K. and Lee,J.S. (1998) Thermodynamic and kinetic studies of the formation of triple helices between purine-rich deoxyribo-oligonucleotides and the promoter region of the human c-src proto-oncogene. Nucleic Acids Res., 26, 4173–4177. [DOI] [PMC free article] [PubMed] [Google Scholar]
- 13.Mergny J.L., Garestier,T., Rougée,M., Lebedev,A.V., Chassignol,M., Thuoung,N.T. and Hélène,C. (1994) Fluorescence energy-transfer between 2 triple helix-forming oligonucleotides bound to duplex DNA. Biochemistry, 33, 15321–15328. [DOI] [PubMed] [Google Scholar]
- 14.Scaria P.V., Will,S., Levenson,C. and Shafer,R.H. (1995) Physicochemical studies of the d(G3T4G3)*d(G3A4G3)·d(C3T4C3) triple-helix. J. Biol. Chem., 270, 7295–7303. [DOI] [PubMed] [Google Scholar]
- 15.Yang M.S., Ren,L.Q., Huang,M.H., Kong,R.Y.C. and Fong,W.F. (1998) A DNA assay based on fluorescence resonance energy transfer and DNA triplex formation. Anal. Biochem., 259, 272–274. [DOI] [PubMed] [Google Scholar]
- 16.Mergny J.L., Lacroix,L., Teulande-Fochou,M.-P., Hounsou,C., Guittat,L., Hoarau,M., Arimondo,P.B. Vigneron,J.-P. Lehn,J.-M., Riou,J.-P., Garestier,T. and Hélène,C. (2001) Telomerase inhibitors based on quadruplex ligands selected by a fluorescence assay. Proc. Natl Acad. Sci. USA, 98, 3062–3067. [DOI] [PMC free article] [PubMed] [Google Scholar]
- 17.Mergny J.-L. and Maurizot,J.-C. (2001) Fluorescent resonance energy transfer as a probe for G-quartet formation by a telomeric repeat. ChemBioChem., 2, 124–132. [DOI] [PubMed] [Google Scholar]
- 18.Ellouze C., Piot,F. and Takahashi,M. (1997) Use of fluorescein-labeled oligonucleotide for analysis of formation and dissociation kinetics of T:A:T triple-stranded DNA: effect of divalent cations. J. Biochem., 121, 521–526. [DOI] [PubMed] [Google Scholar]
- 19.Antony T., Thomas,T., Sigal,L.H., Shirahata,A. and Thomas,T.J. (2001) A molecular beacon strategy for the thermodynamic characterization of triplex DNA: triplex formation at the promoter regions of cyclin D1. Biochemistry, 40, 9387–9395. [DOI] [PubMed] [Google Scholar]
- 20.Whitcombe D., Theaker,J., Guy,S.P., Brown,T. and Little,S. (1999) Detection of PCR products using self-probing amplicons and fluorescence. Nat. Biotechnol., 17, 804–807. [DOI] [PubMed] [Google Scholar]
- 21.Thelwell N., Millington,S., Solinas,A., Booth,J. and Brown,T. (2000) Mode of action and application of Scorpion primers to mutation detection. Nucleic Acids Res., 28, 3752–3761. [DOI] [PMC free article] [PubMed] [Google Scholar]
- 22.Solinas A., Brown,L.J., McKeen,C., Mellor,J.M., Nicoll,J.T.G., Thelwell,N. and Brown,T. (2001) Duplex Scorpion primers in SNP analysis and FRET applications. Nucleic Acids Res., 29, e96. [DOI] [PMC free article] [PubMed] [Google Scholar]
- 23.Cuenoud B., Casset,F., Hüsken,D., Natt,F., Wolf,R.M., Altmann,K.-H., Martin,P. and Moser,H.E. (1998) Dual recognition of double-stranded DNA by 2′-aminoethoxy-modified oligonucleotides. Angew. Chem. Int. Ed., 37, 1288–1291. [DOI] [PubMed] [Google Scholar]
- 24.Blommers M.J.J., Natt,F., Jahnke,W. and Cuenoud,B. (1998) Dual recognition of double-stranded DNA by 2′-aminoethoxy-modified oligonucleotides: the solution structure of an intramolecular triplex obtained by NMR spectroscopy. Biochemistry, 37, 17714–17725. [DOI] [PubMed] [Google Scholar]
- 25.Bijapur J., Keppler,M.D., Bergqvist,S., Brown,T. and Fox,K.R. (1999) 5-(1-Propargylamino)-2′-deoxyuridine (UP): a novel thymdine analogue for generating DNA triplexes with increased stability. Nucleic Acids Res., 27, 1802–1809. [DOI] [PMC free article] [PubMed] [Google Scholar]
- 26.Sollogoub M., Dominguez,B., Fox,K.R. and Brown,T. (2000) Synthesis of a novel bis-amino-modified thymidine monomer for use in DNA triplex stabilisation. Chem. Commun., 2000, 2315–2316. [Google Scholar]
- 27.Wilson W.D., Tanious,F.A., Mizan,S., Yao,S., Kiselyov,A.S., Zon,G. and Strekowski,L. (1993) DNA triple-helix specific intercalators as antigene enhancers. Biochemistry, 32, 10614–10621. [DOI] [PubMed] [Google Scholar]
- 28.Chandler S.P., Strekowski,L., Wilson,W.D. and Fox,K.R. (1995) Footprinting studies on ligands which stabilise DNA triplexes. Biochemistry, 34, 7234–7242. [DOI] [PubMed] [Google Scholar]
- 29.Rougée M., Faucon,B., Mergny,J.L., Barcelo,F., Giovannangeli,C., Garestier,T. and Hélène,C. (1992) Kinetics and thermodynamics of triple-helix formation: effects of ionic strength and mismatches. Biochemistry, 31, 9269–9278. [DOI] [PubMed] [Google Scholar]
- 30.Escudé C., François,J.-C., Sun,J.S., Ott,G., Sprinzi,M., Garestier,T. and Hélène,C. (1993) Stability of triple helices containing RNA and DNA strands: experimental and molecular modeling studies. Nucleic Acids Res., 21, 5547–5553. [DOI] [PMC free article] [PubMed] [Google Scholar]
- 31.Escudé C., Sun,J.-S., Rougeée,M., Garestier,T. and Hélène,C. (1992) Stable triple helices are formed upon binding of RNA oligonucleotides and their 2′-O-methyl derivatives to double-helical DNA. C. R. Acad. Sci. III, 315, 521–525. [PubMed] [Google Scholar]
- 32.Froehler B.C., Waswani,S., Terhorst,T.J. and Gerrard,S.R. (1992) Oligonucleotides containing C-5 propyne analogs of 2′-deoxyuridine and 2′-deoxycytidine. Tetrahedron Lett., 37, 5307–5310. [Google Scholar]
- 33.Lacroix L., Lacoste,J., Reddoch,J.F., Mergny,J.-L., Levy,D.D., Seidman,M.M., Matteucci,M.D. and Glazer,P.M. (1999) Triplex formation by oligonucleotides containing 5-(1-propynyl)-2′-deoxyuridine: decreased magnesium dependence and improved intracellular gene targeting. Biochemistry, 38, 1893–1901. [DOI] [PubMed] [Google Scholar]
- 34.Povsic T.J. and Dervan,P.B. (1989) Triple helix formation by oligonucleotides on DNA extended to the physiological pH range. J. Am. Chem. Soc., 114, 3059–3061. [Google Scholar]


