Abstract
To examine the utility and performance of 50mer oligonucleotide (oligonucleotide probe) microarrays, gene-specific oligonucleotide probes were spotted along with PCR probes onto glass microarrays and the performance of each probe type was evaluated. The specificity of oligonucleotide probes was studied using target RNAs that shared various degrees of sequence similarity. Sensitivity was defined as the ability to detect a 3-fold change in mRNA. No significant difference in sensitivity between oligonucleotide probes and PCR probes was observed and both had a minimum reproducible detection limit of ∼10 mRNA copies/cell. Specificity studies showed that for a given oligonucleotide probe any ‘non-target’ transcripts (cDNAs) >75% similar over the 50 base target may show cross-hybridization. Thus non-target sequences which have >75–80% sequence similarity with target sequences (within the oligonucleotide probe 50 base target region) will contribute to the overall signal intensity. In addition, if the 50 base target region is marginally similar, it must not include a stretch of complementary sequence >15 contiguous bases. Therefore, knowledge about the target sequence, as well as its similarity to other mRNAs in the target tissue or RNA sample, is required to design successful oligonucleotide probes for quality microarray results. Together these results validate the utility of oligonucleotide probe (50mer) glass microarrays.
INTRODUCTION
DNA microarrays have gained wide use in biological research yet many technical aspects required to generate consistent, high quality data (e.g. mRNA profiling) remain under development. Benchmarking this technology is inherently difficult given that the genome and transcriptome is incomplete in many model systems. Additionally, many difficulties lie in correlating changes in protein expression with changes in mRNA expression even when the complete genome is known (1). Yet the generation of high quality microarray data offers the potential for new insights and an understanding of gene regulation and has applications in virtually all aspects of biological research (2). Certainly microarray technology will be pivotal in the advancement of disease research and diagnosis, as well as the identification of therapeutic targets for pharmaceutical development and gene therapy (3,4).
The production of DNA microarrays involves many variables and often represents a significant resource burden. Typically, fabrication of DNA microarrays involves linking PCR products to a solid substrate and therefore requires the amplification and purification of thousands of PCR probes [note that the terminology used in this manuscript describes the DNA attached (spotted) to the microarray surface as the ‘probe’ and the fluorescent (Cy-dye) cDNA which hybridizes to the array as the ‘target’]. The use of smaller length probes (i.e. synthesized oligonucleotides) is a convenient method of microarray production and has advantages in that oligonucleotide probes can be designed to detect multiple variant regions of a transcript (i.e. splice variants). For example, the Affymetrix GeneChip™ system (Affymetrix, Santa Clara, CA) utilizes 25mer oligonucleotide sequences that are synthesized directly on the surface of the array as well as ‘mismatched’ sequences designed to ensure gene specificity (5). With the appropriate microarray attachment chemistries (i.e. spotting chemistry) a similar approach can be used to attach synthesized oligonucleotides to a glass microarray surface to construct a large scale array for analyzing changes in mRNA expression level (6,7). The experiments presented here demonstrate the performance of DNA microarrays using in vitro transcribed bacterial mRNAs added (‘spiked’) into rat liver RNA at different mRNA levels (1–30 000 copies/cell). The results show no significant difference in the sensitivity of 50mer oligonucleotide probes as compared to PCR probes 322–393 bases in length. Additionally, bacterial transcripts of varying sequence similarity were employed to define the specificity of gene-specific oligonucleotide probes. The results showed that specificity of the oligonucleotide probe microarray requires non-target genes to be <75% similar over the 50 base target region. In addition, if the 50 base target region is marginally similar (50–75%) it must not include a stretch of complementary sequence >15 contiguous bases. Therefore, knowledge about the target sequence, as well as its sequence similarity to other transcripts in the target tissue or sample, is required to successfully design oligonucleotide probes and exploit this microarray production strategy.
MATERIALS AND METHODS
Microarray production
Two oligonucleotide probes (50mers) were designed for each target gene and synthesized by Operon Techologies (Alameda, CA) with a 5′ amino linker modification. The amino linker modification permitted the covalent attachment of oligonucleotide probes to Surmodics (Eden Prairie, MN) 3D-Link activated slides using the Molecular Dynamics (Sunnyvale, CA) Generation III microarray spotter. Oligonucleotide probes were solubilized at 20 µM in 150 mM sodium phosphate buffer (Na2HPO4, pH 8.5), spotted in duplicate on each array and processed for hybridization using the suggested Surmodics protocols. The preparation of PCR probes for microarray detection involved the use of a sense strand primer that contained a 5′ amino linker (as above). PCR probes 322–393 bases in length were prepared using standard methods, purified using the Life Technologies (Rockville, MD) Concert PCR purification kit and solubilized at 0.1 µg/µl in 150 mM phosphate buffer for spotting onto Surmodics 3D-Link slides (as above). Microarrays that included PCR probes were immersed in boiling deionized water for 2 min to denature the double-stranded PCR products as suggested by the Surmodics protocol. Hybridization-ready microarrays were stored desiccated at room temperature.
Preparation of RNA transcripts
Plasmid vectors were purchased from ATCC (Rockville, MD) and encode the dap (ATCC no. 87486), thr (ATCC no. 87484), trp (ATCC no. 87485), phe (ATCC no. 87483) and lys (ATCC no. 87482) genes from the bacterium Bacillus subtilis. Each vector consists of the appropriate bacterial cDNA cloned into the XhoI (5′) and BamHI (3′) sites of a modified pBluescript II-KS+ vector in which a poly(dA) stretch follows the BamHI (3′) restriction site. Sense RNA transcripts containing a 3′ poly(A) tract were generated using the Ambion (Austin, TX) MegaScript T3 in vitro transcription kit from template DNA linearized with NotI. Predicted transcript size was confirmed using MOPS agarose gel electrophoresis. The vector pΔdap was constructed by removing a 239 bp fragment from the parent vector pdap with EcoRI. The resulting plasmid encodes an RNA containing a deletion spanning positions 2489–2728 in the dap GenBank sequence (the full-length dap cDNA fragment includes transcript positions 1358–3197 from GenBank accession no. L38424). DNA corresponding to each of the Escherichia coli set genes [setA (yabM), setB (yeiO) and setC (yicK)] were obtained by PCR. The 5′ primers contained the common sequence GCGCGGAGCTCGAGGTTTACAT followed by 25 bases, starting at the ATG, of perfectly matching sequence to the gene as reported in the EMBL/GenBank database. This sequence contains a SacI restriction site and a ribosome binding site. The 3′ primers contained 25 bases of matching sequence to the gene followed by a HindIII site after the translational stop codon. The PCR products for setA, setB and setC were cloned into the SacI and HindIII sites of pBluescript-KS(+).
Microarray sample preparation
Samples were prepared from total rat liver RNA spiked with varying concentrations of the prokaryotic genes dap, thr and trp at 1–30 000 copies/cell. The prokaryotic gene lys was spiked into all samples at 500 copies/cell and used for Cy-dye channel normalization. Fluorescent first strand cDNA was prepared by random primed reverse transcription (Superscript II; Life Technologies) for microarray analysis. Random priming utilized random nonamers that were 5′-labeled with Cy-dyes (5′-Cy-NNNNNNNVV-3′, N = G, C, A or T, V = G, C or A) and solubilized to 100 µM in water. For cDNA synthesis 1.5 µl of random primer was added to 10 µg total RNA in 9 µl for 10 min at 70°C and cooled on ice. To each sample was added 5× first strand buffer (4 µl), 0.1 M DTT (2 µl), dNTP mix (10 mM dATP, dGTP and dTTP and 2.5 mM dCTP) (0.5 µl), RNaseOut (0.5 µl), Superscript II reverse transcriptase (1 µl) and 25 mM Cy–dCTP (1.5 µl). Reverse transcription was carried out at 42°C for 2.5 h. Two units of RNase H were added for 30 min at 37°C. This method was found to generate fluorescent cDNA fragments ∼180 ± 80 nt in length (data not shown). For RNA expression level comparison, Cy3 and Cy5 cDNA samples were mixed at this point and purified from labeled primers using the Life Technologies Concert PCR purification kit and eluted by adding 50 µl of water (70°C) to the purification column, allowed to stand at room temperature for 10 min, then spun at >12 000 g for 2 min. Samples were prepared for microarray hybridization by adding 75 µl of 3.3× buffer (13.75× Denhardts, 14.5× SSC, 333 µg/ml herring sperm DNA) and 125 µl of formamide (final 50% formamide, 4.1× Denhardts, 4.4× SSC, 100 µg/ml herring sperm DNA).
Hybridizations, scanning and analysis
Hybridizations were carried out using a 125 µl sample under a supported coverslip at 42°C for 16–18 h at high humidity. Coverslip and supports were gently removed (4× SSC in a wash bottle) and arrays were washed by immersion into 1× SSC, 0.1% SDS for 10 min (10 slides in 250 ml), 0.1× SSC, 0.1% SDS twice for 10 min and 0.1× SSC twice for 10 min and dried by centrifugation. Slides were scanned on a Molecular Dynamics Generation III scanner to detect Cy3 and Cy5 fluorescence. Raw data analysis was carried out using Array Vision 4.0 (Imaging Research, St Catharines, Ontario, Canada).
RESULTS
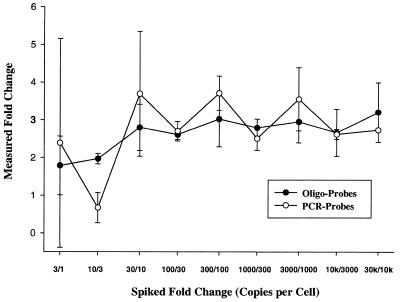
Oligonucleotide probes and PCR probes were designed to detect a subset of prokaryotic transcripts added to eukaryotic total RNA (Table 1). All oligos were synthesized with a C6 amino linker modification at the 5′-end to enhance covalent attachment to the activated glass slide surface. Similarly, sense strand PCR primers included a 5′ amino linker. To assess microarray sensitivity the ability to detect 3-fold changes in spiked RNA was evaluated using both oligonucleotide probe and PCR probe microarrays. Although microarray sensitivity is often defined as the minimum reproducible signal detected (by a given array scanning system), we have chosen to define sensitivity as the lowest concentration of a known ratio (or fold change) that can be reproducibly detected. Prokaryotic mRNAs were added to total rat liver RNA at increasing levels in 3-fold increments from low (1 compared to 3 copies/cell) to high (10 000 compared to 30 000 copies/cell). This approach allows all aspects of the sample preparation (i.e. cDNA synthesis, purification, hybridization parameters and scanning parameters) to influence the measurement of sensitivity in the assay. Labeling and hybridization of rat liver total RNA (without the added prokaryotic transcripts) did not result in detectable signal for any probe sets designed to detect prokaryotic transcripts (data not shown). The copies/cell calculation used here assumes 360 000 mRNA transcripts/cell, 20 pg total RNA/cell and 1 pg poly(A) mRNA/cell [e.g. 100 copies/cell = 0.015 ng ‘spike’ transcript/µg total RNA or 0.3 ng ‘spike’ transcript/µg poly(A) mRNA]. The added prokaryotic mRNAs were assayed using a two-color analytical strategy where ratios (Cy3 spot signal/Cy5 spot signal) representing oligonucleotide probes were compared to PCR probes to determine if oligonucleotide probe microarrays represent a significant compromise in sensitivity. Figure 1 shows that the overall microarray sensitivity is not significantly different when using oligonucleotide probes or PCR probes. Both probe types can reproducibly detect ∼10 copies/cell and discern a 3-fold change in mRNA levels at this range. These data indicate that no compromise in sensitivity occurs from the use of oligonucleotide probe as compared to PCR probe species in the two-color microarray assay system. Note that all experimental comparisons utilized amino-modified sequences spotted onto ‘activated’ slide surfaces and comparisons with other common substrates (e.g. polylysine) were not evaluated. Northern blot analysis was employed to confirm 3-fold changes in added prokaryotic transcripts, however, northern blot analysis was not optimized for a sensitivity comparison with microarrays. Microarray and northern blot results showed a good correlation between the theoretical and measured 3-fold spiked changes at higher concentrations, as high as 10 000–30 000 copies/cell (data not shown).
Table 1. Oligonucleotide probes to detect lys, thr, trp and dap.
| Transcript | Oligo name | Sequence |
|---|---|---|
| lys_A | X17013_846 | TAGAAGCGCATACGCATGACTACATTACAACGGGCCAGGAAGATTCAAAG |
| lys_B | X17013_558 | CGAGCAAAGCATTCTCATCAGTCGCAATGATTCAGCTCGCTGAGGAAGAG |
| thr_A | X04603_1765 | CAAATGATCCGCGTCCCGAATGCTGACATTGACGTAGTCGTTGTCATTCC |
| thr_B | X04603_665 | CGTTCCATCTGTGAGAAATCACCGATTGCCCTTGTCAACTCAGTCAACCC |
| trp_A | K01391_2812 | TTACAGCACCGACCGACGTGATTGAATTAAAGGACGGAGAGCGCCGGGAG |
| trp_B | K01391_3068 | AGCATTAGAGACGATTACAAGCGGAGGCGCTGCCGCGCAGCTTGAACGAC |
| dap_A | L38424_1820 | CTTCATCATGACCAGAAGCTTGACGCACCAAGCGGAACTGCGCTTAAAAC |
| dap_B | L38424_1952 | GCGGAGCAAAACGGTATTCGCTTGCACAGGCTTCAGATACGCCATGATTC |
Oligonucleotides include a C6 amino linker modification at the 5′-end to allow covalent attachment to the activated microarray surface.
Figure 1.
Comparison of oligonucleotide probe and PCR probe sensitivity. Microarray sensitivity was measured by detecting known fold changes at varying RNA levels using oligonucleotide probe and PCR probe microarrays. thr, dap and trp mRNAs were added to total rat liver RNA at varying concentrations and assayed using two-color microarray analysis. Oligonucleotide data represents two oligonucleotide probes per transcript in duplicate using three different transcripts (thr, dap and trp), PCR probe data represents one PCR probe per transcript in duplicate using these three transcripts. The x-axis is labeled with the ratio of added (‘spiked’) transcripts (e.g. 3/1 represents the measured, normalized ratio of 3 copies/cell to 1 copy/cell).
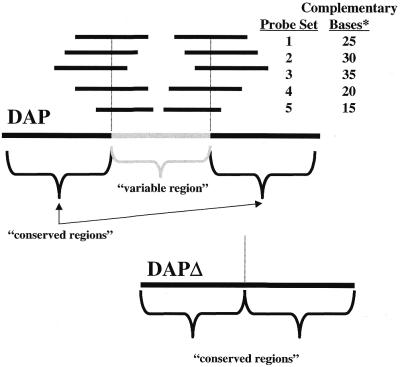
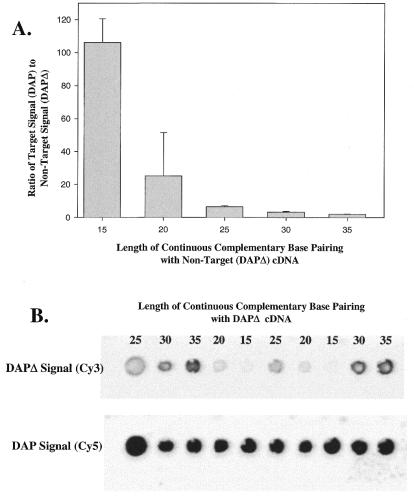
An obvious concern with oligonucleotide probe hybridizations is the specificity for a targeted sequence. To evaluate the specificity of oligonucleotide probes, studies were carried out to identify the length of identical sequence similarity (i.e. contiguous similarity) required for cross-hybridization and to define the degree of overall sequence similarity allowable yet still discriminate between target versus non-target transcripts. To characterize the contiguous length of sequence similarity required for cross-hybridization, 15 oligonucleotide probes were designed to bridge engineered splice sites in a prokaryotic transcript, dap (Fig. 2). The engineered splice sites were the result of an internal 239 bp (bases 1131–1370) deletion in the dap gene to produce dapΔ (see Materials and Methods). Oligonucleotide probes were designed to detect the dap transcript (cDNA) but included varying lengths of contiguous complementary sequence with the dapΔ sequence (Fig. 2). To determine the degree of cross-hybridization, equal amounts of in vitro transcribed dap and dapΔ mRNA were added into rat liver RNA and fluor-cDNA was synthesized with Cy5 or Cy3 labeling, respectively. dap cDNA (Cy5) and dapΔ cDNA (Cy3) were mixed and hybridized. Results show the ratio of dap to dapΔ (target/non-target) correlated with the length of complementary sequence (Fig. 3). The non-target (dapΔ) complementary sequence of 15 bp in length (oligonucleotide probe set 5, Fig. 2) had a ratio of 106.2 ± 14.4 (target/non-target), which indicates that the non-target signal (dapΔ) is ∼1% of the target (dap) fluorescence signal (Fig. 3). Similarly, oligonucleotide probe set 4 had a non-target (dapΔ) complementary length of 20 bp and a ratio of 25.2 ± 2.6 (target/non-target), indicating that the non-target signal represented ∼4% of the target (dap) signal. As expected, longer regions of contiguous complementary sequence with the non-targeted cDNA (dapΔ) were more problematical (complementary lengths of 25, 30 and 35 bases represented ∼15, 30 and 50% of the target signal, respectively). These results suggest that a non-target transcript that includes a region of 100% sequence similarity with the target transcript should be limited to ∼15 bases for target-specific (i.e. gene-specific) oligonucleotide probe detection. Increasing the hybridization temperature to over 50°C slightly improved the ratios of probe sets 4 and 5 but did not significantly alter the other probe sets, while simultaneously decreasing the fluorescence intensity of all data points, suggesting an adverse effect on sensitivity (data not shown).
Figure 2.
Oligonucleotide probe specificity as a function of contiguous complementary base pairs. Oligonucleotide probes (50mers) were designed to detect dap cDNA with varying degrees of complementary sequence to the engineered deletion (dapΔ cDNA). Probe set 1 (two oligonucleotide probes) includes a 25 bp complementary sequence with the conserved region present in dapΔ, probe set 2 contains 30 bp of complementary sequence, probe set 3 contains 35 bp of complementary sequence and so on. Note that probe set 3 includes the largest complementary sequence (35 bp) while probe set 5 contains the smallest (15 bp).
Figure 3.
The ratio of target signal (dap) to non-target signal (dapΔ) using the probe sets outlined in Figure 2. (A). The graph shows that the presence of 15 continuous complementary base pairs results in a target/non-target (dap/dapΔ) signal ratio slightly greater than 100, i.e. the target signal is ∼100 times greater than the non-target signal. The target signal for the 20 bp complementary probe set is ∼25 times greater than the non-target signal. Thus the contribution of non-target signal is ∼1, 4, 15, 30 and 50% of the target signal for the complementary sequences of 15, 20, 25, 30 and 35 bp, respectively. (B) Raw data from one microarray where dap cDNA is labeled with Cy5 and dapΔ is labeled with Cy3. The length of continuous complementary base pairs is noted above the features.
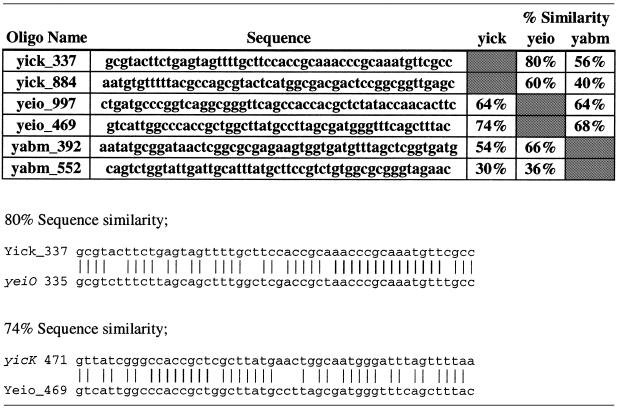
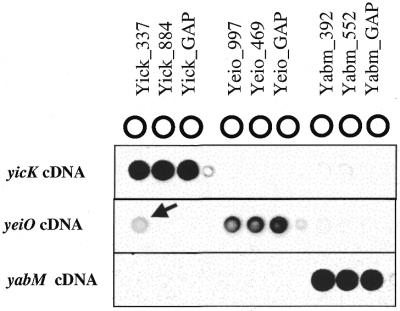
To further characterize oligonucleotide probe specificity, gene-specific oligonucleotide probes were designed to detect three highly homologous E.coli transcripts (yicK, yabM and yieO) (Table 2). Oligonucleotide probes were targeted to regions of varying sequence similarity ranging from 30 to 80%. For example, oligonucleotide probe yicK_337, which was designed to detect yicK cDNA, had 80% complementary sequence with yeiO cDNA. Similarly, oligonucleotide probe yabM_552 had only 30% complementary sequence with yicK (Table 2). yicK, yabM and yeiO mRNA were each added into rat liver total RNA and Cy-dye cDNAs were prepared for microarray analysis. With the exception of oligonucleotide probe yicK_337, all oligonucleotide probes were specific for their respective target cDNA and showed no detectable non-target signal (i.e. no cross-hybridization). Oligonucleotide probe yicK_337, which included 80% complementary with yeiO cDNA (50% GC content within paired bases), did detect yeiO cDNA (non-target) signal that was 18% of target signal (Fig. 4). Interestingly the sequence similarity of yicK_337 with yeiO cDNA included 14 bases of contiguous complementary sequence, yet oligonucleotide probe yeiO_469, which included 74% complementary with yicK cDNA (eight bases of contiguous complementary sequence, 51% GC content within paired bases), did not generate a non-target signal (Fig. 4). These data suggest that the length of contiguous complementary sequence is a critical variable for gene-specific oligonucleotide probe design. All together these data suggest that oligonucleotide probes with <75% overall sequence similarity with non-target sequences and <14 contiguous complementary base pairs are gene-specific under the hybridization conditions described.
Table 2. Oligonucleotide probes to detect yicK, yabM and yeiO transcripts.
Alignments show the sequence similarity of oligonucleotide probe Yick_337 (oligo target region) with the yeiO transcript, which showed cross-hybridization, as well as oligonucleotide probe Yeio_469 with the yicK transcript, which did not cross-hybridize.
Figure 4.
Microarray specificity (i.e. cross-hybridization) using varying degrees of non-target cDNA similarity (see Table 2). Microarrays were constructed which included oligonucleotide probes to detect yicK, yeiO and yabM cDNA. Three different microarrays are shown hybridized with yicK, yeiO or yabM cDNA. The arrow indicates non-target detection of yeiO cDNA with probe Yick_337 that is 18% of the target signal (yicK cDNA hybridized to probe Yick_337).
DISCUSSION
The present study shows oligonucleotide probe microarrays to be equal in sensitivity to PCR probe microarrays using two-color ratios to determine changes in mRNA. Gene specificity using oligonucleotide probe microarrays requires non-target transcripts (cDNAs) to be <75% similar in sequence within the 50 base target region (i.e. hybridization site) to prevent significant cross-hybridization. In addition, stretches of contiguous complementary sequence (100% similarity) >15 bp must be avoided. These data suggest that the use of a ‘degenerate’ oligonucleotide probe is possible for the detection of different highly homologous sequences (or homologous sequence regions) with a single oligonucleotide probe sequence. Degenerate oligonucleotide probes may be of particular utility when assaying mRNA changes of highly inducible, highly homologous genes (i.e. P450 metabolic enzymes) within a model species. In this example a single oligonucleotide probe could be designed to detect all members of a functional, highly homologous P450 subfamily, thereby indicating that further evaluation of this result is required. In a similar approach, oligonucleotide probe microarrays should have utility in assaying highly conserved genes across a wide range of species. Certainly mRNA sequence alignments of many conserved genes from yeast to humans show regions of sequence similarity >80% and oligonucleotide probe microarrays targeting these transcript regions could be employed across many species. However, the ability to definitively design oligonucleotide probe sequences is dependent on the amount (and quality) of sequence data available for a model organism as well as the tools available to procure, improve and mine a gene sequence database.
The present study utilized in vitro transcribed prokaryotic mRNAs to study oligonucleotide probe microarray variables. This approach allowed specific concentrations of known transcripts to be added to a complex mixture of eukaryotic total RNA prior to cDNA synthesis. As mentioned above, no signal was detected on prokaryotic-specific oligonucleotide probes when Cy-dye cDNA was prepared from total eukaryotic RNA lacking these prokaryotic ‘spiked’ transcripts. Therefore, signals detected from prokaryotic-specific oligonucleotide probes were not confounded by eukaryotic cDNA cross-hybridization. Since random priming was employed (see Materials and Methods), the absence of a 3′ poly(A) tail did not distinguish or bias these prokaryotic transcripts from the eukaryotic transcripts during cDNA synthesis. This approach of adding known prokaryotic transcripts to total RNA allows the variables of cDNA synthesis and purification to contribute to overall microarray performance and best represents the entire assay method. It is important to mention that the use of a 3-fold change in ‘spiked’ transcripts was employed to assess microarray sensitivity and does not suggest that measuring a 3-fold change in an unknown mRNA is biologically significant.
One advantage of using an oligonucleotide probe microarray is the opportunity to target a specific region of the transcript (e.g. splice variant regions). Since many genes are known to consist of splice variants, the opportunity to specifically detect these transcripts with an oligonucleotide probe microarray is of great utility. However, this approach is confounded when multiple variants of a single gene transcript are present in a given RNA sample. For example, consider the situation in which a transcript variant that lacks an internal segment is present in a given RNA sample along with the full-length form of the same transcript. Both the transcripts are identical at the 5′- and 3′-ends. In this example it may be impossible to determine changes in the shorter variant since it lacks a unique sequence that could differentiate it from the longer form. Similarly, the longer form is unique only in the internal segment. The present study indicates complementary pairing >15 contiguous base pairs allows cross-hybridization with non-target cDNA. Therefore, targeting splice ‘sites’ with oligonucleotide probes to detect specific splice variants is not feasible as non-target transcripts (other splice variants of the targeted gene) can cross-hybridize. However, targeting multiple regions of transcripts that do not share significant sequence similarity offers insight into splice variants that may be present in the RNA sample, as well as multiple ratios of a single transcript of interest.
There is growing concern among users of this technology regarding a disparity in the relative changes in mRNA levels measured with the microarray platform as compared to northern blot analysis (7). Given that most current microarrays utilize PCR probes of various lengths (i.e. ‘cDNA arrays’), this disparity may result from longer probe sequences that may allow some cross-hybridization with non-target transcripts and therefore allow non-specific hybridization signal to contribute to the overall signal. In support, cross-hybridization with multiple transcripts involving a region of similar sequence identity using cDNA microarrays has been reported (8–10). This is not surprising considering that northern blot analysis occasionally reveals multiple, non-specific bands in addition to the target band (mRNA) of interest, presumably due to cross-hybridization with the labeled probe. It is conceivable that using that same northern blot probe as a microarray probe would allow cross-hybridization to contribute to the total signal intensity of that spot (under similar hybridization conditions). This would tend to alter the dynamic range (i.e. underestimate mRNA change compared to northern blot analysis), particularly if non-target sequences were not regulated in concert with the target transcript. Alternatively, if microarray cross-hybridization occurs with a transcript that is regulated in concert with the target mRNA (e.g. a smaller fragment of the target mRNA), the effect would be to overestimate target mRNA changes compared to northern blot analysis. Altering northern blot hybridization conditions to minimize cross-hybridization is often achievable, but may be extremely difficult on the microarray platform where thousands of different PCR probes represent a heterogeneous set of ‘optimal’ hybridization conditions. Therefore, oligonucleotide probes with similar lengths, minimal secondary structure and similar GC content limit the variability of probe–target melting temperatures across the microarray platform and allow for optimal hybridization conditions that limit cross-hybridization. An equally important variable for optimizing gene-specific hybridization may be the length of the target (i.e. fluorescent cDNA) used for hybridization. The present study employed random priming that resulted in cDNA fragments of 180 ± 80 nt, however, this variable was not evaluated within the context of cross-hybridization. Experimentally, perhaps the best strategy is to employ ‘spiked’ transcripts where theoretical (i.e. expected) results enable assay optimization and monitoring of overall microarray performance.
In summary, the present study suggests that oligonucleotide probe microarrays offer a convenient option for microarray production, but require knowledge about the target gene and its sequence similarity to other transcripts that may be present in the RNA sample. Furthermore, sensitivity is not compromised when employing an oligonucleotide probe microarray design as compared with PCR probe microarrays.
REFERENCES
- 1.Gygi S.P., Rochon,Y., Franza,B.R. and Aebersold,R. (1999) Mol. Cell. Biol., 19, 1720–1730. [DOI] [PMC free article] [PubMed] [Google Scholar]
- 2.Brown P. and Botstein,D. (1999) Nature Genet., Suppl. 21, 33–37. [DOI] [PubMed] [Google Scholar]
- 3.Debouck C. and Goodfellow,P.N. (1999) Nature Genet., Suppl. 21, 48–49. [DOI] [PubMed] [Google Scholar]
- 4.Ryu D.D. and Nam,D.H. (2000) Biotechnol. Prog., 16, 2–16. [DOI] [PubMed] [Google Scholar]
- 5.Lockhart D.J., Dong,H., Byrne,M.C., Follettie,M.T., Gallo,M.V., Chee,M.S., Mittman,M., Wang,C., Kobayashi,M., Horton,H. and Brown,E.L. (1996) Nat. Biotechnol., 14, 1675–1680. [DOI] [PubMed] [Google Scholar]
- 6.Zammatteo N., Jeanmart,L., Hamels,S., Courtois,S., Louette,P., Hevesi,L. and Remacle,J. (2000) Anal. Biochem., 280, 143–150. [DOI] [PubMed] [Google Scholar]
- 7.Okamoto T., Suzuki,T. and Yamamoto,N. (2000) Nat. Biotechnol., 18, 438–441. [DOI] [PubMed] [Google Scholar]
- 8.Bartosiewicz M., Trounstine,M., Barker,D., Johnston,R. and Buckpit,A. (2000) Arch. Biochem. Biophys., 376, 66–73. [DOI] [PubMed] [Google Scholar]
- 9.Heller R.A., Schena,M., Chai,A., Shalon,D., Bedilion,T., Gilmore,J., Woolley,D.E. and Davis,R.W. (1997) Proc. Natl Acad. Sci. USA, 94, 2150–2155. [DOI] [PMC free article] [PubMed] [Google Scholar]
- 10.Richmond C.S., Glasner,J.D., Mau,R., Jin,H. and Blattner,F.R. (1999) Nucleic Acids Res., 27, 3821–3835. [DOI] [PMC free article] [PubMed] [Google Scholar]


