

Abstract
Covalent inhibitors represent a promising class of therapeutic compounds. Nonetheless, rationally designing covalent inhibitors remains extremely challenging. To better understand the covalent binding mechanism, these issues are examined with computational methods using the irreversible covalent inhibitor of Bruton tyrosine kinase (BTK) ibrutinib as an example. A multi-μs classical molecular dynamics trajectory of the unlinked inhibitor is generated to explore the fluctuations of the compound associated with the kinase binding pocket. Then, the reaction pathway leading to the formation of the covalent bond with the cysteine residue at position 481 via a Michael addition is determined using the string method in collective variables on the basis of hybrid quantum mechanical - molecular mechanical (QM/MM) simulations. The reaction pathway shows a strong correlation between the covalent bond formation and the protonation/deprotonation events taking place sequentially in the covalent inhibition reaction, consistent with a 3-step reaction with transient thiolate and enolates intermediate states. Two possible atomistic mechanisms affecting deprotonation/protonation events from the thiolate to the enolate intermediate were observed: a highly correlated direct pathway involving proton transfer to the Cα of the acrylamide warhead from the cysteine involving one or a few water molecules, and a more indirect pathway involving a long-lived enolate intermediate state following the escape of the proton to the bulk solution. The results are compared with experiments by simulating the long-time kinetics of the reaction using kinetic modeling.
Graphical Abstract

INTRODUCTION
Covalent drugs represent a class of small therapeutic compounds that can covalently bind to specific target proteins, thereby inhibiting their biological functions.1–3 The potential benefits of covalency have inspired medicinal chemists to explore the covalent drug space despite concerns about reactivity. In many cases, compromises between reactivity, selectivity, and potency have produced safe and effective drugs. However, despite the increasing number of FDA-approved covalent inhibitors,2 rationally designing covalent drugs remains extremely challenging. The formation of a chemical bond between the compound and its target can lead to prolonged engagement and exceptional potency, which is advantageous. However, the imperfect selectivity of a highly reactive molecule binding irreversibly to off-target proteins can also lead to severe side effects. To alleviate these issues, the dominant design strategy has been to add a mildly reactive functional group (warhead) targeting non-conserved amino acids to an existing non-covalently binding framework that is already selective for a desired protein.4 Conventional docking methods developed to describe non-covalent proteinligand interactions have been expanded to model the covalent docking of a ligand with the protein.5–11 The general philosophy is that poses, where the warhead is in close proximity to a reactive amino acid, are automatically identified and used to construct a covalently bound adduct. Despite the progress, going beyond simple considerations based on static binding poses is difficult and many mechanistic aspects of covalent binding remain poorly understood.12,13 Owing to their growing significance, it is important to advance our fundamental understanding of covalent inhibitors, and develop accurate computational treatments to support the rational design of these compounds.
The two fundamental steps of irreversible covalent inhibition are represented in Scheme 1.14 Initially, the inhibitor (I) diffuses in the bulk solution to encounter the kinase enzyme (E), resulting in the non-covalent association with the kinase active site. Then, the non-covalently associated ligand fluctuates dynamically in the binding pocket, until the the electrophilic warhead is favorably positioned to undergo a reaction with the nucleophilic amino acid residue of the target enzyme. At this point, the chemistry may proceed through a series of transitions leading to the covalent inhibition of the kinase. All the events preceding the chemical changes occur for non-covalent as well as covalent inhibitors.
Scheme 1:

Mechanism of covalent inhibition of the enzyme E by the inhibitor I (E•I and E–I denotes the equilibrium noncovalent complex and the covalent adduct, respectively).
An interesting prototypical example of a covalent inhibitor is offered by the anti-cancer covalent drug ibrutinib (PCI-32765).15 Ibrutinib (Figure 1) is an irreversible covalent inhibitor of Bruton tyrosine kinase (BTK), which plays a key role in the proliferation and survival of leukemic cells in many B-cell malignancies and is a critically important therapeutic target in the treatment of B-cell malignancies, such as certain leukemia and lymphomas, as well as inflammatory disorders and autoimmunity.16–19 Protein kinases represent a critically important class of signaling enzymes that are implicated in numerous diseases including cancer. Because the active site of kinases has evolved to bind ATP, designing highly specific inhibitors is generally difficult. The purposeful addition of a reactive functional group to an existing ligand in order to covalently target non-conserved amino acids in the kinase active site offers a promising solution to the problem.20 In the early design of ibrutinib, sequence alignments analysis pointed toward a cysteine residue at position 481 in the ATP binding pocket of BTK as a potential nucleophilic site to form a covalent complex with an electrophilic inhibitor.15 It was also noted that this residue was in the same position as Cys773 in EGFR family kinases, which was known to be targeted by several irreversible kinase inhibitors in clinical trials.21 More generally, only a few kinases have a non-catalytic cysteine at this position, which suggests that it could be exploited in the design of selective covalent inhibitors.15
Figure 1:
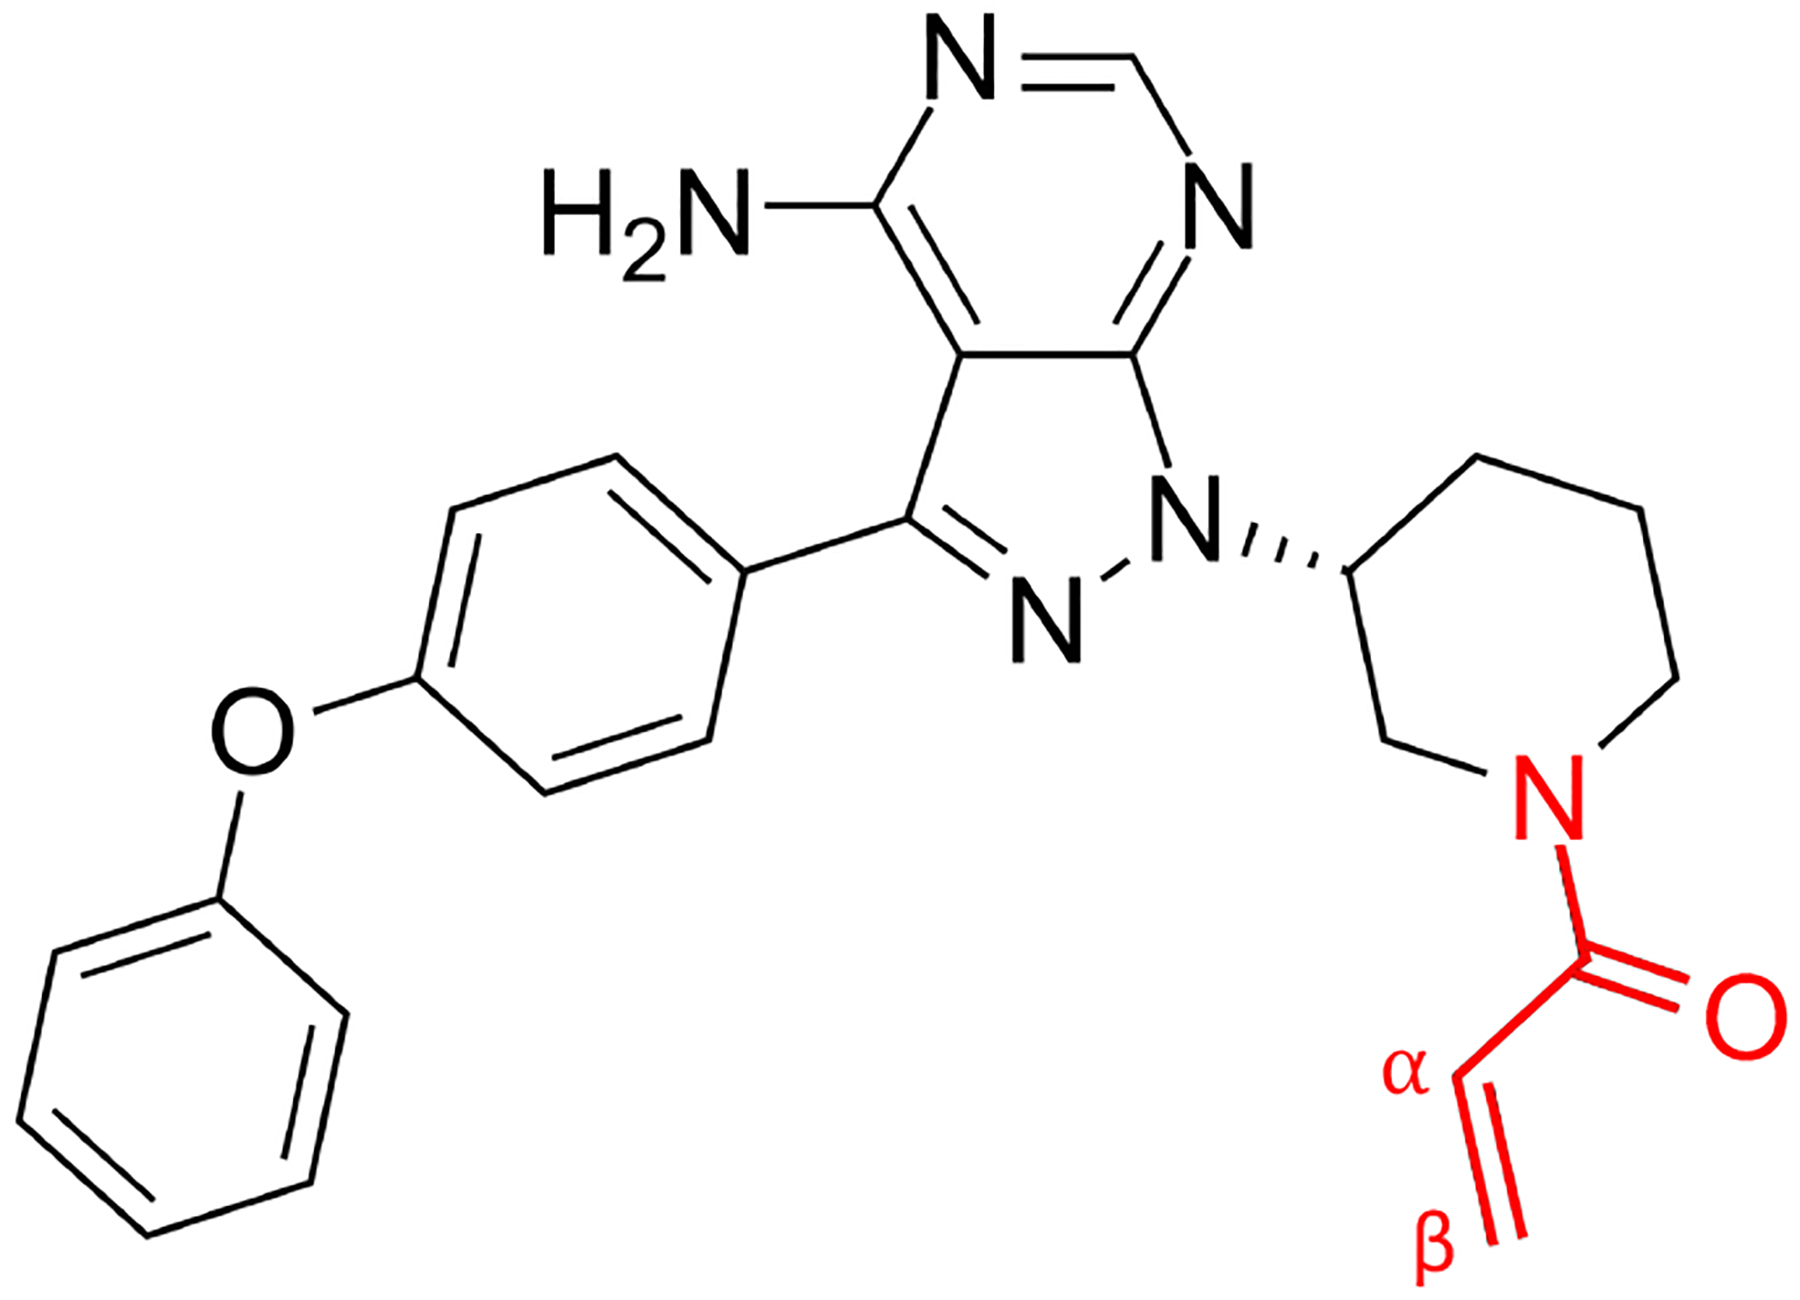
The ibrutinib molecule with its acrylamide warhead (red) which covalently binds to cysteine 481 in BTK.
To bind irreversibly, ibrutinib utilizes a thiol-Michael addition to assist in the formation of the covalent bond between the electrophilic acrylamide “warhead” on the inhibitor and the nucleophilic Cys481 in the active site of the BTK (Figure 1). This last step occurs via a Michael addition with thiolate and enolate intermediate states, as depicted in Figure 2.
Figure 2:

Schematic representation of the reaction steps of the Michael addition leading to the covalent inhibition of BTK by ibrutinib. First, the ligand in the active site of BTK is positioned to start the chemical reaction. The deprotonation of Cys481 yields a thiolate, which then attacks the carbon Cβ of the acrylamide warhead to form a covalent bond, resulting in the anionic enolate intermediate. In the final step, the carbon Cα gets protonated, yielding the covalently inhibited BTK.
Computations can shed light on the dynamical factors affecting the Michael addition reaction in the confined environment of the kinase active site, leading to the covalently inhibited BTK. The nature of the problem of covalent inhibition requires a hybrid quantum mechanical/molecular mechanical (QM/MM) representation of the system.22–24 In a pioneering study, Voice et al25 explored possible reaction pathways of BTK inactivation by ibrutinib using umbrella sampling QM/MM simulations. However, many key mechanistic details about the solvent-mediated deprotonation and protonation events have not been elucidated. Of particular interest is the existence of the transient anionic thiolate and enolate intermediate states, which are accompanied by subtle electronic changes.26,27
Our overarching goal is to comprehensively describe the key steps leading to the covalent inhibition of BTK by ibrutinib. To this end, we first generated a multi-μs classical molecular dynamics (MD) trajectory of the unlinked inhibitor associated with the kinase and then determined the reaction pathway leading to the formation of the covalent inhibition using QM/MM simulations using the string method in collective variables.28–33 The results are finally put into a general context by simulating a simple kinetic model representing the microscopic transitions involved in covalent inhibition of BTK by ibrutinib.
METHODS
Simulation system
A complete atomistic model of BTK kinase with ibrutinib was constructed. The protein and ligand coordinates were taken from the 1.08 Å resolution crystallographic structure with PDB ID: 5P9J.34 The binding pose of ibrutinib is similar to that of dasatinib,35 with the additional covalent bond with residue Cys481. The system was solvated with 18397 water molecules, 59 K+ and 53 Cl− ions, corresponding to a physiological salt concentration of 140 mM. The model was built using the CHARMM-GUI web server,36–38 and subsequently equilibrated with molecular dynamics (MD). The CHARMM36 force field39,40 was used for the protein, and the TIP3P model was used for the water molecules.41 The unlinked ibrutinib molecule was parameterized with CGenFF v2.5.142–44 through CHARMM-GUI.37,38 The topology and parameter files generated in CHARMM format by CGENFF are given at https://github.com/RouxLab/ibrutinib. A classical trajectory of 6.6 μs was generated using the GPU-resident version of the AMBER program.45–47 Periodic conditions were applied. The dimension of the cubic simulation system is approximately 80 Å. Long-range electrostatic interactions were handled by PME.48 Lennard-Jones non-bonded interactions were truncated at a 14 Å pairlist cutoff, with a smooth forced-based switching from 10–12 Å consistent with the CHARMM force field.49 The equations of motion were integrated using a time step of 4 fs with mass repartitioning.50 The bonds involving hydrogen atoms were constrained using the rattle algorithm.51 The temperature was set to 303.15 K via a Langevin thermostat with a friction of 0.5 ps−1. The pressure was set to 1 atm via Monte Carlo volume fluctuations.45–47 The trajectory was visualized using VMD for analysis.52
Hybrid QM/MM simulations
A hybrid QM/MM approach is necessary to accurately represent the chemical rearrangements taking place during the binding of ibrutinib with BTK.22,23 We used the implementation in NAMD 2.14,24 as it supports a number of additional tools that are required for the calculations.53,54 The QM/MM simulation system was constructed directly from the periodic box used for the classical MM simulation described above. The Michael addition leading to covalent inhibition of BTK corresponds to the deprotonation of the Sγ atom of Cys481, the formation of a covalent bond between the Cβ atom of ibrutinib and the Sγ atom of Cys481, and the protonation of the Cα atom of ibrutinib. Accordingly, the QM region was chosen to include all relevant atoms to accurately model the chemical rearrangement involved in the reactions of interest. Regarding the ibrutinib ligand, the QM region includes the acrylamide warhead and its neighboring pyrrolopyrimidine group. The rest of the inhibitor is represented with classical MM. On the protein side, the QM region includes the entire Cys481 residue together with the backbone atoms of Gly480 and Leu482 which are the nearest neighboring residues along the sequence. The bonds crossing the QM/MM boundary in the protein and inhibitor were capped by hydrogen atoms to satisfy the valences of the QM region.24 In addition, 16 water molecules, selected based on a proximity criterion of 3.6 Å from the Cα, Cβ, and Sγ atoms, were included in the QM region to account for solvent effects on the reactions, corresponding to a first shell of solvation around the heavy atoms of interest in the QM region. In total, the QM region comprises 106 atoms. The overall QM/MM ibrutinib-BTK simulation system is illustrated in Figure 3.
Figure 3:

QM/MM simulation of ibrutinib bound to BTK. (top) The QM/MM region in relation to the complete kinase structure. (bottom) Close-up view of the QM/MM region and binding pocket. The atoms of the QM region, shown in color with thick bonds, include the acrylamide warhead and the neighboring pyrrolopyrimidine group (the rest of the inhibitor simulated with a classical force field is represented with thin bonds), Cys481 and the backbone atoms of Gly480 and Leu482, and 16 water molecules. In total, the QM region comprises 106 atoms. The entire system was solvated in a box of aqueous solution at 140 mM KCl and simulated with periodic boundary conditions.
The semi-empirical NDDO method PM7,55 supported by the MOPAC 2016 program,56,57 was used to represent the QM region. Again, the CHARMM36 force field39,40 was used with TIP3P water model41 to represent the MM region of the system. The QM/MM trajectories were integrated with a time step of 0.4 fs to increase numerical stability. The standard MD protocol in NAMD 2.14 was followed:54 the temperature was set to 303.15 K with the Langevin thermostat and the pressure was set to 1 atm with the Langevin piston. Long-range electrostatic interactions were handled by PME. Short-range non-bonded interactions were handled with a 14 Å pairlist cutoff, and a smooth 10–12 Å force switching for van der Waals interactions. The equations of motion were integrated with a time step of 0.4 fs. As the simulations progressed, the configurations were wrapped with PBCTools as needed and visualized using VMD.52 After the final setup, the QM/MM system was relaxed briefly for 1,000 MD steps prior to initiating the pathway calculations.
String and collective variables
The string method represents a reaction pathway connecting the reactant and product as a chain of M states, or “images”, which is an ordered sequence {z1,z2,…,zM} parametrized within the subspace of “collective variables” (CVs) z.28–33 First, a set of meaningful CVs able to monitor the progress of the reaction must be chosen. As depicted in Figure 2, the thiol-Michael addition leading to covalent inhibition requires the deprotonation of the Sγ atom of Cys481, the formation of a covalent bond between the Cβ atom of the ibrutinib acrylamide warhead and the Sγ atom of the Cysteine residue at position 481, and the protonation of the Cα atom of ibrutinib. One obvious CV is directly associated with the formation of the chemical bond between ibrutinib and BTK. Neglecting orientational effects, we chose the interatomic distance between the Cβ atom of ibrutinib and the Sγ atom of Cys481, rSC for the sake of simplicity. Two additional CVs are needed to monitor the deprotonation of Sγ and protonation of Cα along the Michael addition reaction. Importantly, such CVs must be constructed to reflect the fact that the protons in the QM region are indistinguishable particles. To this end, a generalized mean distance between one atom A and a group of N protons was defined as,
This expression treats all the protons as identical particles but it weights more heavily the one at the shortest distance from atom A. In the present work, a value of 6 was used for n. The CVs monitoring the deprotonation of the Sγ atom and the protonation of the Cα atom are rS-[H] and rC-[H], respectively. The three CVs were implemented using the colvars module58 of NAMD.54
The algorithm consists of improving an initial string pathway starting from a reasonable initial guess by making small adjustments to the values of the CVs zi of each image (i = 1,…,M). Here, initial pathways were generated via steered MD (SMD) simulations by imposing a time dependence on the two first CVs, rSC and rS-[H], while allowing the third CV rC-[H] to evolve freely. This initial SMD pathway was then discretized into an ordered sequence of M images to produce an initial string in the subspace of CVs that was initially relaxed for 1.2 ps of MD with harmonic restraints on the protein backbone prior to the iterative optimization procedure. In the string method with swarms-of-trajectories (SMwST), the small adjustments to the string are calculated as the average dynamical drift from an ensemble of unbiased short MD trajectories of length τ, initiated from each of the images.32
At iteration k of the optimization cycle, each image i is first thermalized with a harmonic biasing restraint with force constant Ki to keep its 3 CVs near zi(k). A progressive force constant Ki of 1,000 kcal/mol·Å−2 was used to reset the CVs at their updated position. Those restraints are then released and the mean drift is determined from an ensemble (swarms) of unbiased trajectories of length τ initiated from each image as, . The position of each image i is then updated via . During the string relaxation, images are kept at an equal Euclidean distance between adjacent images i and i + 1. in the space of the CVs.28 Reparametrization is necessary to prevent the images from pooling at the free energy minima and keep the path well-resolved, especially in high-energy transition regions. The SMwST iteration cycle is repeated until the mean drift of all the images becomes parallel to the local tangent of the string and displays no orthogonal component, .32 Each cycle is made of 1) thermalization of the atomic conformations via restrained simulations at the collective variables values defining the images for 20 fs, and 2) launching from each image a swarm of 20, independent, 2 fs long, unbiased trajectories. In the present calculation, the string reached convergence in about 174 iterations, after which the path was further refined for 7 iterations using the mean force algorithm33 with trajectories lasting 4 ps. To monitor convergence at each iteration, we calculate the average of the RMSD of each image with respect to the same image in the initial path (path-RMSD) with respect to the initial path (see Supporting Figure S1). A plateau of this quantity means that the path is not changing anymore after updates. An alternative approach to optimize a string pathway, which is consistent with the mean force acting on each image in the space of the CVs, is to update the position of the images directly from the deviations of the CVs relative to the reference position during the restrained trajectory of iteration k, via .33 Because the deviation of the CVs relative to the reference position is related to the mean force exerted on each image in the CV subspace at iteration k, , convergence is reached when is parallel to the local tangent of the string for each image.33
Once the optimization has converged, the free energy profile along the resulting string, {z1,z2,…,zM}, can be calculated by integrating the mean force for image 1 to n using the trapezoidal rule,
| (2) |
where corresponds to the mean force calculated on image i, and zi corresponds to the coordinates of image i in the CV space. The mean force of each image, , was calculated from equilibrium QM/MM simulations of about 200 ps in the presence of harmonic restraints applied to the 3 CVs. A force constant Ki of 500 kcal/mol·Å−2 was used. The mean force was determined from the deviation relative to the reference values of the optimized string, . The statistical uncertainty with respect to the free energy profile W(zi) along the string stems from the estimated value of the mean force at each image. Using a bootstrapping block-averaging procedure, the statistical uncertainty on the mean force at each image was determined to be on the order of 0.2 to 2.2 kcal/mol/Å. The cumulated statistical error integrated from the bottom of a well to the top of the nearest barrier best represents the uncertainty on the free energy profile. Those values are reported in Table 1.
Table 1:
Estimated rates from transition state theory
| Transitiona i to j | ΔW (s†)(kcal/mol) | Lr (Å) | kij (s−1) | |
|---|---|---|---|---|
| 1 to 2 | 12.35 ±1.3 | 0.48 | 8.74 | 1.84 × 10⁴ |
| 2 to 1 | 2.69 ±1.0 | 0.42 | 8.74 | 2.25 × 10¹¹ |
| 2 to 3 | 5.61 ±0.6 | 0.42 | 2.27 | 4.42 × 10⁸ |
| 3 to 2 | 9.91 ±0.7 | 0.19 | 2.27 | 7.28 × 10⁵ |
| 3 to 4 | 5.01 ±0.7 | 0.19 | 8.68 | 1.03 × 10¹⁰ |
| 4 to 3 | 26.44 ±1.0 | 0.34 | 8.68 | 1.41 × 10⁻⁶ |
State 1: unlinked-associated inhibitor, state 2: thiolate, state 3: enolate, and state 4: final product.
PMF calculation of hydronium
To further characterize the reaction, the potential of mean force (PMF) of a hydronium cation (OH+3) leaving the binding pocket was determined from MD simulations based on a classical MM force field. To compute the PMF, we used the enhanced sampling algorithm WTM-eABF59,60 built upon a hybrid of the extended adaptive biasing force (eABF) method61–64 with well-tempered metadynamics (WTM),65–67 implemented within the colvars module58 of NAMD 2.14.54 The PMF is calculated as a function of the distance between the center-ofmass (COM) of the atoms Sγ, Cβ, and Cα and that of the OH+3 cation. The simulation system comprises the BTK kinase with bound ibrutinib in the anionic enolate intermediate state, one hydronium cation, 18,396 water molecules, and 59 K+ and 52 Cl− ions corresponding to a concentration of 0.176 and 0.156 M, respectively. The parameters of the classical OH+3 model were taken from Sagnella and Voth.68 The partial charges of the negatively charged ibrutinib in the enolate intermediate state were approximated as Mulliken charges from the QM/MM simulation (given in https://github.com/RouxLab/ibrutinib). The initial configurations for each WTM-eABF window were generated by steered MD (SMD) with the colvars module.54,58 For all of the simulations, the WTM bias temperature was set to 3000 K. For the eABF algorithm, the extended fluctuation, or standard deviation between the extended CV and the actual CV was set to 0.05 Å. The width of the bins for accumulating forces in the one-dimensional PMF calculation was set to 0.2 Å. For efficiency, the reaction pathway was separated into 3 windows, with the center window overlapping its neighbors by 1 Å. The value of the distance was recorded from 3.0 to 15.0 Å. The free-energy calculations were determined to have converged by the histogram of the sampling in each bin along the distance and by differences in the gradient of the PMF between the first and second halves of the simulation. The PMF and the associated gradient with the corrected z–averaged restraint (CZAR) estimator62 were output by the colvars module from the eABF data. The PMF was obtained from 2.6 μs of sampling in each window.
RESULTS
Dynamics of the unlinked inhibitor associated with the binding pocket
The first step leading to BTK inhibition is the reversible bimolecular association of the ibrutinib molecule to the kinase active site without the formation of a covalent bond with Cys481. The initial diffusive association of ibrutinib with the kinase may occur according to two scenarios, in which the side chain of Cys481 is either protonated (thiol) or deprotonated (thiolate). With an elevated pKa of about 7.7,69 the encounter is more likely to involve the thiol form, which is the situation that we consider here. This part of the problem essentially mirrors the familiar thermodynamic and kinetic behavior of a standard non-covalent kinase inhibitor. But more information on the state of the system following this initial step, before the chemical reactions begin, is needed to better understand how the covalent inhibition is likely to proceed. To characterize the structural dynamics of the unlinked inhibitor associated with the kinase active site, a 6.6 μs classical MD simulation was generated.
To provide a global view of the fluctuations of the unlinked ligand associated with the BTK binding pocket from the 6.6 μs classical MD simulation, we calculated the 2D-PMF as a function of the distance between the Cβ atom of the acrylamide warhead and the Sγ atom of Cys481, together with the RMSD of the inhibitor from its crystallographic binding pose (PDB ID: 5P9J34). The result is shown in Figure 4. The 2D-PMF shows that the ibrutinib molecule in the binding pocket fluctuates significantly while retaining its binding pose. The average root-mean-square deviation (RMSD) of the inhibitor relative to its crystallographic binding pose is 1.15 Å. The hydrogen bond between the carbonyl oxygen of the acrylamide warhead and the amide hydrogen of Cys481, which is present in the crystallographic structure,34) fluctuates but is nonetheless maintained 93% of the time according to a distance cutoff of 3.5 Å and and angle cutoff of 135◦. (Figure 5).
Figure 4:

2D-PMF calculated from the 6.6 μs classical MD simulation as a function of the distance between the Cβ atom of the acrylamide warhead and the Sγ atom of Cys481 along the x-axis, and the symmetry-corrected RMSD of the inhibitor’s heavy atoms from its crystallographic binding pose along the y-axis (PDB ID: 5P9J34). The deviation was calculated post-alignment of the binding pocket backbone Cα’s (within 10 Å of the inhibitor) to the crystallographic structure.
Figure 5:

Two distinct orientations of the Cys481 side chain occurring during the MD trajectory of unlinked ibrutinib associated with the BTK binding site have a direct impact on the interatomic distance, rCS (sienna dashed), between the Cβ atom (sienna) of the warhead and the Sγ atom (yellow) of Cys481. The larger interatomic distance of 6.1 Å shown in (top) occurs the most frequently (~ 95% of the time) when the χ1 dihedral of Cys481 (black dashed) is +50°. The smaller interatomic distance of 3.8 Å shown in (bottom) occurs infrequently (~ 5% of the time) when the χ1 dihedral of Cys481 is −50◦. The hydrogen bond (blue dashed) between the carbonyl oxygen (red) of the acrylamide warhead and the amide hydrogen (white) of Cys481 observed in the crystallographic structure34) is present in both configurations.
A key feature of interest is the interatomic distance rCS between the Cβ atom of the warhead and the Sγ atom of Cys481, the two atoms most directly involved in covalent inhibition. The main results are shown in Figure 6. Two distinctive values of rCS occur, corresponding to two different atomic configurations of the system (Supporting Figures S2 and S4). Figure 6 displays the histogram of this distance during the 6.6 μs classical MD simulation. The most prevalent state corresponds to a distance rCS of about 6.1 Å. Figure 5(top) displays this configuration, in which the side chain of the Cys residue is rotated, keeping the Sγ atom away from the drug’s warhead. Figure 5(bottom) displays a second state, occurring infrequently, with an average distance of 3.8 Å. This corresponds to an “activated complex” where the chemical reactions leading to covalent inhibition may start. This configuration is achieved by rotation of the cysteine side chain, bringing the Sγ atom closer to the Cβ atom of the warhead of ibrutinib. Transitions between the two metastable states are controlled by rotation of the rotation of the χ1 dihedral angle Sγ-Cβ-Cα-C of Cys481 switching between −50◦ and 50◦ (see Supporting Figure S2). About 95% of the time, the inhibitor and the side chain of Cys481 are separated by a distance on the order of 6.1 Å, too far from one another to allow the initiation of the chemical reactions leading to covalent inhibition. According to the classical trajectory, the system is configured favorably about 5% of the time to allow the formation of a covalent bond between the Cβ atom of the warhead and the Sγ atom of Cys481. This configuration is shown in Figure 5(bottom).
Figure 6:

Dynamics of the associated but not covalently bonded inhibitor from the 6.6 μs classical MD simulation. (top) Histogram of the interatomic distance, rCS, between the Cβ atom of the warhead and the Sγ atom of Cys481. Two states distinguished by the vertical dash line corresponding to a short and long distance are populated by about 5% and 95%, respectively. They correspond to two different orientations of the Cys481 side chain (Figure 5). (bottom) Log plot of the normalized time correlation function of the two states displaying an initial rapid relaxation followed by a near exponential decay (slope of the fitted dashed line is −0.059 ns−1 corresponding to a relaxation time of 17 ns).
Initial reaction pathways from SMD simulations
The string method aims at discovering the minimum free energy path and the free energy along the path in the subspace corresponding to a large but finite set of selected CVs.28–33 Whereas transition path sampling (TPS) offers a sophisticated strategy for determining the reaction mechanism of enzymes,70–72 it can be computationally prohibitive when multiple metastable states are encountered along a reaction pathway. The string method offers a computationally attractive alternative by aiming to construct an optimal reaction pathway directly over the free energy surface in the subspace of CVs.
To obtain an optimized string mapping of the covalent inhibition process, it is necessary to provide an initial reaction pathway that includes all three chemical events of interest. For this purpose, a series of 10 steered MD (SMD) simulations were generated with the QM/MM model starting from 10 independent equilibrium configurations of the reactant state (Supporting Figure S5). During the SMD simulations, the dynamical evolution of the CVs was enforced via time-dependent harmonic restraints to induce two of the chemical steps involved in the covalent inhibition. The change in the interatomic distance between the warhead Cβ atom and the Cys481-Sγ atom (rCS) enforces the formation of the covalent bond, and the change in the generalized mean distance (rS-[H]) controls the deprotonation of the Sγ atom to its surrounding solvent molecules. Including only these two distances in the SMD while allowing the generalized mean distance (rC-[H]) controlling the protonation of the Cα atom to evolve freely resulted spontaneously in a complete reaction pathway in 6 out of 10 SMD simulations. A typical SMD trajectory of this type of event is shown in Figure 7a. In the remaining 4 cases, the protonation of the Cα atom did not occur spontaneously upon the formation of the Sγ-Cβ covalent bond and the deprotonation of the Sγ atom. In this case, the proton is transferred from Sγ to the nearby water molecules and takes the form of a solvated hydronium cation in the neighborhood of the ligand. To complete the reaction in these 4 cases, the generalized mean distance (rC-[H]) controlling the protonation of the Cα atom was controlled via a time-dependent harmonic restraint in a subsequent SMD simulation (Supporting Figure S6). A typical SMD trajectory of this type of event is shown in Figure 7b. Two distinct mechanistic pathways could be identified from the 10 independent SMD simulations (Supporting Figure S7). The first one involves a single water molecule in the deprotonation/protonation events of the Sγ and Cα atoms, respectively. Figure S7 depicts this direct route followed by the proton during the deprotonation and protonation events. In 5 of the 6 cases where the protonation of Cα occurred spontaneously, the same proton was transferred from the Sγ atom to a water molecule, and then to the Cα atom of the warhead. The 4 cases where the effective distance rC-[H] was included in SMD correspond to a more indirect route of a proton on its way to the Cα atom. Once the proton is transferred from Sγ, a series of local transfers may lead to the stabilization of a solvated hydronium ion in the QM water molecules. As discussed below, the possibility that this hydronium cation may diffuse away in solution then results in a long-lived anionic enolate intermediate state. A comparison of the 10 pathways generated by the SMD simulations is shown in Figure S5. These initial pathways do not show a correlation between the 3 reactions. However, since 6 of the 10 pathways exhibit a spontaneous Cα protonation upon covalent bond formation, this suggests a possible correlation between these two reactions. However, the initial reaction pathway from SMD only represents a crude approximate transition reaction path. Results from SMD trajectories may be affected by the nonequilibrium time-dependent forces steering the atoms. To better assess the correlation between microscopic events, it is necessary to go beyond the results from simple SMD.
Figure 7:

Dynamical evolution of the CVs during SMD simulations. The evolution of the first two CVs, rCS (green line) and rS-[H] (blue line), was enforced through time-dependent harmonic constraints. The third CV, rC-[H] (red line), was allowed to evolve freely during the SMD simulations. (top) The entire covalent inhibition reaction including the Cα protonation reaction takes place spontaneously. (bottom) In the SMD simulations where the reaction paused at the enolate intermediate, the evolution of the third CV, rC-[H] was enforced during a subsequent SMD simulation to finalize the Cα protonation.
Optimized reaction pathway from the string method
To construct an initial string pathway, a set of 32 configurations spanning the transition were selected from the SMD trajectory. The 32 configurations were chosen to have the same Euclidian distance between adjacent images, calculated in the subspace of the 3 CVs, rSC, rS-[H], and rC-[H], to generate an initial string with equally spaced images. A total of 10 initial string pathways were generated and then optimized in CV space using the string method with swarms-of-trajectories (SMwST).32 The evolution of the 3 CVs along the optimized string, shown in Figure 8 (top panel), is suggestive of strong correlations between the three chemical reactions of interest. In particular, the deprotonation of the Sγ atom (blue line) only begins after the Cβ-Sγ distance is 3.8 Å. The deprotonation of the Sγ atom is not initiated while the ligand is at a larger distance. Once the Sγ atom is deprotonated, a hydronium cation hovers in the vicinity of the acrylamide warhead (state 2 in Figure 8). This shows that the deprotonation of the cysteine is an integral part of the reaction that occurs in the presence of the ligand rather than an event that takes place independently. Consistent with this observation, Awoonor-Williams and Rowley showed that the noncovalent binding free energy of an ibrutinib-like inhibitor of BTK with a t-butyl cyanoacrylamide warhead varied from −7.4 kcal/mol for the neutral (protonated) cysteine to −11.4 kcal/mol for the deprotonated thiolate form.12 The difference in the calculated noncovalent binding free energy is indicative of the coupling between the deprotonation of Cys481 and the presence of the ligand, suggesting that this step must be treated as part of the full chemical reaction pathway. This suggests that quantifying the pKa of the cysteine side chains, albeit useful for characterizing the accuracy of the computational models, may be of limited significance in predicting the selectivity of covalent kinase inhibitors.27
Figure 8:

Results from the optimized string for the direct pathway. (top) Evolution of the CVs (in Å) and associated PMF (in kcal/mol) along the optimized string. The four metastable states along the reaction corresponding to local free energy minima are indicated in the PMF. (bottom) Typical configurations corresponding to the four metastable states along the reaction: state 1: the associated ibrutinib in the binding pocket with an interatomic distance between the Cβ atom (sienna) of the warhead and the Sγ atom (yellow) of Cys481 of 3.7 Å); state 2: thiolate intermediate after deprotonation of the Sγ-Cys481 atom; state 3: enolate intermediate after formation of the the Sγ-Cβ covalent bond, state 4: completed reaction after the Cα protonation occurred. Results from the optimized string for the indirect pathway are shown in Supporting Figure S8.
The product state of the initial deprotonation of Sγ coincides with the shortening of the Cβ-Sγ distance (green line), leading progressively to the formation of the covalent bond. The formation of the Cβ-Sγ covalent bond appears to trigger the protonation of the Cα atom (red line). Figure 8 (central panel) shows the free energy profile calculated along the optimized string. The local free energy wells can be directly related to the main states along the reaction pathway, the unlinked-associated drug (state 1), the thiolate intermediate with the deprotonated Sγ atom of the Cys481 residue (state 2), the anionic enolate intermediate with covalently bound ibrutinib (state 3), and the final product with protonated-Cα (state 4).
Consistent with the Michael addition reaction (Figure 2), the pathway from the string shown in Figure 8 displays four distinct states with three chemical steps. Based on the PMF shown in Figure 8, the relative stability of the metastable intermediate states along the reaction pathway is roughly similar until the final product, which is considerably more stable. It is unclear how this aspect of the results may be affected by the accuracy of the QM method, as well as the reliance on the one-dimensional reaction pathway (string) in the subspace of the CVs. In a cleverly designed strategy, Awoonor-Williams and Rowley determined the thermodynamic stability of all metastable intermediate states of an ibrutinib-like covalent inhibitor of BTK with a t-butyl cyanoacrylamide warhead using a combination of QM/MM simulations together with an alchemical free energy method.12 Although an alchemical free energy method is not designed to map out an optimal pathway along a multi-step reaction, it could be used to rigorously address issues of thermodynamic stability for all well-identified intermediate chemical states.
To gain further insight into the mechanism of covalent inhibition, we estimate the transition rate from all the steps displayed in Figure 8. For the sake of simplicity, the transition rate from the reactant (r) to the product (p) for each of these steps is approximated within the framework of classical transition state theory (TST),73,74
| (3) |
where the reaction coordinate s is the arc length along the string, and s† is the transition state between the reactant “r” and the product “p”. The quantity represents the average forward velocity of the CVs projected along the string. The transition rate can be expressed as, , where ΔW† = W(s†) – W(sr) is the activation free energy, sr represents the position of the minimum in the reactant well, and ds, is the effective length of the reactant well “r”.
The results are summarized in Table 1. The average forward velocity of the CVs projected along the string for the Cα-Sγ bond reaction (2–3 and 3–2 transitions) is 2.27. Å·ps−1, matching closely the value from Maxwell’s distribution for the carbon-sulfur reduced mass, (kBT(mc + ms)/(2π(mcms))1/2 = 2.14 Å·ps−1. The average forward velocity of the CVs projected along the string for the proton transfer reactions (1–2, 2–1, 3–4, and 4–3 transitions) is on the order of 8.70 Å·ps−1, slightly larger than the value from Maxwell’s distribution for a single proton, (kBT/(2πmH))1/2 = 6.31 Å·ps−1 (using the reduced mass does not change this value significantly). Because TST ignores recrossings and assumes a transmission coefficient of 1, the transition rate estimates are upper bounds.74,75 Thus, the approximate values in Table 1 are expected to be overestimated. However, the limited accuracy of the semi-empirical QM method used is likely to be of greater importance.12,55,76
One important value from Table 1 is the transition rate from the final product to the enolate intermediate (k43), which is extremely slow (1.41×10⁻⁶ s−1). Essentially, the covalent inhibition is irreversible according to the calculations. The string reaction pathway displays a direct and highly concerted proton transfer from the Sγ atom of Cys481 to the Cα atom of ibrutinib. In principle, this process is possible, as long as an excess proton remains present inside the kinase binding pocket in the vicinity of the inhibitor. While the attractive electrostatic interactions between the excess proton and the anionic enolate intermediate oppose the dissociation of the excess proton from the binding pocket, the latter should ultimately be able to escape and diffuse into the bulk solvent. The absence of an excess proton in the binding pocket could then give rise to a long-lived enolate intermediate state, as the system must wait for a new proton coming from the bulk solution to complete the reaction. A picture of metastable state 2 in Supporting Figure S8 hints at the diffusion of a solvated proton away from the binding pocket. However, in the context of the QM/MM simulation, dissociation cannot occur because the excess proton is artificially held captive by the finite number of water molecules in the QM region. To characterize the escape process, the PMF of a hydronium cation was calculated as a function of its distance to the ligand using MD simulations based on a classical MM force field with the enhanced sampling algorithm WTM-eABF.59,60 The calculated PMF is shown in Figure 9. Based on the PMF, the proton escaping from the binding pocket encounters a free energy barrier of about 3.6 kcal/mol. The escape rate of the hydronium cation from the binding pocket to the bulk solution (Figure 9) can be estimated in the high friction diffusive limit from the Kramers-Smoluchowski theory,77,78
| (4) |
where D is the H+ diffusivity, r† is the transition state (5.3 Å), W′′(rb) is the second derivative in the reactant well, W′′(r†) is the second derivative at the transition state, and ΔW† is the activation free energy. Using the H+ diffusivity of 0.93 Å2/ps in bulk water79 yields an escape rate of about 2.2 × 10⁹ s−1. Assuming that the association rate of a solvated proton with the binding pocket is diffusion-limited, yields a rate on the order of 4.02 × 10² s−1 at a physiological pH of 7.4.
Figure 9:

PMF for a hydronium cation escaping from the binding pocket into the bulk solvent, leaving a negatively charged enolate intermediate.
The present results can be compared with a previous QM/MM computational study on covalent inhibition of BTK by ibrutinib based on the density-functional tight-binding (DFTB3) method.25 Partial free energy surfaces were generated from umbrella sampling QM/MM simulations to determine the reaction pathway, leading to the conclusion that the mechanism for the deprotonation of Cys481 involved a direct proton transfer to the carbonyl oxygen atom of ibrutinib, resulting in a Cys-[Sγ/C]OH+ ion pair.25 This led to the proposal that the formation of the Cβ–Sγ bond leads to an enol complex and subsequently by a solventassisted keto–enol tautomerization step to form the covalent keto product.25 This conclusion stands in contrast with the present results, where the proton leaving the sulfur atom of Cys481 is immediately captured by nearby water molecules in the binding pocket, and the subsequent protonation of the Cα comes also from the solvent. An important factor that may be responsible for the considerable difference in the proposed mechanisms is the selection of the atoms treated as part of the QM region. The previous study included all of the ibrutinib molecule and the side chain of Cys481 but only a single water molecule hydrogen bonded to the carbonyl oxygen of the acrylamide as part of the QM region.25 In the present study, the QM region included the ibrutinib acrylamide warhead and its neighboring pyrrolopyrimidine group, the entire Cys481 residue together with the backbone atoms of Gly480 and Leu482, and also 16 water molecules (within 3.6 Å from the center of the reaction). These water molecules represented at the QM level are critical for the protonation and deprotonation steps observed along the reaction pathway determined from the string method.
Kinetic implications
The quantitative results from the string method based on QM/MM simulations reported in Figure 8 and Table 1 provide considerable insight into the reaction pathway. Nonetheless, it is difficult to appreciate how these results relate to experimental observations. From this point of view, it is important to try putting the present results in a broader context regarding the time course of covalent inhibition of BTK by ibrutinib. The information gained from the classical MD simulations of the associated and unlinked inhibitor, and the string reaction pathway from QM/MM simulations allow us to go beyond the generic picture that was shown in Scheme 1 in representing the covalent inhibition process in some detail.
To make progress, we represent the overall time-course of inhibition with the more elaborate Scheme 2, encompassing the microscopic steps of Michael addition suggested from the calculations. The simple association of the ligand to the kinase active site is a reversible process that is similar for non-covalent as well as covalent inhibitors. While the ibrutinib-BTK non-covalent dissociation constant, Kd (i.e. Ki), could be calculated using free energy simulations with some efforts,12,80 this is unlikely to significantly affect the main conclusions. For the purpose of our numerical simulations of the kinetic model, a Kd of 1 nM was chosen, broadly consistent with available experimental ibrutinib data, reporting values of 10,81 1.9,82 and 0.64 nM.83 A residence time τm of 15 minutes was assumed, which is a reasonable estimate compared to similar ligands. Once associated with the binding pocket, the non-covalently bonded ligand undergoes dynamic fluctuations. According to the classical MD simulation of the unlinked-associated inhibitor, about 5% of the configurations yield a warhead that is favorably positioned to allow the subsequent chemical reactions to proceed (although this number may require further attention). The rate of exchange between the loosely-associated and well-positioned ligand, E•••I ⇋ E••I, is very fast, and only the relative population of the two states matters (Figure 6). This is represented in Scheme 2 by a μs-timescale rate constant, kconf, scaled by the equilibrium probability of each conformation.
Scheme 2.

The process of covalent inhibition of BTK by ibrutinib was simulated within the framework of Scheme 2 by solving the ordinary differential equations (ODEs) numerically with the transition rate constants estimated above. The results are illustrated in Figure 10. In the initial phase, the population of the state E•••I, corresponding to the unlinked ligand loosely associated with the binding pocket, transiently rises and then decays over time. The population of the state E••I, corresponding to the unlinked ligand with the warhead positioned favorably, also peaks with the state E•••I but always remains smaller (roughly 5% of the combined population of the two unlinked states). The observed rate constant, kobs, is obtained by fitting a generic growth factor, to the time-dependent occupancy of the covalently-bound state, E–I.84,85
Figure 10:

Numerical simulation of Scheme 2. (top) Time course of the different states when [I] = 1.72 ×10³ nM ≈ KI and [E] = 1 nM. The observed rate constant of [E–I], kobs, was 0.90 s−1. Because it is assumed that [I] >> [E], the inhibitor concentration remains essentially constant with time. (bottom) The variation of kobs over [I] (black solid), the two-step curve kobs = kinact[I]/(KI +[I]) (red dashed), and the one-step line kobs = Ceff[I] (dark-gray dashed). Fitting the two-step curve yielded KI ≈ 1.72 × 10³ nM, kinact ≈ 1.8 s−1, and Ceff ≈ 1.04 × 10⁻³ nM−1s−1.
Figure 10 (top) exemplifies a lag phase in covalent occupancy due to intermediate steps that are quick to equilibrate yet heavily in favor of non-progressive states. This affects the quality of the fitted Occcov(t), and it may go unnoticed in experiments due to lower temporal and state resolution. For systems designed to accumulate in an intermediate state, this deviation may significantly hinder the drug’s evaluation. For example, a well-performing warhead may be overlooked if the same drug has a much higher propensity to exist in an unfavorable conformation compared to its inverse. Despite the deviations, this analysis remains useful for interpreting the rate constants reported herein through an experimental lens.
The variation of kobs as a function inhibitor concentration, [I], is then fit to kobs = kinact[I]/(KI + [I]) for the inhibition constant, KI, and the inactivation rate constant, kinact (Figure 10, bottom). A reaction may appear one-step in both non-saturating ([I]<< KI) and saturating ([I]>> KI) conditions. These linear approximations are distinguishable by the Y-intercept, where an intercept of 0 yields a slope equivalent to the covalent efficiency, Ceff = kinact/KI. The latter is often sufficient for evaluating covalent inhibitor potency, especially in preliminary screenings where practical challenges for resolving kinact and KI are not justified.2
The simulations of the kinetic model yield an estimated covalent efficiency, Ceff, of 1.04 × 10⁻³ nM−1s−1, an apparent inhibition constant, KI, of 1.72 × 10³ nM, and an apparent inactivation rate constant, kinact, of 1.8 s−1. While the magnitude of Ceff from the present computations is in good agreement with the data reported in Table 2, the inactivation rate constant is, depending on the reference, overestimated by a factor of 20,86 67,87 163,88 or 98389 (the latter appears to be an outlier and will be omitted from the following discussion).
Table 2:
Experimental estimates of kinetic parameters of BTK inhibition by ibrutinib
A number of factors could be at the origin of the overestimated inactivation rate constant, kinact. In particular, the approximate TST transition rates from Table 1 assume a transmission coefficient of 1 and are expected to be overestimated.74 Nonetheless, a survey of computed transmission coefficients in enzymatic reactions indicates that they vary between 0.36 and 0.99, suggesting that these effects are relatively modest.75 More importantly, we used a population of 5% for the conformation in which the warhead is positioned favorably to allow the chemistry to proceed based on the analysis of the 6.6 μs classical MD simulation of the unlinked inhibitor associated with the kinase binding pocket. However, as this simulation was started from the coordinates of the crystallographic structure of ibrutinib covalently linked to BTK, it is quite possible that the population of conformations with a favorably positioned warhead was overestimated. Although the dynamics of the unlinked ligand has no bearing on the subsequent chemical reactions described by the QM/MM simulations, the population of conformations with a favorably positioned warhead has a direct impact on the apparent inactivation rate. For instance, the discrepancy with the experimental rate of inactivation is immediately reduced by a factor of 5 if we assume a population of 1%, showing that the apparent inactivation rates can be altered by modulating the conformational dynamics of the unlinked ligand associated with the kinase active site. Finally, a likely factor for the disagreement with experimental data is the height of free energy barriers for the chemical steps determined from the semi-empirical QM method. The free energy barriers bear also some statistical uncertainty due to the finite sampling (Table 1). With a population of conformations with a favorably positioned warhead of 5%, the experimental inactivation rate is matched exactly if one assumes a uniform increase of 1.8–3.0 kcal/mol for all the free energy barriers given in Table 1, but this is reduced to 0.8–2.1 kcal/mol if one assumes a population of 1% (excluding the results from ref 89). Even though the overall accuracy of the free energy barriers deserves further attention, which specific step may be the most inaccurate is not immediately clear. For example, even though the initial deprotonation of Cys481 is the slowest step along the present pathway, experimental exchange-rate studies have shown that the equilibrium between the protonated and deprotonated states of solvent-exposed cysteine side chains is fast.91–93 Moreover, a similarly small free energy barrier for the chemical reaction leading to the formation of the enolate intermediate complex was obtained using umbrella sampling QM/MM simulations in the case of a t-butyl cyanoacrylamide warhead ligand.12
It is noteworthy that, according to the simulation of the kinetic model, about 82% of covalent inhibition results from reaction steps following the direct pathway, without escape of the excess proton to the bulk solution. Because the bimolecular association rate of a proton within the binding pocket depends on the [H+] concentration, this suggests the possibility of a long-lived enolate intermediate state at high pH. The existence of direct and indirect routes leading to covalent inhibition, with the excess proton either remaining within the binding site or escaping to the bulk, represents an intriguing departure from the expected mechanism for a Michael addition in solution. Although of a different character, a direct proton transfer mechanism was also proposed in the QM/MM simulation study of Mulholland and co-workers.25 Even though computational studies are burdened by a number of approximations, the concept of a direct proton transfer pathway leading to covalent inhibition within the confine of the kinase binding pocket should be considered carefully.
Lastly, it is worth pointing out that Scheme 2 assumes that the initial diffusive encounter and non-covalent association of ibrutinib with the kinase occurs with a protonated Cys481. Because of the elevated pKa of 7.7, this is the most likely scenario, as the equilibrium population distribution of the thiol and thiolate are about 0.67 and 0.33, respectively. It is possible to expand the kinetic scheme to account for a scenario in the initial encounter involves the thiolate form (see Scheme S1 in Supporting Information). Solving the ODEs numerically while accounting for this expanded scenario (Supporting Figure S9) and integrating the net flux for the thiolate−enolate transitions, Φ(t) = P(t.)(t)k23 − P(e.)(t)k32, over the time course of the reaction shows that these ratios remain and that the dominant reaction pathway involves an encounter with the thiol form to about 67%, and 33% with the thiolate form. The overall kinetic behavior of the model with respect to the final state, E–I, is not greatly affected when including the encounter with the thiolate form. The covalent efficiency Ceff, is 1.01 × 10⁻³ nM−1s−1, the apparent inhibition constant, KI, is 2.83 × 10³ nM, and the apparent inactivation rate constant, kinact, is 2.86 s−1. The kinetic behavior of the total occupancy is identical between the two mechanistic reaction schemes. The two possible reaction pathways are compared via a schematic free energy diagram of all the states and transitions in Supporting Figure S10. This analysis shows that the dominant reaction pathway corresponds to the encounter and non-covalent association with the thiol form of Cys481.
CONCLUSION
A computational approach was used to study the mechanism of covalent inhibition of BTK by ibrutinib. MD simulations based on classical force field indicate that the unlinked inhibitor associated with the kinase binding pocket undergoes considerable fluctuations and that only a small fraction of configurations position the ligand favorably to permit the initial chemical steps toward covalent inhibition. The complete reaction pathway leading to the formation of the covalent bond of the ibrutinib acrylamide warhead with Cys481 via a Michael addition was determined with the string method in collective variables on the basis of QM/MM simulations. The string pathway shows that there is a strong correlation between the covalent bond formation and the protonation/deprotonation events taking place sequentially in the covalent inhibition reaction in a sequence of 3 steps. Two possible mechanisms could affect the deprotonation/protonation events from the thiolate to the enolate intermediate: a highly correlated direct pathway involving one or a few water molecules, and a more indirect pathway involving the escape of H+ to the bulk. The possibility of a direct proton transfer pathway leading to covalent inhibition within the confine of the kinase binding pocket represents an intriguing departure from the expected mechanism for a Michael addition in bulk solution. About 82% of covalent inhibition results from reaction steps following the direct pathway, without escape of the excess proton from the binding pocket to the bulk solution, suggesting the possibility of a long-lived enolate intermediate state at high pH. Although the calculated apparent inactivation rate is faster than the value reported from experiment,87 the discrepancy is strongly affected by the fluctuations of the unlinked ligand associated with the kinase binding pocket and the probability that the warhead is positioned favorably to allow the chemistry to proceed. The experimental inactivation rate is matched exactly if one assumes a relatively modest uniform increase of 1.8–3.0 kcal/mol or 0.8–2.1 kcal/mol if a population of conformations with a favorably positioned warhead of 5% or 1% is assumed, respectively.
Ultimately, to achieve a quantitative description of covalent inhibition, the present exercise will have to be repeated with more extensive sampling from longer simulations along the optimized path collective variables94 using QM methods of higher accuracy,95,96 more sophisticated treatments of the system’s conformational dynamics,97–99 and of the transition kinetics.74–76,100,101 Despite its limitations, it is hoped that the present effort provides a useful overview of the different microscopic factors affecting the mechanism of covalent inhibition.
Supplementary Material
Acknowledgements
This work was supported by the National Institutes of Health (NIH) through grant R01 CA093577. This work used Frontera at the Texas Advanced Computing Center through allocation MCA01S018 from the Extreme Science and Engineering Discovery Environment (XSEDE) now called ACCESS, which was supported by National Science Foundation grant number 1548562, and the Beagle3 GPU cluster funded by NIH via grant 1S10OD028655. The authors are grateful to Raymond Moellering, Trayder Thomas, Chris Rowley, Joseph Piccirilli, and Nir London for helpful discussions.
Footnotes
Supporting Information Available
The Supporting Information file includes root-mean-square deviations of ibrutinib in the binding pocket (Supporting Figure S1), dihedral fluctuations of Cys481 (Supporting Figure S2), 2D-PMF the unlinked inhibitor associated with the kinase (Supporting Figure S3), main conformations observed during the classical MD (Supporting Figure S4), all pathways generated from SMD trajectories (Supporting Figures S5 S6), indirect and direct pathway (Supporting Figure S7), information about the indirect pathway (Supporting Figure S8), and information about the expanded kinetic scheme with an unbound thiolate (Supporting Scheme S1 and Supporting Figures S9 S10).
Data and Software Availability
The topology and parameter files generated in CHARMM format by CGENFF are given at https://github.com/RouxLab/ibrutinib. Additional information is provided in a supporting information document.
References
- (1).Singh J; Petter RC; Baillie TA; Whitty A The Resurgence of Covalent Drugs. Nat Rev Drug Discov 2011, 10, 307–317. [DOI] [PubMed] [Google Scholar]
- (2).Bauer RA Covalent Inhibitors in Drug Discovery: From Accidental Discoveries to Avoided Liabilities and Designed Therapies. Drug Discov Today 2015, 20, 1061–1073. [DOI] [PubMed] [Google Scholar]
- (3).Boike L; Henning NJ; Nomura DK Advances in Covalent Drug Discovery. Nat Rev Drug Discov 2022, 21, 881–898. [DOI] [PMC free article] [PubMed] [Google Scholar]
- (4).Tuley A; Fast W The Taxonomy of Covalent Inhibitors. Biochemistry 2018, 57, 3326–3337. [DOI] [PMC free article] [PubMed] [Google Scholar]
- (5).Fradera X; Kaur J; Mestres J Unsupervised Guided Docking of Covalently Bound Ligands. J Comput Aided Mol Des 2004, 18, 635–650. [DOI] [PubMed] [Google Scholar]
- (6).London N; Miller RM; Krishnan S; Uchida K; Irwin JJ; Eidam O; Gibold L; č P; Bonnet R; Shoichet BK; Taunton J Covalent Docking of Large Libraries for the Discovery of Chemical Probes. Nat Chem Biol 2014, 10, 1066–1072. [DOI] [PMC free article] [PubMed] [Google Scholar]
- (7).Zhu K; Borrelli KW; Greenwood JR; Day T; Abel R; Farid RS; Harder E Docking Covalent Inhibitors: A Parameter Free Approach to Pose Prediction and Scoring. J Chem Inf Model 2014, 54, 1932–1940. [DOI] [PubMed] [Google Scholar]
- (8).Toledo Warshaviak D; Golan G; Borrelli KW; Zhu K; Kalid O Structure-Based Virtual Screening Approach for Discovery of Covalently Bound Ligands. J Chem Inf Model 2014, 54, 1941–1950. [DOI] [PubMed] [Google Scholar]
- (9).Scholz C; Knorr S; Hamacher K; Schmidt B DOCKTITE-a Highly Versatile Step-by-Step Workflow for Covalent Docking and Virtual Screening in the Molecular Operating Environment. J Chem Inf Model 2015, 55, 398–406. [DOI] [PubMed] [Google Scholar]
- (10).Bianco G; Forli S; Goodsell DS; Olson AJ Covalent Docking Using Autodock: Two-Point Attractor and Flexible Side Chain Methods. Protein Sci 2016, 25, 295–301. [DOI] [PMC free article] [PubMed] [Google Scholar]
- (11).Moitessier N; Pottel J; Therrien E; Englebienne P; Liu Z; Tomberg A; Corbeil CR Medicinal Chemistry Projects Requiring Imaginative Structure-Based Drug Design Methods. Acc Chem Res 2016, 49, 1646–1657. [DOI] [PubMed] [Google Scholar]
- (12).Awoonor-Williams E; Rowley CN Modeling the Binding and Conformational Energetics of a Targeted Covalent Inhibitor to Bruton’s Tyrosine Kinase. J. Chem. Inf. Model 2021, 61, 5234–5242. [DOI] [PubMed] [Google Scholar]
- (13).Hasan MN; Ray M; Saha A Tools for Modeling Covalent Modification of Proteins: A Review on Computational Covalent Drug Discovery. J Phys Chem B 2023, 127, 9663–9684. [DOI] [PubMed] [Google Scholar]
- (14).Kitz R; Wilson IB Esters of Methanesulfonic Acid as Irreversible Inhibitors of Acetylcholinesterase. j Biol Chem 1962, 237, 3245–3249. [PubMed] [Google Scholar]
- (15).Pan Z; Scheerens H; Li S-J; Schultz BE; Sprengeler A, Paul; Burrill LC; Mendonca RV; Sweeney MD; Scott KCK; Grothaus PG; Jeffery DA; Spoerke JM; Honigberg LA; Young PR; Dalrymple SA; Palmer JT Discovery of Selective Irreversible Inhibitors for Bruton’s Tyrosine Kinase. ChemMedChem 2007, 2, 58–61. [DOI] [PubMed] [Google Scholar]
- (16).Honigberg LA; Smith AM; Sirisawad M; Verner E; Loury D; Chang B; Li S; Pan Z; Thamm DH; Miller RA; Buggy JJ The Bruton Tyrosine Kinase Inhibitor PCI-32765 Blocks B-cell Activation and Is Efficacious in Models of Autoimmune Disease and B-cell Malignancy. Proc. Natl. Acad. Sci. U.S.A 2010, 107, 13075–13080. [DOI] [PMC free article] [PubMed] [Google Scholar]
- (17).Dubovsky JA; Beckwith KA; Natarajan G; Woyach JA; Jaglowski S; Zhong Y; Hessler JD; Liu TM; Chang BY; Larkin KM; Stefanovski MR; Chappell DL; Frissora FW; Smith LL; Smucker KA; Flynn JM; Jones JA; Andritsos LA; Maddocks K; Lehman AM; Furman R; Sharman J; Mishra A; Caligiuri MA; Satoskar AR; Buggy JJ; Muthusamy N; Johnson AJ; Byrd JC Ibrutinib Is an Irreversible Molecular Inhibitor of ITK Driving a Th1-Selective Pressure in T Lymphocytes. Blood 2013, 122, 2539–2549. [DOI] [PMC free article] [PubMed] [Google Scholar]
- (18).Advani RH; Buggy JJ; Sharman JP; Smith SM; Boyd TE; Grant B; Kolibaba KS; Furman RR; Rodriguez S; Chang BY; Sukbuntherng J; Izumi R; Hamdy A; Hedrick E; Fowler NH Bruton Tyrosine Kinase Inhibitor Ibrutinib (PCI-32765) Has Significant Activity in Patients With Relapsed/Refractory B-cell Malignancies. J Clin Oncol 2013, 31, 88–94. [DOI] [PMC free article] [PubMed] [Google Scholar]
- (19).Pal Singh S; Dammeijer F; Hendriks RW Role of Bruton’s Tyrosine Kinase in B Cells and Malignancies. Mol. Cancer 2018, 17, 1–23. [DOI] [PMC free article] [PubMed] [Google Scholar]
- (20).Barf T; Kaptein A Irreversible Protein Kinase Inhibitors: Balancing the Benefits and Risks. J. Med. Chem 2012, 55, 6243–6262. [DOI] [PubMed] [Google Scholar]
- (21).Blair JA; Rauh D; Kung C; Yun CH; Fan QW; Rode H; Zhang C; Eck MJ; Weiss WA; Shokat KM Structure-Guided Development of Affinity Probes for Tyrosine Kinases Using Chemical Genetics. Nat Chem Biol 2007, 3, 229–238. [DOI] [PubMed] [Google Scholar]
- (22).Warshel A; Levitt M Theoretical Studies of Enzymic Reactions - Dielectric, Electrostatic and Steric Stabilization of Carbonium-Ion in Reaction of Lysozyme. J. Mol. Biol 1976, 103, 227–249. [DOI] [PubMed] [Google Scholar]
- (23).Field MJ; Bash PA; Karplus M A Combined Quantum Mechanical and Molecular Mechanical Potential for Molecular Dynamics Simulations. J. Comp. Chem 1990, 11, 700–733. [Google Scholar]
- (24).Melo MCR; Bernardi RC; Rudack T; Scheurer M; Riplinger C; Phillips JC; Maia JDC; Rocha GB; Ribeiro JV; Stone JE; Neese F; Schulten K; Luthey-Schulten Z NAMD Goes Quantum: An Integrative Suite for Hybrid Simulations. Nat. Methods 2018, 15, 351–354. [DOI] [PMC free article] [PubMed] [Google Scholar]
- (25).Voice AT; Tresadern G; Twidale RM; van Vlijmen H; Mulholland AJ Mechanism of Covalent Binding of Ibrutinib to Bruton’s Tyrosine Kinase Revealed by QM/MM Calculations. Chem. Sci 2021, 12, 5511–5516. [DOI] [PMC free article] [PubMed] [Google Scholar]
- (26).Johansson MH Reversible Michael Additions: Covalent Inhibitors and Prodrugs. Mini Rev Med Chem 2012, 12, 1330–1344. [DOI] [PubMed] [Google Scholar]
- (27).Smith JM; Rowley CN Automated Computational Screening of the Thiol Reactivity of Substituted Alkenes. J Comput Aided Mol Des 2015, 29, 725–735. [DOI] [PubMed] [Google Scholar]
- (28).E W; Ren W; Vanden-Eijnden E String Method for the Study of Rare Events. Phys. Rev. B 2002, 66, 052301. [DOI] [PubMed] [Google Scholar]
- (29).E W; Ren W; Vanden-Eijnden E Finite Temperature String Method for the Study of Rare Events. j. Phys. Chem. B 2005, 109, 6688–6693. [DOI] [PubMed] [Google Scholar]
- (30).Maragliano L; Fischer A; Vanden-Eijnden E; Ciccotti G String Method in Collective Variables: Minimum Free Energy Paths and Isocommittor Surfaces. J. Chem. Phys 2006, 125, 24106. [DOI] [PubMed] [Google Scholar]
- (31).E W; Ren W; Vanden-Eijnden E Simplified and Improved String Method for Computing the Minimum Energy Paths in Barrier-Crossing Events. J. Chem. Phys 2007, 126, 164103. [DOI] [PubMed] [Google Scholar]
- (32).Pan A; Sezer D; Roux B Finding Transition Pathways Using the String Method With Swarms of Trajectories. J. Phys. Chem. B 2008, 112, 3432–3440. [DOI] [PMC free article] [PubMed] [Google Scholar]
- (33).Zhu F; Hummer G Pore Opening and Closing of a Pentameric Ligand-Gated Ion Channel. Proc Natl Acad Sci U S A 2010, 107, 19814–19819. [DOI] [PMC free article] [PubMed] [Google Scholar]
- (34).Bender AT; Gardberg A; Pereira A; Johnson T; Wu Y; Grenningloh R; Head J; Morandi F; Haselmayer P; Liu-Bujalski L Ability of Bruton’s Tyrosine Kinase Inhibitors to Sequester Y551 and Prevent Phosphorylation Determines Potency for Inhibition of Fc Receptor but Not B-Cell Receptor Signaling. Mol Pharmacol 2017, 91, 208–219. [DOI] [PubMed] [Google Scholar]
- (35).Marcotte DJ; Liu YT; Arduini RM; Hession CA; Miatkowski K; Wildes CP; Cullen PF; Hong V; Hopkins BT; Mertsching E; Jenkins TJ; Romanowski MJ; Baker DP; Silvian LF Structures of Human Bruton’s Tyrosine Kinase in Active and Inactive Conformations Suggest a Mechanism of Activation for TEC Family Kinases. Protein Sci. 2010, 19, 429–439. [DOI] [PMC free article] [PubMed] [Google Scholar]
- (36).Jo S; Kim T; Iyer VG; Im W CHARMM-GUI: A Web-Based Graphical User Interface for CHARMM. J Comput Chem 2008, 29, 1859–1865. [DOI] [PubMed] [Google Scholar]
- (37).Lee J; Cheng X; Swails JM; Yeom MS; Eastman PK; Lemkul JA; Wei S; Buckner J; Jeong JC; Qi Y; Jo S; Pande VS; Case DA; Brooks CL; MacKerell AD; Klauda JB; Im W CHARMM-GUI Input Generator for NAMD, GROMACS, AMBER, OpenMM, and CHARMM/OpenMM Simulations Using the CHARMM36 Additive Force Field. Journal of Chemical Theory and Computation 2016, 12, 405–413. [DOI] [PMC free article] [PubMed] [Google Scholar]
- (38).Kim S; Lee J; Jo S; Brooks III CL; Lee HS; Im W CHARMM-GUI Ligand Reader and Modeler for CHARMM Force Field Generation of Small Molecules. Journal of Computational Chemistry 2017, 38, 1879–1886. [DOI] [PMC free article] [PubMed] [Google Scholar]
- (39).MacKerell AJ; Bashford D; Bellot M; Dunbrack R; Evanseck J; Field M; Fischer S; Gao J; Guo H; Ha S, D. J-M; Kuchnir L; Kuczera K; Lau F; Mattos C; Michnick S; Ngo T; Nguyen D; Prodhom B; Reiher W III; Roux B; Schlenkrich M; Smith J; Stote R; Straub J; Watanabe M; Wiorkiewicz-Kuczera J; Karplus M All-Atom Empirical Potential for Molecular Modeling and Dynamics Studies of Proteins. J. Phys. Chem. B 1998, 102, 3586–3616. [DOI] [PubMed] [Google Scholar]
- (40).Best RB; Zhu X; Shim J; Lopes PE; Mittal J; Feig M; Mackerell AD Optimization of the Additive CHARMM All-Atom Protein Force Field Targeting Improved Sampling of the Backbone Φ, Ψ and Side-Chain χ(1) and χ(2) Dihedral Angles. J Chem Theory Comput 2012, 8, 3257–3273. [DOI] [PMC free article] [PubMed] [Google Scholar]
- (41).Jorgensen WL; Chandrasekhar J; Madura JD; Impey RW; Klein ML Comparison of Simple Potential Functions for Simulating Liquid Water. J. Chem. Phys 1983, 79, 926–935. [Google Scholar]
- (42).Vanommeslaeghe K; Hatcher E; Acharya C; Kundu S; Zhong S; Shim J; Darian E; Guvench O; Lopes P; Vorobyov I; Mackerell AD Jr. CHARMM General Force Field: A Force Field for Drug-Like Molecules Compatible With the CHARMM All-Atom Additive Biological Force Fields. Journal of Computational Chemistry 2010, 31, 671–690. [DOI] [PMC free article] [PubMed] [Google Scholar]
- (43).Vanommeslaeghe K; MacKerell AD Automation of the CHARMM General Force Field (CGenFF) I: Bond Perception and Atom Typing. Journal of Chemical Information and Modeling 2012, 52, 3144–3154. [DOI] [PMC free article] [PubMed] [Google Scholar]
- (44).Vanommeslaeghe K; Raman EP; MacKerell AD Automation of the CHARMM General Force Field (CGenFF) II: Assignment of Bonded Parameters and Partial Atomic Charges. Journal of Chemical Information and Modeling 2012, 52, 3155–3168. [DOI] [PMC free article] [PubMed] [Google Scholar]
- (45).Gotz AW; Williamson MJ; Xu D; Poole D; Le Grand S; Walker RC Routine Microsecond Molecular Dynamics Simulations With AMBER on GPUs. 1. Generalized Born. J Chem Theory Comput 2012, 8, 1542–1555. [DOI] [PMC free article] [PubMed] [Google Scholar]
- (46).Salomon-Ferrer R; tz AW; Poole D; Le Grand S; Walker RC Routine Microsecond Molecular Dynamics Simulations With AMBER on GPUs. 2. Explicit Solvent Particle Mesh Ewald. J Chem Theory Comput 2013, 9, 3878–3888. [DOI] [PubMed] [Google Scholar]
- (47).Le Grand S; Goetz AW; Walker RC SPFP: Speed Without Compromise-a Mixed Precision Model for GPU Accelerated Molecular Dynamics Simulations. Comp.Phys. Comm 2013, 184, 374–380. [Google Scholar]
- (48).Essmann U; Perera L; Berkowitz M; Darden T; Lee H; Pedersen L A Smooth Particle Mesh Ewald Method. J. Chem. Phys 1995, 103, 8577–8593. [Google Scholar]
- (49).Brooks BR; Brooks CL III; Mackerell AD Jr.; Nilsson L; Petrella RJ; Roux B; Won Y; Archontis G; Bartels C; Boresch S; Caflisch A; Caves L; Cui Q; Dinner AR; Feig M; Fischer S; Gao J; Hodoscek M; Im W; Kuczera K; Lazaridis T; Ma J; Ovchinnikov V; Paci E; Pastor RW; Post CB; Pu JZ; Schaefer M; Tidor B; Venable RM; Woodcock HL; Wu X; Yang W; York DM; Karplus M CHARMM: The Biomolecular Simulation Program. J. Comp. Chem 2009, 30, 1545–1614. [DOI] [PMC free article] [PubMed] [Google Scholar]
- (50).Hopkins CW; Le Grand S; Walker RC; Roitberg AE Long-Time-Step Molecular Dynamics Through Hydrogen Mass Repartitioning. J Chem Theory Comput 2015, 11, 1864–1874. [DOI] [PubMed] [Google Scholar]
- (51).Andersen H Rattle: A “Velocity” Version of the Shake Algorithm for Molecular Dynamics Calculations. J. Comp. Chem 1983, 52, 24–34. [Google Scholar]
- (52).Humphrey W; Dalke A; Schulten K VMD: Visual Molecular Dynamics. J Mol Graph 1996, 14, 33–38. [DOI] [PubMed] [Google Scholar]
- (53).Jiang W; Phillips JC; Huang L; Fajer M; Meng Y; Gumbart JC; Luo Y; Schulten K; Roux B Generalized Scalable Multiple Copy Algorithms for Molecular Dynamics Simulations in NAMD. Comput Phys Commun 2014, 185, 908–916. [DOI] [PMC free article] [PubMed] [Google Scholar]
- (54).Phillips JC; Hardy DJ; Maia JDC; Stone JE; Ribeiro JV; Bernardi RC; Buch R; Fiorin G; Hénin J; Jiang W; McGreevy R; Melo MCR; Radak BK; Skeel RD; Singharoy A; Wang Y; Roux B; Aksimentiev A; Luthey-Schulten Z; Kalé LV; Schulten K; Chipot C; Tajkhorshid E Scalable Molecular Dynamics on CPU and GPU Architectures With NAMD. The Journal of Chemical Physics 2020, 153, 044130. [DOI] [PMC free article] [PubMed] [Google Scholar]
- (55).Stewart JJ Optimization of Parameters for Semiempirical Methods VI: More Modifications to the NDDO Approximations and Re-Optimization of Parameters. J Mol Model 2013, 19, 1–32. [DOI] [PMC free article] [PubMed] [Google Scholar]
- (56).Stewart J Special Issue - MOPAC - A Semiempirical Molecular-Orbital Program. J. Comput. Aided Mol. Des 1990, 4, 1–45. [DOI] [PubMed] [Google Scholar]
- (57).Carvalho Maia JD; Urquiza Carvalho GA; Mangueira CP Jr.; Santana SR; Formiga Cabral LA; Rocha GB GPU Linear Algebra Libraries and GPGPU Programming for Accelerating MOPAC Semiempirical Quantum Chemistry Calculations. J. Chem. Theory Comput 2012, 8, 3072–3081. [DOI] [PubMed] [Google Scholar]
- (58).Fiorin G; Klein ML; Henin J Using Collective Variables to Drive Molecular Dynamics Simulations. Mol. Phys 2013, 111, 3345–3362. [Google Scholar]
- (59).Fu H; Shao X; Cai W; Chipot C Taming Rugged Free Energy Landscapes Using an Average Force. Acc. Chem. Res 2019, 52, 3254–3264. [DOI] [PubMed] [Google Scholar]
- (60).Fu H; Chen H; Wang X; Chai H; Shao X; Cai W; Chipot C Finding an Optimal Pathway on a Multidimensional Free-Energy Landscape. J. Chem. Inf. Model 2020, 60, 5366–5374. [DOI] [PubMed] [Google Scholar]
- (61).Darve E; Rodríguez-Gómez D; Pohorille A Adaptive Biasing Force Method for Scalar and Vector Free Energy Calculations. The Journal of Chemical Physics 2008, 128, 144120. [DOI] [PubMed] [Google Scholar]
- (62).Lesage A; Lelièvre T; Stoltz G; Hénin J Smoothed Biasing Forces Yield Unbiased Free Energies With the Extended-System Adaptive Biasing Force Method. J. Phys. Chem. B 2017, 121, 3676–3685. [DOI] [PMC free article] [PubMed] [Google Scholar]
- (63).Fu H; Shao X; Chipot C; Cai W Extended Adaptive Biasing Force Algorithm. An On-the-Fly Implementation for Accurate Free-Energy Calculations. J. Chem. Theory Comput 2016, 12, 3506–3513. [DOI] [PubMed] [Google Scholar]
- (64).Henin J; Fiorin G; Chipot C; Klein ML Exploring Multidimensional Free Energy Landscapes Using Time-Dependent Biases on Collective Variables. Journal of chemical theory and computation 2010, 6, 35–47. [DOI] [PubMed] [Google Scholar]
- (65).Grubmüller H Predicting Slow Structural Transitions in Macromolecular Systems: Conformational Flooding. Phys. Rev. E 1995, 52, 2893–2906. [DOI] [PubMed] [Google Scholar]
- (66).Barducci A; Bussi G; Parrinello M Well-Tempered Metadynamics: A Smoothly Converging and Tunable Free-Energy Method. Phys. Rev. Lett 2008, 100, 020603. [DOI] [PubMed] [Google Scholar]
- (67).Dama JF; Parrinello M; Voth GA Well-Tempered Metadynamics Converges Asymptotically. Phys. Rev. Lett 2014, 112, 240602. [DOI] [PubMed] [Google Scholar]
- (68).Sagnella D; Voth G Structure and Dynamics of Hydronium in the Ion Channel Gramicidin A. Biophys. J 1996, 70, 2043–2051. [DOI] [PMC free article] [PubMed] [Google Scholar]
- (69).Zapf CW; Gerstenberger BS; Xing L; Limburg DC; Anderson DR; Caspers N; Han S; Aulabaugh A; Kurumbail R; Shakya S; Li X; Spaulding V; Czerwinski RM; Seth N; Medley QG Covalent Inhibitors of Interleukin-2 Inducible T Cell Kinase (ITK) With Nanomolar Potency in a Whole-Blood Assay. J Med Chem 2012, 55, 10047–10063. [DOI] [PubMed] [Google Scholar]
- (70).Quaytman SL; Schwartz SD Reaction Coordinate of an Enzymatic Reaction Revealed by Transition Path Sampling. Proc Natl Acad Sci U S A 2007, 104, 12253–12258. [DOI] [PMC free article] [PubMed] [Google Scholar]
- (71).Schwartz SD; Schramm VL Enzymatic Transition States and Dynamic Motion in Barrier Crossing. Nat Chem Biol 2009, 5, 551–558. [DOI] [PMC free article] [PubMed] [Google Scholar]
- (72).Schwartz SD Protein Dynamics and Enzymatic Catalysis. J Phys Chem B 2023, 127, 2649–2660. [DOI] [PMC free article] [PubMed] [Google Scholar]
- (73).Glasstone S; Laidler KJ; Eyring H Theory of Rate Processes; McGraw-Hill: New York, 1941. [Google Scholar]
- (74).Chandler D Statistical Mechanics of Isomerization Dynamics in Liquids and the Transition State Approximation. J. Chem. Phys 1978, 68, 2959–2970. [Google Scholar]
- (75).Pu J; Gao J; Truhlar DG Multidimensional Tunneling, Recrossing, and the Transmission Coefficient for Enzymatic Reactions. Chem Rev 2006, 106, 3140–3169. [DOI] [PMC free article] [PubMed] [Google Scholar]
- (76).Zinovjev K; a JJ; n I Toward an Automatic Determination of Enzymatic Reaction Mechanisms and Their Activation Free Energies. J Chem Theory Comput 2013, 9, 3740–3749. [DOI] [PubMed] [Google Scholar]
- (77).Smoluchowski M Drei Vorträge Über Diffusion, Brownsche Molekularbewegung und Koagulation von Kolloidteilchen. Phys. Z 1916, 17, 557–571. [Google Scholar]
- (78).Kramers HA Brownian Motion in a Field of Force and the Diffusion Model of Chemical Reactions. Physica 1940, 7, 284–304. [Google Scholar]
- (79).Hille B Ionic Channels of Excitable Membranes, 3nd Edition; Sinauer: Sunderland MA, 2001. [Google Scholar]
- (80).Lin YL; Meng Y; Jiang W; Roux B Explaining Why Gleevec Is a Specific and Potent Inhibitor of Abl Kinase. Proc. Natl. Acad. of Sci. USA 2013, 110, 1664–1669. [DOI] [PMC free article] [PubMed] [Google Scholar]
- (81).Klaeger S; Heinzlmeir S; Wilhelm M; Polzer H; Vick B; Koenig PA; Reinecke M; Ruprecht B; Petzoldt S; Meng C; Zecha J; Reiter K; Qiao H; Helm D; Koch H; Schoof M; Canevari G; Casale E; Depaolini SR; Feuchtinger A; Wu Z; Schmidt T; Rueckert L; Becker W; Huenges J; Garz AK; Gohlke BO; Zolg DP; Kayser G; Vooder T; Preissner R; Hahne H; nisson N; Kramer K; tze K; Bassermann F; Schlegl J; Ehrlich HC; Aiche S; Walch A; Greif PA; Schneider S; Felder ER; Ruland J; dard G; Jeremias I; Spiekermann K; Kuster B The Target Landscape of Clinical Kinase Drugs. Science 2017, 358. [DOI] [PMC free article] [PubMed] [Google Scholar]
- (82).Angst D; Gessier F; Janser P; Vulpetti A; lchli R; Beerli C; Littlewood-Evans A; Dawson J; Nuesslein-Hildesheim B; Wieczorek G; Gutmann S; Scheufler C; Hinniger A; Zimmerlin A; Funhoff EG; Pulz R; Cenni B Discovery of LOU064 (Remibrutinib), a Potent and Highly Selective Covalent Inhibitor of Bruton’s Tyrosine Kinase. J Med Chem 2020, 63, 5102–5118. [DOI] [PubMed] [Google Scholar]
- (83).Ma B; Metrick CM; Gu C; Hoemberger M; Bajrami B; Bame E; Huang J; Mingueneau M; Murugan P; Santoro JC; Tang H; Wang T; Hopkins BT Optimization of a Novel Piperazinone Series as Potent Selective Peripheral Covalent BTK Inhibitors. Bioorg Med Chem Lett 2022, 60, 128549. [DOI] [PubMed] [Google Scholar]
- (84).Strelow JM A Perspective on the Kinetics of Covalent and Irreversible Inhibition. SLAS Discovery: Advancing Life Sciences R&D 2017, 22, 3–20. [DOI] [PubMed] [Google Scholar]
- (85).Mons E; Roet S; Kim RQ; Mulder MPC A Comprehensive Guide for Assessing Covalent Inhibition in Enzymatic Assays Illustrated With Kinetic Simulations. Curr Protoc 2022, 2, e419. [DOI] [PubMed] [Google Scholar]
- (86).Watterson SH; Liu Q; Beaudoin Bertrand M; Batt DG; Li L; Pattoli MA; Skala S; Cheng L; Obermeier MT; Moore R; Yang Z; Vickery R; Elzinga PA; Discenza L; D’Arienzo C; Gillooly KM; Taylor TL; Pulicicchio C; Zhang Y; Heimrich E; McIntyre KW; Ruan Q; Westhouse RA; Catlett IM; Zheng N; Chaudhry C; Dai J; Galella MA; Tebben AJ; Pokross M; Li J; Zhao R; Smith D; Rampulla R; Allentoff A; Wallace MA; Mathur A; Salter-Cid L; Macor JE; Carter PH; Fura A; Burke JR; Tino JA Discovery of Branebrutinib (BMS-986195): A Strategy for Identifying a Highly Potent and Selective Covalent Inhibitor Providing Rapid In Vivo Inactivation of Bruton’s Tyrosine Kinase (BTK). J Med Chem 2019, 62, 3228–3250. [DOI] [PubMed] [Google Scholar]
- (87).Kaptein A; de Bruin G; Emmelot-van Hoek M; van de Kar B; de Jong A; Gulrajani M; Demont D; Covey T; Mittag D; Barf T Potency and Selectivity of BTK Inhibitors in Clinical Development for B-Cell Malignancies. Blood 2018, 132, 60th Annual Meeting of the American-Societyof-Hematology (ASH), San Diego, CA, DEC 01–04, 2018. [Google Scholar]
- (88).Hopper M; Gururaja T; Kinoshita T; Dean JP; Hill RJ; Mongan A Relative Selectivity of Covalent Inhibitors Requires Assessment of Inactivation Kinetics and Cellular Occupancy: A Case Study of Ibrutinib and Acalabrutinib. J Pharmacol Exp Ther 2020, 372, 331–338. [DOI] [PubMed] [Google Scholar]
- (89).Liang Q; Chen Y; Yu K; Chen C; Zhang S; Wang A; Wang W; Wu H; Liu X; Wang B; Wang L; Hu Z; Wang W; Ren T; Zhang S; Liu Q; Yun CH; Liu J Discovery of N-(3-(5-((3-acrylamido-4-(morpholine-4-carbonyl)phenyl)amino)-1-methyl-6-oxo-1,6-dihydropyridin-3-yl)-2-methylphenyl)-4-(tert-butyl)benzamide (CHMFL-BTK-01) as a Highly Selective Irreversible Bruton’s Tyrosine Kinase (BTK) Inhibitor. Eur J Med Chem 2017, 131, 107–125. [DOI] [PubMed] [Google Scholar]
- (90).Toenjes ST; Heydari BS; Albright ST; Hazin R; Ortiz MA; Piedrafita FJ; Gustafson JL Controlling Ibrutinib’s Conformations About Its Heterobiaryl Axis to Increase BTK Selectivity. ACS Med Chem Lett 2023, 14, 305–311. [DOI] [PMC free article] [PubMed] [Google Scholar]
- (91).Liepinsh E; Otting G Proton Exchange Rates From Amino Acid Side Chains–Implications for Image Contrast. Magn Reson Med 1996, 35, 30–42. [DOI] [PubMed] [Google Scholar]
- (92).Wallerstein J; Weininger U; Khan MA; Linse S; Akke M Site-Specific Protonation Kinetics of Acidic Side Chains in Proteins Determined by pH-dependent Carboxyl (13)C NMR Relaxation. J Am Chem Soc 2015, 137, 3093–3101. [DOI] [PubMed] [Google Scholar]
- (93).Chen J; Yadav NN; Stait-Gardner T; Gupta A; Price WS; Zheng G Thiol-Water Proton Exchange of Glutathione, Cysteine, and N-acetylcysteine: Implications for CEST MRI. NMR Biomed 2020, 33, e4188. [DOI] [PubMed] [Google Scholar]
- (94).Branduardi D; Gervasio FL; Parrinello M From A to B in Free Energy Space. J. Chem. Phys 2007, 126, 054103. [DOI] [PubMed] [Google Scholar]
- (95).Sattelmeyer KW; Tirado-Rives J; Jorgensen WL Comparison of SCC-DFTB and NDDO-based Semiempirical Molecular Orbital Methods for Organic Molecules. J Phys Chem A 2006, 110, 13551–13559. [DOI] [PubMed] [Google Scholar]
- (96).Mendez-Hernandez DD; Gillmore JG; Montano LA; Gust D; Moore TA; Moore AL; Mujica V Building and Testing Correlations for the Estimation of One-Electron Reduction Potentials of a Diverse Set of Organic Molecules. J Phys Org Chem 2015, 28, 320–328. [Google Scholar]
- (97).Shukla D; Meng Y; Roux B; Pande VS Activation Pathway of SRC Kinase Reveals Intermediate States as Targets for Drug Design. Nat Commun 2014, 5, 3397. [DOI] [PMC free article] [PubMed] [Google Scholar]
- (98).Paul F; Meng Y; Roux B Identification of Druggable Kinase Target Conformations Using Markov Model Metastable States Analysis of Apo Abl. J. Chem. Theory Comput 2020, 16, 1896–1912. [DOI] [PMC free article] [PubMed] [Google Scholar]
- (99).Paul F; Thomas T; Roux B Diversity of Long-Lived Intermediates Along the Binding Pathway of Imatinib to Abl Kinase Revealed by MD Simulations. J Chem Theory Comput 2020, 16, 7852–7865. [DOI] [PMC free article] [PubMed] [Google Scholar]
- (100).Gao J; Ma S; Major DT; Nam K; Pu J; Truhlar DG Mechanisms and Free Energies of Enzymatic Reactions. Chem Rev 2006, 106, 3188–3209. [DOI] [PMC free article] [PubMed] [Google Scholar]
- (101).He Z; Chipot C; Roux B Committor-Consistent Variational String Method. J Phys Chem Lett 2022, 13, 9263–9271. [DOI] [PMC free article] [PubMed] [Google Scholar]
Associated Data
This section collects any data citations, data availability statements, or supplementary materials included in this article.
Supplementary Materials
Data Availability Statement
The topology and parameter files generated in CHARMM format by CGENFF are given at https://github.com/RouxLab/ibrutinib. Additional information is provided in a supporting information document.