Abstract
The tumour suppressor protein p53 has functions in controlling the G1/S and G2/M transitions. Central regulators for progression from G2 to mitosis are B-type cyclins complexed with cdc2 kinase. In mammals two cyclin B proteins are found, cyclin B1 and B2. We show that upon treatment of HepG2 cells with 5-fluorouracil or methotrexate, p53 levels increase while concentrations of cyclin B2 mRNA, measured by RT–PCR with the LightCycler system, are reduced. In DLD-1 colorectal adenocarcinoma cells (DLD-1-tet-off-p53) cyclin B1 and B2 mRNA levels drop after expression of wild-type p53 but not after induction of a DNA binding-deficient mutant of p53. Analysis of the cyclin B2 promoter reveals specific repression of this gene by p53. Transfection of wild-type p53 into SaOS-2 cells shuts off transcription from a cyclin B2 promoter–luciferase construct whereas a p53 mutant protein does not. The cyclin B2 promoter does not contain a consensus p53 binding site. Most of the p53-dependent transcriptional responsiveness resides in its 226 bp core promoter. Taken together with earlier observations on p53-dependent transcription of cyclin B1, our results suggest that one way of regulating G2 arrest may be a reduction in cyclin B levels through p53-dependent transcriptional repression.
INTRODUCTION
The protein p53 is the most important tumour suppressor identified to date. It is mutated in the majority of human tumours, which indicates that its role is important for prevention of malignant transformation (1,2). p53 can influence the cell cycle in several ways. It can cause G1 and G2 growth arrest or apoptosis. The p53 protein plays its part in cell growth regulation and apoptosis induction by engaging in complexes with other proteins or by acting as a transcription factor (1,2). For p53 both function as a transcriptional activator and repressor have been described. Generally, one would expect that genes whose protein products stimulate progression through the cell cycle would be down-regulated by p53. Yet gene expression of inducers of cell cycle arrest or apoptosis should be increased by this tumour suppressor protein (2). The function of p53 as a transcription factor can be modulated by phosphorylation and protein association. Examples are ATM-dependent phosphorylation of p53 at Ser15, regulating the response to DNA damage, and phosphorylation by protein kinases CK2 and Chk2, which are other connectors of p53 with checkpoint controls (3–5). One gene on which p53 acts as an activating transcription factor is bax (6). Induction of bax expression produces a protein with accelerates programmed cell death by counteracting the function of Bcl-2 (7). Another important target for p53-dependent transcriptional activation is the cyclin-dependent kinase inhibitor p21WAF1/CIP1 (8). p53 is thought to exert its function in G1 checkpoint control through p21 (9–11). After induction of transcription of the cell cycle inhibitor by p53, p21 leads to inhibition of cyclin–cdk complexes necessary for the transition from G1 to S phase. However, a function of p21 and p53 in G2 checkpoint control was also observed. It was shown that in colorectal cancer cell lines p53 and p21 are necessary to maintain G2 arrest after γ-irradiation (11). Furthermore, there are some other ways in which p53 can be involved in G2 checkpoint control. In some cell types it has been found that regulation of G2/M progression is contingent upon p53-activated transcription of 14-3-3σ (12). GADD45 transcription is also activated by p53. GADD45 seems to function in controlling the G2/M cell cycle checkpoint induced by ionising but not UV radiation (13). Another notable gene activated by p53 at the transcriptional level is mdm2. The mdm2 protein and its human homologue hdm2 are association partners of p53 and serve to destabilise the tumour suppressor protein (1,2). Regulation by mdm2 is in part based on compartmentalisation through shuttling of this protein between nucleus and cytoplasm (14). p53 function is also connected to the activity of other growth regulatory proteins, like E2F and pRb (1,15,16). These examples illustrate that p53 has many functions. One unexpected finding was its role in DNA repair through its exonuclease activity (17,18). Recently it has been shown that p53-dependent induction of a ribonucleotide reductase is part of the DNA damage checkpoint by causing G2/M arrest and preventing cell death with the help of enzymes required for synthesis of DNA repair precursors (19).
An important class of proteins controlling the cell division cycle are the cyclins. They are the regulatory subunits in complexes with cyclin-dependent kinases (cdk). The appearance of cyclins oscillates during the cell cycle (20). Their synthesis is regulated at the transcriptional level and their degradation is controlled by ubiquitin-mediated proteolysis (21). Cyclins are conserved from yeast to man and are involved in controlling cell cycle checkpoints (22,23). An additional level of regulation is provided by cyclin-dependent kinase inhibitors like p21WAF1/CIP1 (20). A central regulator of progression from G2 to mitosis is cyclin B. Cyclin B associates with the cdc2 protein kinase (cdk1) to form maturation-promoting factor (MPF) (24). The MPF complex is essential for transition from G2 to mitosis. In mammalian cells cyclin B exists in two isoforms, cyclins B1 and B2 (25).
The activity of cyclin B is regulated by its synthesis, mainly at the transcriptional level, and by its degradation (26). These observations imply a direct role of cyclin B synthesis for MPF kinase activity and ultimately transition from G2 into mitosis. Here we show that cyclin B1 and cyclin B2 mRNA levels decrease upon induction of wild-type p53 and that transcription from the cyclin B2 promoter is repressed by p53.
MATERIALS AND METHODS
Plasmids
The human p21 promoter construct, WWP-luc, and the human p53 expression plasmids, pCMV-p53wt and pCMV-p53mut, were generously provided by Bert Vogelstein (27,28). The reporter construct WWP-luc contains 2.4 kb of the human wild-type WAF1 promoter inserted upstream of a firefly luciferase reporter gene. Both of the p53 expression constructs were in a cytomegalovirus (CMV) promoter-driven expression vector. The plasmid pCMV-p53mut encodes a mutant human p53 protein containing two missense mutations, Pro72→Arg and Val143→Ala. The mouse cyclin B2 promoter constructs were derived from the B2-Luci plasmid which contains a firefly luciferase reporter gene in the pGL3-Basic vector. Some of the B2-Luci constructs have been described by us (29). New constructs were prepared by PCR by using the following primers together with the respective antisense oligonucleotides: Mut-930, 5′-CTGATGGGGTAGCCTACGCTCAAGT-3′; Mut-845, 5′-TTTGTTTTGATCGATCATTTTTGTTTTCTGTCTTGTC-3′; Mut-750, 5′-CCGTCATTTGGTAGGTAGTTTCT-3′; Mut-460, 5′-CCCAGAGACCACTTTTAAAGACATATGTC-3′; Mut-305, 5′-GAAAATAACCGGGTGTACAAGGAAACA-3′; CDE-Mut, 5′-CAATAGTGCGTCAGCATTACGGTATTTGAATCGCGGACCGG-3′; CHR-Mut, 5′-CAGCGGCGCGGTATGCATATCGCGGACCGGGCGGTGG-3′. Mutations are given in italics. Cyclin B2 promoter deletion constructs were created by employing the following upstream primers: –684B2, 5′-GGGGTACCGCACATCACACCGTCATTTG-3′; –453B2, 5′-GGGGTACCGAGGAAGTAAGGTCAGAAGTAG-3′; –226B2, 5′-GGGGTACCGCTATGACAAGCAAATACAAGC-3′. The plasmid pRL-null (Promega) contains a cDNA encoding Renilla luciferase. All of the construct DNAs were purified through anion exchange columns (Qiagen) and confirmed by restriction analysis and sequencing.
Cell culture and chemotherapeutics
HepG2, Hep3B and SaOS-2 cells were obtained from DSMZ (Braunschweig, Germany) and cultured in a humidified atmosphere with 5% CO2 at 37°C. HepG2 cells were grown in RPMI 1640 medium (Biochrom) supplemented with 10% foetal calf serum (FCS) (Biochrom). Hep3B cells were maintained in medium containing Minimum Essential Medium with Eagle’s salts (MEM Eagle; Biochrom), 0.1 mM non-essential amino acids and 10% FCS. Cells were treated with chemotherapeutic agents for 24 h at concentrations of 2.5 and 25 µg/ml 5-fluorouracil (5-FU) and 10 and 100 µg/ml methotrexate (MTX). The concentrations of chemotherapeutics were at levels derived from cancer treatment protocols which were employed in previous experiments (30). SaOS-2 cells were cultured in McCoy’s 5A modified medium (Biochrom) supplemented with 15% FCS.
Inducible cell lines D.P53 A2 and 175 A4 were kindly provided by Bert Vogelstein. Both cell lines are derivatives of the colorectal carcinoma cell line DLD-1, which has endogenous mutant p53 alleles (31). They were grown in 10% FCS in McCoy’s 5A modified medium containing 400 µg/ml geneticin (Gibco BRL) and 250 µg/ml hygromycin (Roche). Expression of p53 wt or p53R175H, respectively, is regulated by a modified tetracycline (tet)-regulated gene expression system (tet-off system) (31,32). p53 expression was kept repressed in the presence of 20 ng/ml doxycycline (Sigma) but was induced upon removal of doxycycline from the culture medium. For induction of expression of wild-type or mutant p53, cells were washed three times with phosphate-buffered saline (PBS) and placed in medium lacking doxycycline.
Fluorescence-activated cell sorting (FACS) analysis
Cells were harvested, washed twice in PBS/EDTA (1 mM) and fixed with 75% ethanol in PBS/EDTA for at least 12 h at 4°C. Cells were centrifuged and resuspended in 1 ml PBS/EDTA containing 50 µg/ml RNase A (Sigma). Cells were stained with propidium iodide (Sigma) at a final concentration of 60 µg/ml and filtered through a 35 µm pore size cell strainer (Falcon). Flow cytometry was performed by using a FACSCalibur sorter (Becton Dickinson). A total of 10 000–20 000 cells were analysed with the CELLQuest software (Becton Dickinson).
Transfections and luciferase assays
SaOS-2 cells were transfected by lipofection with Fugene 6 (Roche) according to the manufacturer’s instructions. Transfections were done in triplicate. Exponentially growing cells were plated at a density of 5 × 10⁴/well in 0.5 ml medium in 24-well plates. Cells were cultured overnight before transfection. Unless otherwise indicated, 125 ng of luciferase reporter constructs were co-transfected with 25 ng of constructs expressing wild-type or mutant p53 proteins and 25 ng of Renilla luciferase expression vector (pRL-null; Promega) as an internal control. DNA amount was held constant in all experiments by adjusting with pcDNA3.1/His C (Invitrogen). The quality and quantity of several independent DNA preparations were checked photometrically and visually on agarose gels. The cells were harvested 24 h after transfection by lysis with passive lysis buffer (Promega). Firefly and Renilla luciferase activities were assayed with the Dual Luciferase Assay System (Promega) as suggested by the manufacturer. The firefly luciferase activity was normalised to Renilla luciferase activity to compensate for variability in transfection efficiencies.
Western blot analysis
Cell pellets were lysed in RIPA lysis buffer (33) containing a cocktail of protease inhibitors (Complete; Roche). The protein concentration of each cell lysate was determined with the Bio-Rad protein assay kit (Bio-Rad). Ten micrograms of total protein were separated in a 10% SDS–polyacrylamide gel and transferred to a polyvinylidene difluoride transfer membrane (Hybond-P; Amersham Pharmacia Biotech) according to standard procedures (33). Western blotting using a 1:1000 dilution of the anti-p53 mouse monoclonal antibody DO-1 (Calbiochem) was performed and analysed with an ECL Western blotting analysis system (Amersham Pharmacia Biotech) according to the manufacturer’s instructions.
RNA extraction and LightCycler RT–PCR analysis
Total RNA was extracted from 5 × 10⁶ cells using RNeasy kits (Qiagen) as described by the manufacturer and quantified by optical density. One-step RT–PCR was performed with a LightCycler instrument (Roche) in a total volume of 20 µl containing 50 ng of total RNA, 4 mM MgCl2, 0.5 µM each primer, LightCycler RT–PCR Reaction Mix SYBR Green I (1×) and LightCycler RT–PCR Enzyme Mix (Roche). The protocol consists of four programs: reverse transcription of template RNA, denaturation of the cDNA/RNA hybrid, amplification of cDNA and melting curve analysis for product identification. Reverse transcription was performed at 55°C for 10 min. The denaturation and amplification conditions were 95°C for 30 s followed by up to 34 cycles of PCR. Each cycle of PCR included immediate denaturation at 95°C, 10 s of primer annealing at 55°C and 15 s of extension/synthesis at 72°C. The temperature ramp was 20°C/s, except when heating to 72°C, when it was 2°C/s. At the end of the extension step fluorescence of each sample was measured to allow quantification of the RNA. After amplification a melting curve was obtained by heating at 20°C/s to 95°C, cooling at 20°C/s to 65°C and slowly heating at 0.1°C/s to 95°C with fluorescence data collection at 0.1 °C intervals. The following primers were used for PCR: B1-hum-for, 5′-AAGAGCTTTAAACTTTGGTCTGGG-3′; B1-hum-rev, 5′-CTTTGTAAGTCCTTGATTTACCATG-3′; B2-hum-for, 5′-AAAGTTGGCTCCAAAGGGTCCTT-3′; B2-hum-rev, 5′-GAAACTGGCTGAACCTGTAAAAAT-3′; GAPDH-for, 5′-CAGTCCATGCCATCACTGCC-ACCCAG-3′; GAPDH-rev, 5′-CAGTGTAGCCCAGGATGCCCTTGAG-3′. These primer pairs result in PCR products of 317 (cyclin B1) (34), 351 (cyclin B2; GenBank accession no. AL080146) and 303 bp (GAPDH) (35).
Quantitative analysis of the LightCycler data was performed employing LightCycler analysis software. The data analysis is divided into two parts: specificity control of the amplification reaction using the melting curve program of the LightCycler software, followed by use of the quantification program. The SYBR Green I signal of each sample is plotted versus the number of cycles. Using the LightCycler analysis software background fluorescence is removed by setting a noise band. This fluorescence threshold is used to determine cycle numbers that correlate inversely with the log of the initial template concentration. To this end the log-linear portions of the amplification curves are identified and best fit lines calculated. The crossing points (CP) are the intersections between the best fit lines of the log-linear region and the noise band. These crossing points correlate inversely with the log of the initial template concentration (LightCycler Operator’s Manual, Version 3.0, May 1999, Roche). The CP determined for cyclin B2 mRNA were normalised to those of GAPDH to compensate for variability in RNA amount and for exclusion of general transcriptional effects. We calculated fold reduction (FR) since our experiments yielded a repressive effect: FR = 2(CP1–CP2). Fold induction can be calculated by the same formula by reversing the signs. CP1 indicates the crossing point of an RNA sample from cells treated with chemotherapeutic agents; CP2 indicates the crossing point of an RNA sample originating from untreated cells. The mRNA levels of untreated cells were set at 100%. Remaining mRNA levels after treatment with chemotherapeutics were estimated using calculated fold reductions and given as calculated mRNA% in the figures relative to levels of untreated samples.
RESULTS
Chemotherapeutics reduce expression of cyclin B2 in p53-positive cells
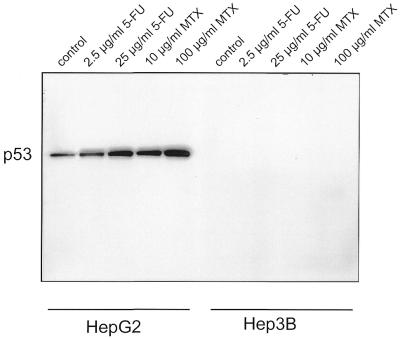
Treatment of cells with chemotherapeutics like 5-FU and MTX has been shown to induce expression of p53 (30,36). The two hepatocellular carcinoma cell lines HepG2 and Hep3B were treated with increasing amounts of the two agents and analysed for expression of p53 protein. In HepG2 cells we find a clear increase in p53 protein over the basal expression level detected in untreated cells after addition of 5-FU or MTX. In both cases protein expression increases further with larger amounts of agent (Fig 1). Hep3B cells serve as negative controls since they lack intact p53 genes (30). In these cells no expression of p53 protein is observed (Fig. 1).
Figure 1.
Increase in p53 protein after treatment with chemotherapeutics. p53-positive HepG2 and p53-negative Hep3B cells were treated with 5-FU or MTX and analysed for p53 expression by western blotting. Untreated cells served as a control. HepG2 and Hep3B cells were treated with 5-FU or MTX, respectively, as indicated.
In p53-positive HepG2 cells we looked at expression of cyclin B2 mRNA. The quantification of low abundance cellular transcripts requires sensitive techniques. With a method to determine mRNA expression employing the LightCycler system we compared mRNA levels in the same samples as in Figure 1. This method is based on the analysis of RT–PCR products. Continuous fluorescence detection of amplifying cDNA allows rapid and accurate quantification of initial transcript amount. A simple and general method for monitoring product synthesis with the double-stranded DNA dye SYBR Green I provides an estimation of initial template amounts and with that comparison of mRNA levels in different samples. cyclin B2 mRNA levels were normalised to GAPDH expression. Results are reported as calculated mRNA%. (For a detailed description of the calculations see Materials and Methods.)
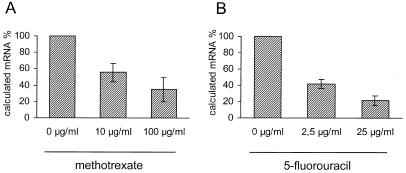
We compared cyclin B2 mRNA levels from untreated HepG2 cells with two concentrations of MTX or 5-FU. In both experiments the expression of cyclin B2 mRNA was clearly down-regulated. The down-regulation appears to be concentration-dependent since higher concentrations of cancer therapeutics lead to lower cyclin B2 mRNA levels (Fig. 2).
Figure 2.
cyclin B2 mRNA levels decrease upon treatment with chemotherapeutics in p53-positive cells. The same samples from HepG2 cells as used in Figure 1 were analysed with the LightCycler system for their change in cyclin B2 mRNA concentration. Expression levels were normalised to GAPDH mRNA levels. For a detailed description of calculations see Materials and Methods.
A specific increase in p53 expression results in down-regulation of cyclin B1 and B2 mRNA levels
After finding that an increase in p53 protein is observed together with a decrease in cyclin B2 mRNA upon chemotherapeutics treatment of cells, we were interested in examining how specific this observation is to the up-regulation of p53. In order to look specifically at the influence of p53 we employed the DLD-1 colorectal adenocarcinoma cell line, which has a p53 mutant background. These cells were stably transfected with a system that permits tet-off regulation for a wild-type or a DNA-binding mutant of p53 (p53R175H) (31). This system allows for selective induction of p53 wild-type or mutant protein in the two created cell lines by removal of doxycycline from the medium (31,32).
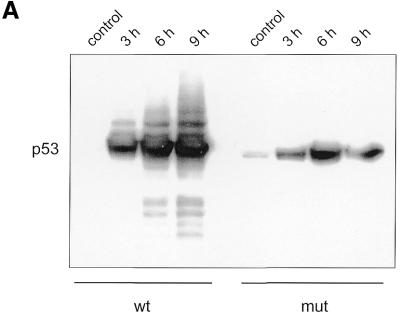
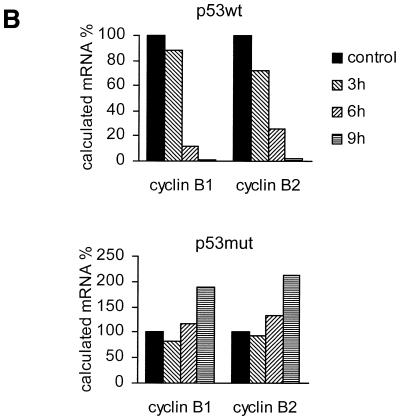
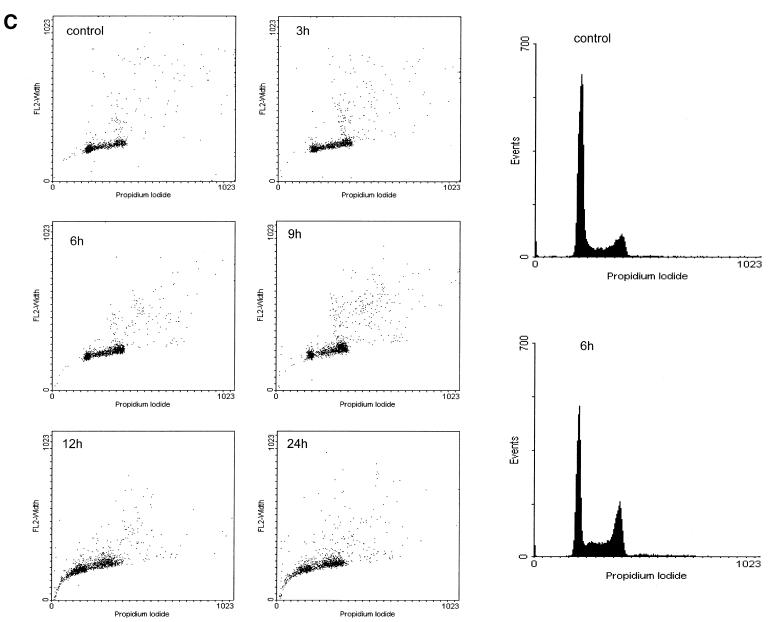
p53 protein is already induced after 3 h and continues to increase for the next 6 h after culturing the cells in medium lacking doxycycline (Fig. 3A). In the same cultures we tested for cyclin B1 and B2 mRNA expression. Upon expression of wild-type p53 both cyclin mRNAs were reduced after 3 h and dropped further at 6 h, reaching residual levels at 9 h of 1.1 and 2.4% for cyclin B1 and B2, respectively (Fig. 3B). In the control experiment with induction of the p53 DNA-binding mutant expression of both cyclins increased slightly over mRNA levels without p53 induction (Fig. 3B). We also checked cells from this experiment by flow cytometry for the appearance of a sub-G1 DNA staining population. Induction of wild-type p53 expression leaves the portion of sub-G1 staining cells similarly low for up to 6 or 9 h while the number of cells in G2 had increased significantly at 6 h. For the 12 and 24 h time points a strong increase in the sub-G1 population was observed (Fig. 3C). Control experiments with mutant p53 induction did not show any significant change in the DNA content of cells compared to uninduced cells for the monitored 24 h period after mutant p53 expression (data not shown).
Figure 3.
cyclin B1 and cyclin B2 mRNA levels from endogenous genes are down-regulated upon selective induction of p53. DLD-1 colorectal cancer cells with a tet-off-regulated gene for wild-type or a DNA-binding mutant of p53 were induced to increase expression of p53 or mutant p53 by removal of doxycycline. (A) Western analysis of p53 induction. Lanes 1 and 5 represent control lysates from DLD-1-tet-off-p53-wt and DLD-1-tet-off-p53-mut cells in the presence of doxycycline, respectively. In lanes 2 and 6, 3 and 7 and 4 and 8 p53 induction 3, 6 and 9 h after antibiotic removal, respectively, is shown. (B) Relative mRNA levels for cyclin B1 and B2 measured by LightCycler RT–PCR. Levels were standardised to expression of GAPDH and mRNA concentrations from control DLD-1-tet-off cells in medium containing doxycycline were set as the 100% reference. (C) DLD-1-tet-off-p53-wt cells were harvested before removal of doxycycline from the medium as a control or at indicated times after elimination of doxycycline from the medium. The cells were stained with propidium iodide and subjected to flow cytometry. DNA staining with propidium iodide versus FL2 pulse width is depicted.
The promoter activity of cyclin B2 is down-regulated by p53
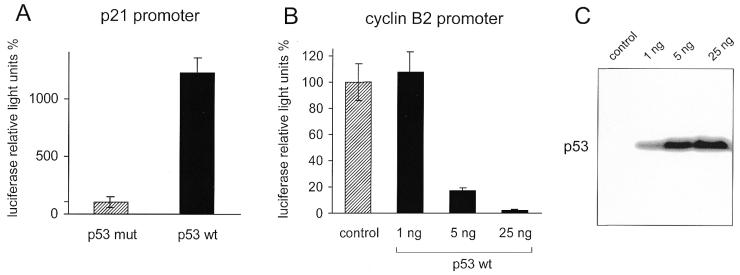
We analysed whether expression of p53 has an influence on the cyclin B2 promoter in SaOS-2 cells with co-transfections of p53-expressing plasmids and cyclin B2 promoter–luciferase constructs. As a control we first tested whether wild-type p53 but not a mutant of this protein could activate transcription from a p21Waf1/Cip1 promoter (Fig. 4A). The p53 mutant, which contains a disabled DNA-binding domain, does not activate transcription significantly. The luciferase values for this control were the same as the background from the pGL3 luciferase vector lacking any promoter (data not shown). However, wild-type p53 triggered a strong increase in transcription from the p21 promoter of >12-fold over the negative p53 mutant (Fig. 4A).
Figure 4.
The cyclin B2 promoter is down-regulated by p53. Luciferase reporter constructs and p53 wild-type and mutant expression plasmids were co-transfected into SaOS-2 cells. All experiments were standardised to Renilla luciferase activity expressed from the co-transfected pRL-null vector. The total amount of transfected DNA was held constant. (A) Stimulation of transcription from a p21 reporter construct as positive control. An aliquot of 125 ng of the B2-Luci reporter plasmid and 25 ng of plasmids expressing wild-type p53 or a DNA binding-deficient p53 mutant were transfected. The expression level with co-transfection of mutant p53 was used as the 100% reference. (B) The cyclin B2 reporter plasmid was co-transfected with 25 ng of vector control and increasing amounts of the plasmid expressing wild-type p53. The control served as the 100% standard. (C) Western blot depicting p53 protein after co-transfection of increasing amounts of a p53-expressing plasmid. Lanes represent lysates from the experiments shown in (B). Lane 1 is without transfection of p53 plasmid; lanes 2–4 are lysates from cells transfected with 1, 5 and 25 ng of wild-type p53-expressing plasmid, respectively.
Analysis of the influence of p53 on the cyclin B2 promoter–luciferase constructs shows an opposite effect. Increasing amounts of wild-type p53-expressing plasmid reduce expression from the cyclin B2 promoter down to background levels. With the largest amount of wild-type p53 plasmid co-transfected the observed repression in this assay was ∼30-fold (Fig. 4B and C). It appears from a number of experiments that cyclin B2 expression is completely shut down, to below the detection limit (data not shown). The calculated factor for repression is dependent on the basal expression level and therefore might be even higher. The cyclin B2 promoter might be completely shut off upon expression of wild-type p53.
Repression of cyclin B2 expression by p53 does not employ a p53 consensus binding site and resides in the 3′-part of the promoter
The next question we wished to answer was through which DNA element in the cyclin B2 promoter is this strong repression made possible? A binding consensus for p53 has been published (37). We inspected the cyclin B2 promoter for a site that would match the p53 consensus and did not find any element that could serve as a p53 binding site.
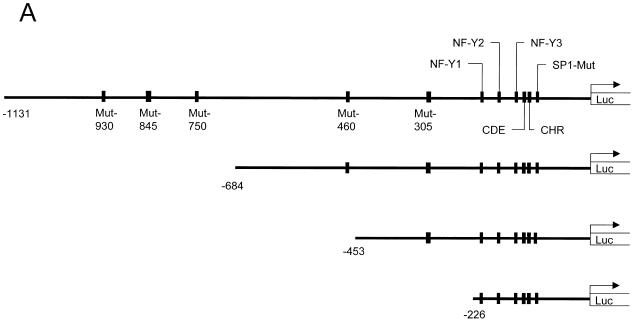
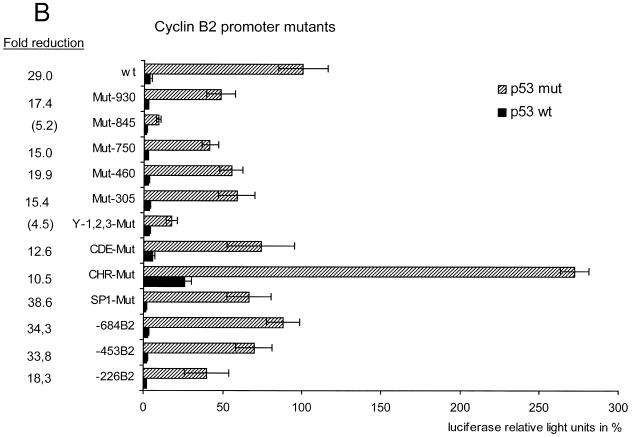
We then started a first preliminary search for the DNA element through which p53 represses cyclin B2 transcription. We compared the mouse and human cyclin B2 promoter sequences and found a number of sites which are conserved in both promoters (M.Wasner, unpublished data). Among these sites there are three NF-Y-binding CCAAT boxes, the cell cycle-dependent element (CDE) and the cell cycle genes homology region (CHR) (26,29). We individually mutated nine of these homology regions on the basis of the mouse cyclin B2 promoter–luciferase construct (Fig. 5A). We analysed these constructs for repression by co-expressed wild-type p53 versus mutant p53. All mutant cyclin B2 promoter constructs were still strongly down-regulated by wild-type p53 (Fig. 5B). A significant change in the repression factor compared to the wild-type construct is only seen with mutant promoters which display a low total activity. Since this search did not reveal the dominant site for repression by p53 we constructed three truncation mutants of the cyclin B2 promoter (Fig. 5A). For the shortest mutant repression drops to 18-fold, compared to 29-fold for the wild-type construct (Fig. 5B). Therefore, nearly all of the p53-dependent repression still resides even in the shortest truncation mutant with 226 bp remaining from the translational start at the 3′-end of the cyclin B2 promoter.
Figure 5.
Repression of cyclin B2 transcription by p53 is not mediated by regions homologous in the mouse and human promoters and resides just upstream of the coding region. (A) Anatomy of the cyclin B2 promoter. Regions homologous in the human and mouse promoter are indicated by their names or as their respective mutants with numbers for their location counted in nucleotides from the first codon. For the three truncation mutants the remaining elements are indicated. (B) Analyses of the different mutant reporters upon transfection of wild-type or mutant p53. Experimental conditions were the same as in Figure 4. The fold reduction was calculated by dividing luciferase activities from p53 mutant transfections by values from p53 wild-type transfections. Fold reductions shown in parentheses were calculated for reporters with low general activities which are closer to background levels and therefore result in lower repression factors.
DISCUSSION
p53 activates or represses transcription of a number of central regulators of cell division and apoptosis. We find that cyclin B2 transcription is shut down by expression of wild-type p53. The other B-type cyclin, cyclin B1, has already been shown to be down-regulated by p53 at the transcriptional level (38,39). Therefore, both mammalian cyclin B genes are repressed by p53.
One way of increasing p53 levels is by incubating cells with chemotherapeutic agents. Treatment of cells with chemotherapeutics certainly leads to profound changes in the expression of many genes. Therefore, even though we see an up-regulation of p53 protein and a down-regulation of cyclin B2 mRNA these two observations might not be directly connected (Figs 1 and 2). Consequently, in later experiments we looked at colorectal carcinoma cells with a p53 mutant background in which wild-type or mutant p53 could be selectively induced. We observed an effective decrease in both cyclin B1 and B2 mRNA levels upon expression of wild-type but not mutant p53 (Fig. 3). This reduction is already seen 3 h after removal of antibiotic from the DLD-1-tet-off-p53 cells (Fig. 3B). Considering the time needed for expression of p53 and degradation of cyclin B mRNA this may implicate an immediate response by down-regulation of cyclin B transcription. General effects like the induction of apoptosis seem to appear later, since a significant sub-G1 cell population, as judged by DNA staining and FACS analysis, is not observed until 9 h after induction of p53. However, at 6 h an increase in the G2/M cell population can already be detected (Fig. 3C). These observations are consistent with earlier results when p53-dependent transcriptional repression and cell cycle control were analysed. It has been reported that high levels of p53 in TR9-7 skin fibroblasts lead to a reduction in cdc2 and cyclin B1 mRNA levels and to G2 cell cycle arrest (39). Another study showed that overexpression of cyclin B1 can overcome p53-dependent G2 arrest in an ovarian cancer cell line (38). Taken together, the results from these two recent papers and our experiments indicate that the timing of the decrease in cyclin B mRNAs precedes G2 arrest and appearance of apoptotic cells (Fig. 3).
In order to obtain more information on how cyclin B2 is down-regulated we performed co-transfections of p53 wild-type and mutant constructs and analysed their effect on expression of a cyclin B2 promoter–luciferase reporter. Cyclin B2 expression is repressed down to background levels upon co-transfection of wild-type p53 in a concentration-dependent manner (Fig. 4). In previous reports on the cyclin B1 promoter reduction of its transcription by p53 was not as pronounced as described here for cyclin B2 (38,39). However, when a similar experimental approach was taken, e.g. co-transfection of a reporter and wild-type p53 in SaOS-2 cells, repression of the cyclin B1 promoter was close to vector background levels (38). In summary, these results show that concentrations of both B-type cyclins are substantially reduced when p53 is up-regulated.
Human and mouse cyclin B2 transcription are both repressed by p53, but their promoters do not display a p53 consensus binding site. In initial experiments to elucidate by which elements p53 can repress the cyclin B2 promoter we analysed regions homologous in the human and mouse promoters. We mutated all homologous regions on the basis of the mouse construct and tested if expression from these plasmids was still repressed by p53 (Fig. 5). Among these promoter constructs was the Y-1,2,3-Mut plasmid in which three CCAAT boxes had been mutated. It has been shown that p53 can repress the hsp70 promoter through interaction with the CCAAT box-binding factor (CBF or NF-Y) and that an NF-Y-binding CCAAT box in the cdc2 promoter is the site for repression by p53 (40–42). We found earlier that the three CCAAT boxes in the 3′-region of the cyclin B2 promoter are the main activators for transcription (29). Now we observe that transcription from the Y-1,2,3-Mut plasmid is still repressed by wild-type p53 but not mutant p53 (Fig. 5B). However, there is a change in the factor by which p53 can repress Y-1,2,3-Mut. Yet, as with the Mut-845 construct, Y-1,2,3-Mut also shows a low absolute activity. Therefore, repression by p53 down to background simulates a lower repression factor in these cases (Fold reduction, Fig. 5B). Absolute activity of the CHR mutant is increased over the wild-type promoter. The CHR element is responsible for cell cycle-dependent repression of cyclin B2. Destruction of this site leads to derepression of this promoter which yields a higher average activity in an asynchronous growing cell population (Fig. 5B and data not shown).
Since the constructs created on the basis of homology between mouse and human promoters did not yield a mutant in which repression was lost to a significant extent we tested three large deletion mutants of the cyclin B2 promoter. The three mutants retained the ability for p53-dependent down-regulation (Fig. 5). The fact that even the –226B2 mutant is still repressed similarly to the full-length wild-type promoter suggests that this promoter segment is sufficient to mediate p53-dependent repression. The three CCAAT boxes responsible for most of the activation and the CDE/CHR cell cycle elements are found in this most proximal segment (29). Although this core promoter contains most of the sites essential for the properties of the cyclin B2 promoter we could show that these elements are not the sites through which p53 down-regulates cyclin B2 transcription (Fig. 5). It has been suggested that repression by p53 can be regulated through TATA boxes (43). However, many of the promoters of cell cycle genes, including the cyclin B2 promoter described here, do not contain TATA elements for transcriptional initiation. Therefore, further experiments are required to elucidate the exact mechanism of repression.
Cyclin B is essential for cdc2 kinase to form MPF, which in turn induces transition from G2 to mitosis. Human cyclins B1 and B2 are both able to serve as the activating partner for cdc2 kinase, with peak activity at mitosis (44). Innocente et al. recently showed that histone kinase activity in cdc2 immunoprecipitates and in co-immunoprecipitates with cyclins B1 and B2 is reduced upon induction of p53. This reduction in activity is not due to reduced expression of cdc2 kinase or a change in its tyrosine phosphorylation. However, there is a marked decrease in cyclin B1 mRNA and protein (38). We now find that cyclin B2 is down-regulated after increased expression of p53. It is obvious that expression of both cyclin B1 and B2 have to be reduced to ultimately shut off cdc2 kinase activity and slow down execution of G2/M progression. This is corroborated by the fact that re-expression of cyclin B1 alone can overcome p53-induced G2 cell cycle arrest (38).
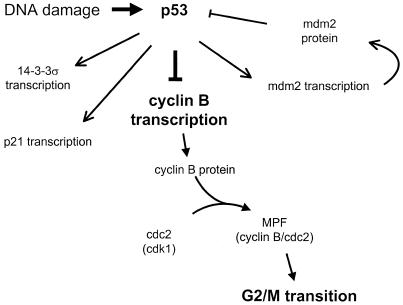
Taken together, these observations indicate that transcriptional repression of cyclin B by p53 is important for cell cycle progression (Fig. 6). Other factors transcriptionally induced by p53 have been implicated in G2/M checkpoint control. One example is 14-3-3σ, which contains a p53-responsive element in its promoter and is able to control G2 arrest by employing compartmentalisation through cytoplasmic retention of cyclin B/cdc2 (12,45). There are multiple ways by which p53 may be involved in the different checkpoints. Cell type-specific differences exist. Some of the pathways are redundant and some will have to cooperate to exert the p53 checkpoint function (1,2,18,46). By different means p53 seems to play an important role in reducing the concentration of active cyclin B–cdc2 complex in the nucleus to maintain G2 arrest. Repression of cyclin B transcription by p53 is part of this regulatory network.
Figure 6.
An increase in p53 may influence the transition from G2 to mitosis by repressing transcription of cyclin B. Repression of cyclin B1 and B2 transcription by p53 results in lower cyclin B protein concentrations. Reduced amounts of cyclin B leave the cdc2 kinase inactive, which may contribute to an arrest of the cell cycle in G2.
Acknowledgments
ACKNOWLEDGEMENTS
We wish to thank Jana Lorenz for technical assistance and Bert Vogelstein for generously providing the DLD-1 tet-off cells in addition to the p21 promoter and p53 expression plasmids. K.E. is supported by grants from the Bundesministerium für Bildung und Forschung (through the IZKF) and the Deutsche Forschungsgemeinschaft.
REFERENCES
- 1.Levine A.J. (1997) Cell, 88, 323–331. [DOI] [PubMed] [Google Scholar]
- 2.Ko L.J. and Prives,C. (1996) Genes Dev., 10, 1054–1072. [DOI] [PubMed] [Google Scholar]
- 3.Lakin N.D. and Jackson,S.P. (1999) Oncogene, 18, 7644–7655. [DOI] [PubMed] [Google Scholar]
- 4.Schuster N., Prowald,A., Schneider,E., Scheidtmann,K.H. and Montenarh,M. (1999) FEBS Lett., 447, 160–166. [DOI] [PubMed] [Google Scholar]
- 5.Hirao A., Kong,Y.Y., Matsuoka,S., Wakeham,A., Ruland,J., Yoshida,H., Liu,D., Elledge,S.J. and Mak,T.W. (2000) Science, 287, 1824–1827. [DOI] [PubMed] [Google Scholar]
- 6.Miyashita T. and Reed,J.C. (1995) Cell, 80, 293–299. [DOI] [PubMed] [Google Scholar]
- 7.Reed J.C. (1994) J. Cell Biol., 124, 1–6. [DOI] [PMC free article] [PubMed] [Google Scholar]
- 8.el-Deiry W.S., Tokino,T., Velculescu,V.E., Levy,D.B., Parsons,R., Trent,J.M., Lin,D., Mercer,W.E., Kinzler,K.W. and Vogelstein,B. (1993) Cell, 75, 817–825. [DOI] [PubMed] [Google Scholar]
- 9.Brugarolas J., Chandrasekaran,C., Gordon,J.I., Beach,D., Jacks,T. and Hannon,G.J. (1995) Nature, 377, 552–557. [DOI] [PubMed] [Google Scholar]
- 10.Deng C., Zhang,P., Harper,J.W., Elledge,S.J. and Leder,P. (1995) Cell, 82, 675–684. [DOI] [PubMed] [Google Scholar]
- 11.Bunz F., Dutriaux,A., Lengauer,C., Waldman,T., Zhou,S., Brown,J.P., Sedivy,J.M., Kinzler,K.W. and Vogelstein,B. (1998) Science, 282, 1497–1501. [DOI] [PubMed] [Google Scholar]
- 12.Hermeking H., Lengauer,C., Polyak,K., He,T.C., Zhang,L., Thiagalingam,S., Kinzler,K.W. and Vogelstein,B. (1997) Mol. Cell, 1, 3–11. [DOI] [PubMed] [Google Scholar]
- 13.Wang X.W., Zhan,Q., Coursen,J.D., Khan,M.A., Kontny,H.U., Yu,L., Hollander,M.C., O’Connor,P.M., Fornace,A.J.,Jr and Harris,C.C. (1999) Proc. Natl Acad. Sci. USA, 96, 3706–3711. [DOI] [PMC free article] [PubMed] [Google Scholar]
- 14.Roth J., Dobbelstein,M., Freedman,D.A., Shenk,T. and Levine,A.J. (1998) EMBO J., 17, 554–564. [DOI] [PMC free article] [PubMed] [Google Scholar]
- 15.Pan H., Yin,C., Dyson,N.J., Harlow,E., Yamasaki,L. and Van Dyke,T. (1998) Mol. Cell, 2, 283–292. [DOI] [PubMed] [Google Scholar]
- 16.Muller H. and Helin,K. (2000) Biochim. Biophys. Acta, 1470, M1–M12. [DOI] [PubMed] [Google Scholar]
- 17.Mummenbrauer T., Janus,F., Muller,B., Wiesmuller,L., Deppert,W. and Grosse,F. (1996) Cell, 85, 1089–1099. [DOI] [PubMed] [Google Scholar]
- 18.Albrechtsen N., Dornreiter,I., Grosse,F., Kim,E., Wiesmuller,L. and Deppert,W. (1999) Oncogene, 18, 7706–7717. [DOI] [PubMed] [Google Scholar]
- 19.Tanaka H., Arakawa,H., Yamaguchi,T., Shiraishi,K., Fukuda,S., Matsui,K., Takei,Y. and Nakamura,Y. (2000) Nature, 404, 42–49. [DOI] [PubMed] [Google Scholar]
- 20.Sherr C.J. (1996) Science, 274, 1672–1677. [DOI] [PubMed] [Google Scholar]
- 21.Koepp D.M., Harper,J.W. and Elledge,S.J. (1999) Cell, 97, 431–434. [DOI] [PubMed] [Google Scholar]
- 22.Elledge S.J. (1996) Science, 274, 1664–1672. [DOI] [PubMed] [Google Scholar]
- 23.O’Connell M.J., Walworth,N.C. and Carr,A.M. (2000) Trends Cell Biol., 10, 296–303. [DOI] [PubMed] [Google Scholar]
- 24.Gautier J., Minshull,J., Lohka,M., Glotzer,M., Hunt,T. and Maller,J.L. (1990) Cell, 60, 487–494. [DOI] [PubMed] [Google Scholar]
- 25.Lew D.J., Dulic,V. and Reed,S.I. (1991) Cell, 66, 1197–1206. [DOI] [PubMed] [Google Scholar]
- 26.Brandeis M. and Hunt,T. (1996) EMBO J., 15, 5280–5289. [PMC free article] [PubMed] [Google Scholar]
- 27.Baker S.J., Markowitz,S., Fearon,E.R., Willson,J.K. and Vogelstein,B. (1990) Science, 249, 912–915. [DOI] [PubMed] [Google Scholar]
- 28.el-Deiry W.S., Tokino,T., Waldman,T., Oliner,J.D., Velculescu,V.E., Burrell,M., Hill,D.E., Healy,E., Rees,J.L. and Hamilton,S.R. (1995) Cancer Res., 55, 2910–2919. [PubMed] [Google Scholar]
- 29.Bolognese F., Wasner,M., Lange-zu Dohna,C., Gurtner,A., Ronchi,A., Muller,H., Manni,I., Mössner,J., Piaggio,G., Mantovani,R. and Engeland,K. (1999) Oncogene, 18, 1845–1853. [DOI] [PubMed] [Google Scholar]
- 30.Muller M., Wilder,S., Bannasch,D., Israeli,D., Lehlbach,K., Li-Weber,M., Friedman,S.L., Galle,P.R., Stremmel,W., Oren,M. and Krammer,P.H. (1998) J. Exp. Med., 188, 2033–2045. [DOI] [PMC free article] [PubMed] [Google Scholar]
- 31.Yu J., Zhang,L., Hwang,P.M., Rago,C., Kinzler,K.W. and Vogelstein,B. (1999) Proc. Natl Acad. Sci. USA, 96, 14517–14522. [DOI] [PMC free article] [PubMed] [Google Scholar]
- 32.Gossen M. and Bujard,H. (1992) Proc. Natl Acad. Sci. USA, 89, 5547–5551. [DOI] [PMC free article] [PubMed] [Google Scholar]
- 33.Harlow E. and Lane,D. (1999) Using Antibodies: A Laboratory Manual. Cold Spring Harbor Laboratory Press, Cold Spring Harbor, NY.
- 34.Pines J. and Hunter,T. (1989) Cell, 58, 833–846. [DOI] [PubMed] [Google Scholar]
- 35.Ercolani L., Florence,B., Denaro,M. and Alexander,M. (1988) J. Biol. Chem., 263, 15335–15341. [PubMed] [Google Scholar]
- 36.Fritsche M., Haessler,C. and Brandner,G. (1993) Oncogene, 8, 307–318. [PubMed] [Google Scholar]
- 37.el-Deiry W.S., Kern,S.E., Pietenpol,J.A., Kinzler,K.W. and Vogelstein,B. (1992) Nature Genet., 1, 45–49. [DOI] [PubMed] [Google Scholar]
- 38.Innocente S.A., Abrahamson,J.L., Cogswell,J.P. and Lee,J.M. (1999) Proc. Natl Acad. Sci. USA, 96, 2147–2152. [DOI] [PMC free article] [PubMed] [Google Scholar]
- 39.Taylor W.R., DePrimo,S.E., Agarwal,A., Agarwal,M.L., Schonthal,A.H., Katula,K.S. and Stark,G.R. (1999) Mol. Biol. Cell, 10, 3607–3622. [DOI] [PMC free article] [PubMed] [Google Scholar]
- 40.Agoff S.N., Hou,J., Linzer,D.I. and Wu,B. (1993) Science, 259, 84–87. [DOI] [PubMed] [Google Scholar]
- 41.Yun J., Chae,H.D., Choy,H.E., Chung,J., Yoo,H.S., Han,M.H. and Shin,D.Y. (1999) J. Biol. Chem., 274, 29677–29682. [DOI] [PubMed] [Google Scholar]
- 42.Mantovani R. (1998) Nucleic Acids Res., 26, 1135–1143. [DOI] [PMC free article] [PubMed] [Google Scholar]
- 43.Mack D.H., Vartikar,J., Pipas,J.M. and Laimins,L.A. (1993) Nature, 363, 281–283. [DOI] [PubMed] [Google Scholar]
- 44.Jackman M., Firth,M. and Pines,J. (1995) EMBO J., 14, 1646–1654. [DOI] [PMC free article] [PubMed] [Google Scholar]
- 45.Chan T.A., Hermeking,H., Lengauer,C., Kinzler,K.W. and Vogelstein,B. (1999) Nature, 401, 616–620. [DOI] [PubMed] [Google Scholar]
- 46.Gottlieb T.M. and Oren,M. (1996) Biochim. Biophys. Acta, 1287, 77–102. [DOI] [PubMed] [Google Scholar]


