

Abstract
Aficamten, a cardiac myosin inhibitor, is being developed for the treatment of patients with symptomatic hypertrophic cardiomyopathy (HCM). The purpose of this study was to determine the absorption, metabolism, and excretion of aficamten. Eight healthy male participants received a single oral dose of 20 mg aficamten (containing approximately 100 μCi of radiocarbon). Blood, urine, and feces samples were collected up to a maximum of Day 26. The pharmacokinetics of aficamten were characterized by moderate absorption, with a median tmax of 2.0 h postdose. The median t1/2 of aficamten was 99.6 h with similar t1/2 observed for metabolites and total radioactivity in plasma and whole blood. The overall total recovery of administered total radioactivity was 89.7% with 57.7% of the dose recovered in feces and 32.0% in urine. The main circulating metabolites in plasma included monohydroxylated metabolites M1a (CK‐3834282) and M1b (CK‐3834283) accounting for 10.5% and 36.4% of the total radioactivity AUC both with a median tmax of 5 h. The other major plasma metabolite was M5 (an oxygen‐linked glucuronide conjugate of M1a), which accounted for 10.3% of the total plasma radioactivity exposure, with a tmax of 24 h. In urine, M5 was the most abundant metabolite with 8.02% total radioactive dose (TRD), followed by M1a and M1b with 6.16% and 2.85% TRD, respectively; however, there were no metabolites in urine observed at >10% of dose. The major metabolite in feces was M18 representing 44.1% of the radioactive dose. These findings indicated that aficamten was eliminated by metabolism, and to a minor extent, by fecal excretion of unchanged aficamten with renal excretion playing a minor role. Feces were the principal route of excretion of the radioactive dose.
Keywords: absorption, aficamten, biotransformation, distribution, excretion, metabolism, pharmacokinetics
Proposed biotransformation pathways of aficamten in male humans.

Abbreviations
- AEs
adverse events
- AUC0‐∞
area under the concentration‐time curve from time 0 to infinity
- AUC0‐t
area under the concentration‐time curve from time 0 to the last measurable time point
- BMI
body mass index
- CL/F
apparent total body clearance
- Cmax
maximum observed concentration
- CYP
cytochrome P450
- ECG
12‐lead electrocardiogram
- F
bioavailability
- HCM
Hypertrophic Cardiomyopathy
- LC‐HRMS
liquid chromatography‐high‐resolution mass spectrometry
- LC‐MS/MS
liquid chromatography/high‐resolution mass spectrometry
- LLOQ
lower limit of quantitation
- LSC
liquid scintillation counting
- LVEF
left ventricular ejection fraction
- MBq
megabecquerel
- MedDRA
Medical Dictionary for Regulatory Activities
- PK
Pharmacokinetics
- t1/2
terminal elimination half‐life
- tmax
the time to reach maximum concentration
- Vz/F
apparent volume of distribution during terminal phase
1. INTRODUCTION
Hypertrophic cardiomyopathy (HCM) is an inherited cardiovascular disorder with an estimated clinical prevalence of 1:200–1:500 in the general population. 1 , 2 Familial form accounts for 40%–60% of HCM and is caused by underlying sarcomere gene mutations that have an autosomal dominant inheritance pattern. 3 , 4 , 5 Clinical presentation of HCM includes an increase in left ventricular hypertrophy (LVH) due to hypercontractility, which may lead to abnormalities such as LV outflow tract obstruction, mitral regurgitation, diastolic dysfunction, myocardial ischemia, arrythmias, and autonomic dysfunction. 6 Clinical manifestations can include exertional dyspnea, heart failure, syncope, and sudden cardiac death. Diagnosis of HCM is based on imaging strategies such as echocardiography and cardiac magnetic resonance. 7 , 8 Treatment of HCM focuses on medications that can decrease contractility, such as cardiac myosin inhibitors, B‐adrenergic receptor blockers, calcium channel blockers, and disopyramide. 9 , 10 Developing therapies that are disease‐modifying by preventing complications related to HCM are a priority. 6 , 10 , 11
Aficamten (formerly CK‐3773274, structure shown in Figure 1) is a small‐molecule, selective cardiac myosin inhibitor being developed as a potential treatment for HCM. Aficamten targets the underlying cause of HCM by reducing pathologic hypercontractility. It directly binds to cardiac myosin at a distinct allosteric binding site which results in reduced number of actin‐myosin cross‐bridges responsible for the myocardial hypercontractility. 5 , 12 , 13 In a phase 1 clinical study (single and multiple doses), aficamten was absorbed following oral administration with a median time to maximum plasma concentration (tmax) that ranged from 1 to 2.5 h. After reaching the tmax, there was an initial rapid decline in aficamten pharmacokinetics (PK) followed by a longer elimination phase. The mean apparent terminal elimination half‐life (t1/2) was approximately 75 to 85 h with the steady state concentrations being achieved within 2 weeks. The PK exposures were generally dose linear and multiple doses of aficamten resulted in mean accumulation ratios ranging from 4.6–4.9 consistent with the t1/2, This accumulation at steady‐state was predicted by the single‐dose PK, indicating that the PK behavior did not change over time. As such, a single‐dose study was considered appropriate to accurately describe aficamten PK (FDA, 2024). Administration with food did not affect the extent of aficamten absorption. 5 In vitro studies indicate that aficamten is primarily metabolized by a multitude of cytochrome P450 (CYP) enzymes, including CYP2C8, CYP2C9, CYP2C19, CYP2D6 and CYP3A4, ensuring a modest drug–drug interaction profile and limited effect of P450 genetic polymorphisms (Data on File). In a Phase 1 study, aficamten PK parameters in participants with moderate hepatic impairment and normal hepatic function were generally comparable, obviating the need for dose adjustment in HCM patients with mild or moderate hepatic impairment. 14 Population PK analyses demonstrated that aficamten PK was comparable between healthy participants and participants with oHCM (data on file), supporting the evaluation of mass balance in healthy participants.
FIGURE 1.
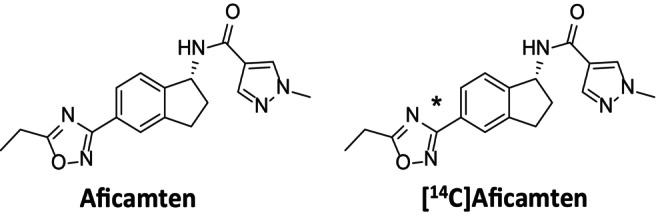
Chemical structures of aficamten and [14C]aficamten. (*denotes the site of 14C‐label in the 1,2,4‐oxadiazole moiety at the 3‐position carbon atom).
In the current study, the disposition of [14C]aficamten was evaluated following a single oral dose of aficamten 20 mg in healthy participants. The 20 mg dose of aficamten represents the highest dose that is being evaluated in the Phase 3 clinical program and previous clinical studies support the safety and tolerability of this dose to healthy participants. Based on the PK and dosimetry data, administration of a single 100 μCi (3.7 megabecquerel; MBq) oral dose of [14C]aficamten was selected as it was not expected to represent a significant radiation exposure risk to study participants (Data on File). The primary objectives of this study were to determine the absorption, metabolism, and excretion of [14C]aficamten and identify and characterize the metabolites present in plasma, urine, and feces following single oral dose administration of aficamten. The secondary objective was to assess the safety and tolerability of aficamten.
2. MATERIALS AND METHODS
2.1. Materials
Active pharmaceutical ingredient (API: radiolabeled powder, made under GMP) [14C]‐Aficamten with a specific activity of 5.14 mCi/mg and with chemical and radiochemical purity (both determined by HPLC) of 100% and 100%, respectively, was supplied by ViTrax Radiochemicals (Placentia, CA). The chemical structure of aficamten with the radioactive position is depicted in Figure 1. A study site licensed pharmacist manufactured and labeled the investigational medicinal product from bulk supplies, such that each capsule contained a total of 20‐mg aficamten containing approximately 100 μCi of [14C]. Dose analysis of the clinical preparation of [14C]‐aficamten oral capsules verified radiochemical purity (100%) and radiochemical content (108.7% or 108.7 μCi/capsule), which met requirements. Authentic reference standards for aficamten, CK‐3834282 (M1a), CK‐3834283 (M1b), and other metabolites were also synthesized at Cytokinetics, Inc. Blank biological matrix was purchased from a commercial supplier. All other solvents and reagents were of laboratory grade and were acquired from commercial suppliers.
2.2. Study design
This study was a Phase 1, single‐center, open‐label study conducted in 8 healthy male participants conducted at Labcorp Clinical Research Unit (Madison, WI, USA). It was performed in accordance with ethical principles consistent with the International Conference on Harmonization Good Clinical Practice guidance and the ethical guidelines of the Declaration of Helsinki. The protocol and informed consent were approved by the study center's Institutional Review Board.
2.3. Study population
Eligible participants were healthy male individuals between 18 and 45 years of age with a body mass index (BMI) between 18.0 and 30.0 kg/m2. Major inclusion criteria included healthy participants based on medical history, physical examinations, normal 12‐lead electrocardiogram (ECG), normal cardiac structure and function with a left ventricular ejection fraction of ≥60%. Major exclusion criteria included active medical illness, positive hepatitis B or C virus or human immunodeficiency virus, use of prescription medications within 14 days or 5 half‐lives prior to check‐in, use of nonprescription medications within 7 days or herbal preparations within 21 days prior to check‐in, and alcohol consumption of >21 units per week.
2.4. Drug administration
A single 20‐mg oral dose of aficamten (containing approximately 100 μCi of radiocarbon) was administered as a single capsule with 240 mL of water after an overnight fast of at least 10 h. Participants were confined to study site until at least Day 19 or until the discharge criteria were met. Discharge criteria included ≥90% mass balance recovered, and ≤1% of the total radioactive dose recovered in combined excreta (urine and feces) in 2 consecutive 24‐h periods in which both collections occur, and plasma radioactivity fell below the lower limit of detection for 2 consecutive collections. Participants were contacted between 7 to 9 days after discharge in a follow‐up phone call.
2.5. Sample collection and processing
PK sampling was performed at the following time points after aficamten administration on day 1: predose, 0.25, 0.5, 1, 1.5, 2, 2.5, 3, 4, 6, 8, 12, 16, 24, 36, and 48 h post‐dose, then at 24‐h intervals until discharge. Approximately 3 mL of blood (K2EDTA) was collected for the determination of aficamten and its metabolites, CK‐3834282 and CK‐3834283, in plasma. Approximately 4 mL of blood (K2EDTA) was collected for total radioactivity in whole blood and plasma. Approximately 8 mL of blood (K2EDTA) was collected for metabolite profiling and identification in plasma. Samples were stored under ambient conditions until centrifugation. If applicable, plasma was separated using a centrifuge set at approximately 2000G for 10 minutes at 4°C. The PK and radioactivity samples were stored frozen at −20°C and the metabolite profiling samples were stored frozen at −70°C prior to shipment on dry ice for analysis.
Urine samples were collected at predose (−12 to 0 h), 0–4, 4–8, 8–12, and 12–24 h post‐dose, then at 24‐h intervals until discharge. Urine samples were collected in polypropylene urinals and pooled urine was stored in polyethylene containers and stored refrigerated (4°C) during the collection period. Prior to pooling, isopropyl alcohol (>99.5%) was added to each urinal equal to 20% of the mass of the void and mixed gently. Aliquots were transferred and stored frozen (−20°C for PK and radioactivity samples and − 70°C for metabolite profiling samples) until shipment under dry ice. Feces were collected predose (from check‐in to 0 h), then at 24‐h intervals until discharge. The fecal samples were stored at −70°C until shipment under dry ice. Fecal samples were combined by participants at 24‐h intervals, and the weight of each combined sample was recorded. Solvent (approximately 20:80 acetonitrile: deionized water, v:v) was added and the sample was mixed and homogenized using a probe‐type homogenizer.
2.6. PK assessments
Plasma concentrations of aficamten (parent drug) and metabolites M1a (CK‐3834282) and M1b (CK‐3834283) were measured by validated liquid chromatography with tandem mass spectrometry (LC‐MS/MS) methods. The analytical methods were developed and validated at Celerion, Lincoln, Nebraska. The chromatographic method selected for the parent method was reverse phase on a Water, XBridge® BEH C18, 50 × 2.1 mm, 3.5 μm column with 10 mM ammonium acetate and acetonitrile as the mobile phases (gradient elution). The chromatographic retention mechanism selected for the metabolite method for the resolution of M1a and M1b enantiomers was reverse phase on a Daicel/Chiral Technologies, Inc., CHIRLPAK® IB N‐3, 150 × 2.1 mm, 3 μm column with 30:70 acetonitrile:10 mM ammonium acetate as the mobile phase. During validation, the following method performance parameters were evaluated: selectivity, sensitivity, stability, recovery, matrix effect, accuracy, and precision. Details of the method are presented in Table 1.
TABLE 1.
Bioanalytical assay characteristics.
| Analyte | Parent | Metabolites | |
|---|---|---|---|
| Aficamten (CK‐3773274) | M1a (CK‐3834282) | M1b (CK‐3834283) | |
| Internal Standard | CK‐3942912 | CK‐3978133 | CK‐3978133 |
| LLOQ | 1 ng/mL | 1 ng/mL | 1 ng/mL |
| Linear Range | 1–500 ng/mL | 1–500 ng/mL | 1–500 ng/mL |
| QC Samples Precision (%CV) | 0.5 to 17.1% | 0.8 to 7.1% | 0.9 to 8.6% |
| QC Samples Accuracy (%Bias) | −21.5 to 6.3% | −4.4 to 9.7% | −10.8 to 9.7% |
Abbreviations: %CV, percent coefficient of variation; LLOQ, lower limit of quantitation.
2.7. Analysis of total radioactivity
Total radioactivity concentrations in whole blood, plasma, urine, and feces were analyzed by LabCorp Early Development Laboratories Inc. (Madison, Wisconsin) using a liquid scintillation counting (LSC) method. All sample combustions were done in a Model 307 Sample Oxidizer (Packard Instrument Company), and the resulting 14CO2 was trapped in Carbo‐Sorb and mixed with Perma Fluor. Oxidation efficiency was evaluated on each day of sample combustion by analyzing a commercial radiolabeled standard directly in scintillation cocktail and by oxidation. Acceptance criteria were combustion recoveries of 95% to 105%. Ultima Gold XR scintillation cocktail was used for samples analyzed directly (plasma and urine). Blood and fecal homogenate samples were combusted followed by analysis by LSC. All samples were analyzed for radioactivity in Model 4910TR liquid scintillation counters (Packard Instrument Company) for at least 5 minutes or until 0.6% 2 s values were achieved. Each sample was homogenized or mixed before radioanalysis (unless the entire sample was used for analysis). All samples were analyzed in duplicate if sample size allowed. Scintillation counting data were automatically corrected for counting efficiency using the external standardization technique and an instrument‐stored quench curve generated from a series of sealed, quenched standards. The lower limit of quantitation (LLOQ) for whole blood total radioactivity was 9.57 ng equivalents/g, plasma total radioactivity was 6.86 ng equivalents/g, urine was 9.1 ng equivalents/g and for feces was 49.2 equivalents/g.
2.8. Metabolite profiling of plasma, urine, and feces
Plasma samples obtained from study participants at 2, 4, 12, 24, 72, 120, 168, and 264 h postdose were pooled by time point to generate 2‐, 4‐, 12‐, 24‐, 72‐, 120‐, 168‐, and 264‐h pooled samples, including 1.2 to 2.5 g of each individual sample. Pooling was conducted in proportion to the weight of plasma collected in each sampling period. The radioactivity in each pooled sample was determined by LSC.
Urine samples obtained from study participants were pooled by individual to generate 0‐ to 336‐, 0‐ to 384‐, and 0‐ to 432‐h pooled samples, including 0.03 to 0.08% of each individual sample weight. The radioactivity in each pooled sample was determined by LSC. Approximately 5 to 6 g of each pooled urine aliquot was evaporated to dryness under nitrogen at ambient temperature, and each residue was reconstituted in 300 μL of 1:5 (v:v) methanol: reverse osmosis water (MeOH:RO water). Samples were sonicated, vortex‐mixed, and centrifuged, and duplicate aliquots were analyzed by LSC to determine reconstitution recoveries, which ranged from 99.1 to 107%.
Feces samples obtained from study participants pooled by individual to generate 0‐ to 168‐, 0‐ to 288‐, 24‐ to 264‐, 24‐ to 336‐, 48‐ to 264‐, and 48‐ to 360‐h pooled samples, including 0.17 to 0.32% of each individual sample weight. The radioactivity in each pooled sample was determined by LSC. Approximately 2.5 g of each individual participant's feces sample was combined with 6 mL of acetonitrile. Each mixture was sonicated, vortex‐mixed, and centrifuged, and the supernatant was removed. The extraction was repeated, and the respective supernatants were combined. Duplicate aliquots were analyzed by LSC to determine extraction recoveries, which ranged from 79.1 to 119%. Due to low recoveries, all remaining feces pellets were further extracted with MeOH, as previously described, and all respective supernatants were combined. The MeOH extraction recoveries ranged from 2.83 to 8.56%. Overall extraction recovery ranged from 89.0 to 116%. The combined supernatants were evaporated to dryness under nitrogen at ambient temperature, and each residue was reconstituted in 300 μL of 2:1 (v:v) MeOH:RO water. Samples were sonicated, vortex‐mixed, and centrifuged, and duplicate aliquots were analyzed by LSC to determine reconstitution recoveries, which ranged from 95.0 to 103%.
The reconstituted samples were analyzed by liquid chromatography‐high‐resolution mass spectrometry (LC‐HRMS), and by radiometric analysis with eluent fractions collected at 10‐second intervals into 96‐well plates containing solid scintillant. There were two LC‐HRMS methods used. For the chromatographic resolution of aficamten and metabolites (Method 1), samples were chromatographed on a Waters XSelect HSS T3, 250 × 4.6 mm, 3.5 μm reverse phase column (Waters Corporation, Milford, MA). Chromatographic resolution was achieved by reverse phase gradient elution at a flow rate of 1.0 mL/min with split ratio of 25:75 into the electrospray ion source or fractions for radioactivity measurement over 62 minutes, and where the gradient aqueous mobile phase‐A consisted of reverse osmosis water with 0.1% formic acid (v/v) and the organic mobile phase‐B contained acetonitrile with 0.1% formic acid (v/v). For the chiral resolution of enantiomeric metabolites M1a and M1b (Method 2), samples were chromatographed on a Phenomenex Lux Cellulose‐1 4.6 × 150 mm, 3 μm reverse phase column (Phenomenex, Torrance, CA). Chromatographic resolution was achieved by reverse phase gradient elution at a flow rate of 0.6 mL/min with split ratio of 25:75 into the electrospray ion source or fractions for radioactivity measurement over 15 minutes where the mobile phases used were as described above. In both methods, ionization was performed in the positive and negative ionization modes with scanning from m/z 50 to m/z 1000.
Radioactivity in each well was determined using MicroBeta2 analysis, and radiochemical profiles were generated based on radioactivity counts. Quantitation of the metabolites present in plasma, urine, and feces was based on the profiles of radioactivity. The limit of quantitation for radioactivity in plasma, urine, and feces was set at 1% of each chromatographic analysis (run) and 10 cpm peak height. The cut‐off for identification of metabolites was 1% of the sample radioactivity for plasma and 1% of the radioactive dose for urine and feces. Once all matrices were analyzed by LC—HRMS, metabolite numbers (e.g., M1, M2, and M3) were assigned to all peaks (except parent), whether they were determined to be true metabolites or degradants, and whether or not they were subsequently identified.
2.9. PK analysis
PK parameters were determined for total radioactivity in plasma and whole blood and for concentrations of aficamten and its metabolites M1a (CK‐3834282) and M1b (CK‐3834283) in plasma and urine by non‐compartmental methods using Phoenix WinNonlin Software (Certara USA, Inc., Princeton, NJ, Version 8.4.0). PK parameters included maximum observed concentration (Cmax), the time to reach maximum concentration (Tmax), terminal elimination half‐life (t1/2), area under the concentration‐time curve from time 0 to the last measurable time point (AUC0‐t), and area under the concentration‐time curve from time 0 to infinity (AUC0‐∞). Additional parameters of apparent total body clearance (CL/F) where F is the bioavailability and apparent volume of distribution during terminal phase (Vz/F) were calculated for aficamten. Descriptive statistics were provided for PK parameters.
Metabolite profiles in plasma were reported as a percent total sample radioactivity and as concentration (ng equivalents/g). For excreta, the percent of the administered dose excreted as the component represented by the peak was calculated by using the following equation: % of dose = (% of radioactivity in peak/100) × % of dose in sample.
The relative exposure of each component was reported as percent of total radioactivity AUC0‐t using the following equation. Relative component exposure as % of total radioactivity AUC0‐t = component AUC0‐t/total radioactivity AUC0‐t × 100.
2.10. Safety assessments
This included vital signs, 12‐lead ECG, clinical chemistry, hematology, urinalysis, and clinical adverse events (AEs). These were performed during the study and following dosing at various time points during the study. AEs were coded using the Medical Dictionary for Regulatory Activities (MedDRA) Version 24.1.
2.11. Statistical analyses
Eight participants were planned to enroll to ensure there were at least 6 evaluable participants. There was no formal statistical assessment of sample size conducted. Safety population included all participants who received any dose of radiolabeled study treatment. PK population included all participants who received a dose of radiolabeled study treatment and had at least 1 valid PK concentration. Descriptive statistics were used to present data.
2.12. Nomenclature of targets and ligands
Key protein targets and ligands in this article are hyperlinked to corresponding entries in http://www.guidetopharmacology.org, the common portal for data from the IUPHAR/BPS Guide to PHARMACOLOGY, 15 and are permanently archived in the Concise Guide to PHARMACOLOGY 2019/20. 16
3. RESULTS
3.1. Demographics
Eight male participants were enrolled and completed the study. The mean age was 33.3 years (range: 22 to 43 years), half of the participants were white (50.0%), majority were not Hispanic or Latino (n = 7; 87.5%) and had a mean BMI of 26.85 kg/m2 (range: 23.4 to 30.0 kg/m2).
3.2. Safety
All 8 participants received a single oral dose of 20 mg aficamten. There were no deaths, and serious AEs or any AEs leading to discontinuation that were reported. One participant (12.5%) experienced an AE of diarrhea which was mild in severity and resolved. It was not considered by the investigator to be related to treatment. There were no clinically significant changes in vital signs, ECG measurements, or laboratory values.
3.3. Pharmacokinetics
3.3.1. PK of aficamten and total radioactivity (TRA)
The mean (±SD) concentrations of aficamten and total radioactivity in plasma and whole blood after oral administration of aficamten are presented in Figure 2. The summary PK parameters for aficamten, main circulating metabolites, and total radioactivity in plasma and blood are presented in Table 2. Following a single oral dose of 20 mg (100 μCi) of aficamten, plasma concentrations of aficamten were characterized by moderate absorption with a median Tmax of 2.0 h (range: 1.0 to 6.0 h) postdose. After reaching Cmax, plasma concentrations declined in a biphasic manner. The median t1/2 of aficamten was 99.6 h (range: 81.5 to 209 h). The geometric mean percentage of the dose administered that was recovered in the urine over 456 h post‐dose as unchanged drug (fe0‐tlast) was 0.554%. The geometric mean (CV%) apparent total clearance (CL/F) and renal clearance CLR values for aficamten were 4.50 L/h (32.1%) and 2.63 mL/h (67.5%), respectively.
FIGURE 2.

Mean plasma concentration‐time profiles for aficamten, plasma total radioactivity, and whole blood total radioactivity profile following administration of a single oral 20‐mg (100 μCi) dose of aficamten (A) (linear scale) and (B) (semilogarithmic scale). H, hour; ng Eq/g, radioactive equivalent concentrations; ng/mL, nanograms/milliliter.
TABLE 2.
Summary of the PK parameters for aficamten and main circulating metabolites and total radioactivity in plasma and blood.
| Analyte | Aficamten | M1a (CK‐3834282) | M1b (CK‐3834283) | Total Radioactivity | |
|---|---|---|---|---|---|
| Matrix | Plasma | Plasma | Plasma | Plasma | Whole Blood |
| AUC0‐inf (h.ng/mL) | 4440 (31.8) | 2610 (52.7) | 4790 (31.5) | 15 300 (26.0) | 8660 (23.7) |
| AUC0‐tlast (h.ng/mL) | 4120 (31.5) | 2380 (61.7) | 4590 (32.6) | 13 700 (28.8) | 5710 (38.5) |
| Cmax (ng/mL) | 61.8 (56.8) | 23.8 (31.1) | 42.3 (29.3) | 111 (43.2) | 66.7 (44.9) |
| tmax (h) | 2.00 (1.00–6.00) | 5.00 (3.00–36.0) |
5.00 (3.00–36.0) |
3.50 (1.00–6.00) |
4.50 (1.00–16.0) |
| t1/2 (h) | 99.6 (81.5–209) | 94.8 (76.8–208) |
95.4 (77.6–180) |
98.2 (80.1–230) |
100 (86.2–171) |
| CL/F (L/h) | 4.50 (32.1) | — | — | — | — |
| Vz/F (L) | 690 (35.0) | — | — | — | — |
Note: Data presented as Geometric mean except for tmax, and t1/2 which are presented as median (range).
Abbreviations: AUC0‐inf, area under the concentration‐time curve from time 0 extrapolated to infinity; AUC0‐tlast, area under the concentration‐time curve from time 0 to the time of the last quantifiable concentration; CL/F, apparent total clearance; Cmax, maximum observed concentration; t1/2, apparent terminal elimination half‐life; tmax, time of the maximum observed concentration; Vz/F, apparent volume of distribution during the terminal phase.
The two major metabolites of aficamten in plasma, M1a (CK‐3834282) and M1b (CK‐3834283), appeared steadily in plasma, with a median tmax value of 5.00 h postdose for both. Plasma exposure to M1a was approximately 44% lower than that of aficamten with geometric mean (CV%) metabolite ratios of 0.562 (49.6%) for AUC0‐inf. The plasma exposure to M1b was similar to aficamten with a geometric mean (CV%) metabolite ratio for AUC0‐inf of 1.03 (24.8%). Elimination t1/2 for both metabolites was comparable to aficamten with a median of 95 h. The fraction of the dose excreted in the urine for both metabolites was low. The geometric mean percentage of the dose administered recovered from time 0 to the time of last quantifiable concentration (fe0‐tlast) was 5.33% for M1a and 2.31% for M1b. The corresponding geometric mean renal clearance was 443 mL/h and 105 mL/h for M1a and for M1b, respectively.
Maximum levels of total radioactivity in plasma and whole blood were attained slightly later than the tmax of aficamten in plasma, with a median tmax of 3.50 h postdose (range: 1.00 to 6.00 h) for plasma total radioactivity and 4.50 h postdose for whole blood total radioactivity (range:1.00 to 16.0 h). Levels of total radioactivity in plasma and whole blood declined biphasically, with a median t1/2 of 98.2 h (range: 80.1 to 230 h) and 100 h postdose (range: 86.2 to 171 h), respectively. The terminal phase t1/2 in both matrices was comparable to the parent compound. The levels of radioactivity were below the limit of quantitation for all participants by 240 h postdose in blood and by 528 h postdose in plasma. The geometric mean ratio of total radioactivity in whole blood: plasma based on AUC0‐inf was 0.566 (range: 0.502–0.664). The geometric mean of plasma aficamten to total radioactivity ratio was 0.290 (range 0.246 to 0.355) for AUC0‐inf.
3.3.2. Mass balance analysis
Following a single oral dose of 20 mg dose containing approximately100uCi of [14C]‐aficamten, the overall mean recovery of radioactivity in urine and feces samples was 89.7% (range: 76.4% to 98.1%) by the end of the sampling period (600 h) of the study. Of the total radioactivity, a mean 57.7% was recovered from the feces and 32.0% was recovered from the urine. Almost all the radiolabeled material voided had been recovered by 336 h postdose for all participants, with a mean recovery of 85.0%. The arithmetic mean cumulative percent of radioactive dose recovered in urine and feces is shown in Table 3 and Figure 3.
TABLE 3.
Cumulative percent of radioactive dose recovered in urine and feces at specified intervals after administration of a single 20‐mg (100‐μCi) oral dose of aficamten to healthy male subjects.
| Sample | Interval | Percent of radioactive dose recovered subject (6013–001001‐) | Mean | SD | |||||||
|---|---|---|---|---|---|---|---|---|---|---|---|
| 001 | 002 | 003 | 004 | 005 | 006 | 007 | 008 | ||||
| Urine | 0–4 h | 0.652 | 0.103 | 0.417 | 0.577 | 0.394 | 0.619 | 0.384 | 0.369 | 0.439 | 0.177 |
| Urine | 0–8 h | 1.87 | 0.604 | 1.46 | 1.59 | 0.612 | 1.81 | 1.29 | 1.02 | 1.28 | 0.497 |
| Urine | 0–12 h | 3.19 | 0.604 | 2.63 | 2.45 | 0.612 | 2.89 | 1.97 | 1.83 | 2.02 | 0.979 |
| Urine | 0–24 h | 6.66 | 2.20 | 4.65 | 4.20 | 2.00 | 5.88 | 4.89 | 3.95 | 4.30 | 1.62 |
| Urine | 0–48 h | 13.4 | 5.36 | 7.73 | 7.03 | 5.78 | 10.7 | 10.4 | 8.07 | 8.55 | 2.73 |
| Urine | 0–72 h | 19.1 | 7.92 | 12.1 | 10.1 | 9.03 | 14.5 | 14.5 | 11.3 | 12.3 | 3.63 |
| Urine | 0–96 h | 24.1 | 8.99 | 16.2 | 13.5 | 11.2 | 17.7 | 18.3 | 14.0 | 15.5 | 4.70 |
| Urine | 0–120 h | 27.4 | 11.2 | 18.0 | 15.7 | 13.7 | 20.5 | 21.1 | 16.4 | 18.0 | 5.03 |
| Urine | 0–144 h | 31.3 | 13.3 | 20.8 | 17.1 | 15.7 | 22.2 | 23.6 | 18.7 | 20.3 | 5.58 |
| Urine | 0–168 h | 34.3 | 14.7 | 22.3 | 18.2 | 17.5 | 24.1 | 25.7 | 20.7 | 22.2 | 6.08 |
| Urine | 0–192 h | 36.9 | 16.1 | 23.8 | 19.2 | 18.6 | 25.5 | 27.2 | 22.3 | 23.7 | 6.48 |
| Urine | 0–216 h | 38.9 | 17.6 | 25.3 | 20.3 | 19.9 | 26.6 | 28.6 | 23.8 | 25.1 | 6.69 |
| Urine | 0–240 h | 40.8 | 18.6 | 27.2 | 21.3 | 20.8 | 27.7 | 29.6 | 25.2 | 26.4 | 6.98 |
| Urine | 0–264 h | 42.5 | 19.7 | 28.6 | 21.9 | 21.6 | 28.5 | 30.6 | 26.2 | 27.5 | 7.22 |
| Urine | 0–288 h | 43.8 | 20.5 | 29.9 | 22.5 | 22.0 | 29.3 | 31.2 | 27.1 | 28.3 | 7.44 |
| Urine | 0–312 h | 44.8 | 20.9 | 30.6 | 22.9 | 22.4 | 30.0 | 31.8 | 27.8 | 28.9 | 7.65 |
| Urine | 0–336 h | 45.7 | 21.8 | 31.4 | 23.2 | 22.7 | 30.5 | 32.3 | 28.4 | 29.5 | 7.77 |
| Urine | 0–360 h | 46.5 | 22.8 | 31.9 | 23.6 | 23.0 | 31.0 | 32.7 | 28.7 | 30.0 | 7.81 |
| Urine | 0–384 h | 47.1 | 23.3 | 32.6 | 24.0 | 23.2 | 31.5 | 33.1 | 29.1 | 30.5 | 7.88 |
| Urine | 0–408 h | 47.5 | 23.9 | 33.0 | 24.2 | 23.5 | 31.8 | 33.4 | 29.4 | 30.8 | 7.90 |
| Urine | 0–432 h | 47.9 | 24.5 | 33.4 | 24.4 | 23.7 | 32.1 | 33.7 | 29.7 | 31.2 | 7.93 |
| Urine | 0–456 h | 48.3 | 24.7 | 33.7 | 24.6 | 23.9 | 32.3 | 33.9 | 29.9 | 31.4 | 7.99 |
| Urine | 0–480 h | 48.5 | 25.1 | 34.1 | 24.8 | – | – | – | – | 31.6 | 8.02 |
| Urine | 0–504 h | 48.7 | 25.4 | 34.4 | 24.9 | – | – | – | – | 31.7 | 8.04 |
| Urine | 0–528 h | 48.9 | 25.6 | 34.6 | 25.0 | – | – | – | – | 31.8 | 8.07 |
| Urine | 0–552 h | 49.1 | 25.8 | 34.8 | 25.1 | – | – | – | – | 31.8 | 8.09 |
| Urine | 0–576 h | 49.2 | 26.0 | 35.0 | 25.2 | – | – | – | – | 31.9 | 8.11 |
| Urine | 0–600 h | ‐ | 26.3 | 35.1 | 25.3 | – | – | – | – | 32.0 | 8.09 |
| Sample | Interval | Percent of radioactive dose recovered subject (6013‐001001‐) | Mean | SD | |||||||
|---|---|---|---|---|---|---|---|---|---|---|---|
| 001 | 002 | 003 | 004 | 005 | 006 | 007 | 008 | ||||
| Feces | 0–24 h | 0.00 | 0.00 | 0.0529 | 2.14 | 0.0658 | 0.0363 | 45.5 | 0.0642 | 5.98 | 16.0 |
| Feces | 0–48 h | 6.81 | 3.69 | 1.09 | 3.45 | 0.0658 | 13.0 | 47.4 | 31.2 | 13.3 | 17.1 |
| Feces | 0–72 h | 14.2 | 32.5 | 16.3 | 30.6 | 50.5 | 24.9 | 51.4 | 42.0 | 32.8 | 14.3 |
| Feces | 0–96 h | 22.4 | 32.5 | 18.9 | 45.9 | 54.2 | 39.9 | 54.1 | 46.6 | 39.3 | 13.6 |
| Feces | 0–120 h | 22.4 | 38.5 | 24.3 | 49.4 | 54.2 | 47.1 | 55.9 | 49.9 | 42.7 | 13.1 |
| Feces | 0–144 h | 33.8 | 38.5 | 26.9 | 52.6 | 59.1 | 50.9 | 55.9 | 52.2 | 46.2 | 11.6 |
| Feces | 0–168 h | 33.8 | 38.5 | 33.6 | 55.5 | 61.6 | 53.1 | 59.4 | 54.3 | 48.7 | 11.5 |
| Feces | 0–192 h | 36.5 | 42.7 | 33.6 | 57.9 | 61.6 | 55.2 | 60.3 | 56.4 | 50.5 | 11.2 |
| Feces | 0–216 h | 37.5 | 44.8 | 33.6 | 59.3 | 63.0 | 56.5 | 61.0 | 57.4 | 51.6 | 11.4 |
| Feces | 0–240 h | 38.2 | 46.5 | 34.1 | 59.3 | 63.7 | 56.5 | 61.7 | 58.9 | 52.4 | 11.3 |
| Feces | 0–264 h | 39.2 | 48.3 | 34.1 | 59.5 | 65.1 | 58.9 | 62.4 | 60.2 | 53.5 | 11.6 |
| Feces | 0–288 h | 40.0 | 48.3 | 35.1 | 60.8 | 65.1 | 58.9 | 62.8 | 60.7 | 54.0 | 11.3 |
| Feces | 0–312 h | 41.3 | 49.8 | 36.2 | 61.6 | 65.9 | 59.2 | 63.2 | 61.5 | 54.8 | 11.1 |
| Feces | 0–336 h | 42.8 | 50.6 | 37.2 | 62.2 | 66.4 | 59.2 | 63.5 | 62.0 | 55.5 | 10.7 |
| Feces | 0–360 h | 42.8 | 51.4 | 37.9 | 62.7 | 66.4 | 60.0 | 63.8 | 62.7 | 56.0 | 10.7 |
| Feces | 0–384 h | 42.8 | 52.3 | 38.5 | 63.1 | 66.4 | 60.4 | 63.8 | 63.1 | 56.3 | 10.6 |
| Feces | 0–408 h | 42.8 | 52.6 | 38.9 | 63.1 | 66.5 | 60.4 | 63.8 | 63.1 | 56.4 | 10.5 |
| Feces | 0–432 h | 44.0 | 53.0 | 39.4 | 63.4 | 66.7 | 60.4 | 64.1 | 63.6 | 56.8 | 10.2 |
| Feces | 0–456 h | 44.3 | 53.0 | 39.9 | 63.6 | 66.9 | 60.9 | 64.2 | 63.8 | 57.1 | 10.2 |
| Feces | 0–480 h | 45.3 | 53.9 | 40.3 | 63.6 | – | – | – | – | 57.4 | 9.86 |
| Feces | 0–504 h | 45.3 | 53.9 | 40.9 | 63.7 | – | – | – | – | 57.5 | 9.74 |
| Feces | 0–528 h | 45.5 | 54.3 | 40.9 | 63.8 | – | – | – | – | 57.6 | 9.68 |
| Feces | 0–552 h | 45.7 | 54.3 | 41.0 | 63.9 | – | – | – | – | 57.6 | 9.63 |
| Feces | 0–576 h | 45.7 | 54.3 | 41.2 | 64.0 | – | – | – | – | 57.6 | 9.59 |
| Feces | 0–600 h | ‐ | 54.5 | 41.3 | 64.1 | – | – | – | – | 57.7 | 9.56 |
Note: Cumulative recovery for each matrix for the subject was included in the calculation of mean and SD for subsequent intervals.
Abbreviations: −, subject discharged from clinical unit; h, hours; SD, standard deviation.
FIGURE 3.

Mean (± standard deviation) cumulative percent of radioactive dose recovered in urine and feces at specified intervals after a single 20 mg (100 μCi) oral dose of aficamten to healthy male subjects.
3.3.3. Metabolite profiling and identification
The proposed biotransformation pathways of aficamten are shown in Figure 4. Aficamten was primarily eliminated by metabolism and to a lesser extent by fecal excretion. Overall, there were 17 metabolites identified after oral administration of [14C]‐aficamten of which 9 were identified. A list of the identified metabolites with LC–MS/MS retention times, characteristic fragment ions, and matrices where the metabolites were detected are shown in Table 4.
FIGURE 4.
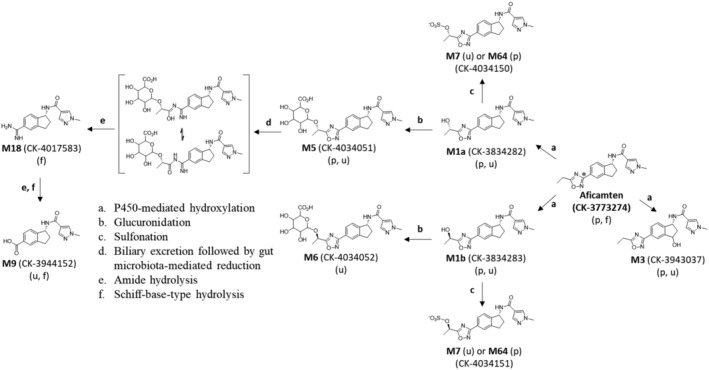
Proposed biotransformation pathways of aficamten in male participants (metabolite indicated in brackets was not identified). (*denotes the site of 14C‐label in the 1,2,4‐oxadiazole moiety at the 3‐position carbon atom).
TABLE 4.
Summary of aficamten metabolites detected in human.
| Metabolite Designation | [M + H]+ or [M‐H]− (m/z) (Retention Time (min) | Metabolite Identification and Characteristic LC–MS/MS fragment ions (m/z) | Matrix | ||
|---|---|---|---|---|---|
| Plasma a | Urine b | Feces b | |||
|
Aficamten CK‐3773274 |
338 [M + H]+ (45.5) |

|
19.8% |
ND |
5.07% |
|
M1 M1a CK‐3834282 and M1b CK‐3834283 Mixture |
354 [M + H]+ (32.7) |
CK‐3834282 CK‐3834283 |
10.5% M1a 36.4% M1b |
6.16% M1a 2.85% M1b |
ND |
|
M3 CK‐3943037 |
354 [M + H]+ (29.8) |

|
0.231% |
3.38 |
ND |
|
M5 CK‐4034051 |
530 [M + H]+ (26.8) |

|
10.3% |
8.02% |
ND |
|
M6 CK‐4034052 |
530 [M + H]+ (25.8) |

|
ND |
0.825% |
ND |
|
M7 (CK‐4034150 or CK4034151) |
432 [M‐H]− (29.5) |
CK‐4034150 CK‐4034151 |
ND |
1.14% |
ND |
|
M9 CK‐3944152 |
284 [M‐H]− (23.8) |

|
ND |
0.177% |
2.74% |
|
M18 CK‐4017583 |
284 [M + H]+ (9.17) |

|
ND |
ND |
44.1% |
|
M64 (CK‐4034150 or CK403451) |
432 [M‐H]− (30.5) |
CK‐4034150 CK‐4034151 |
1.31% |
ND |
ND |


AUC0‐t % of total radioactivity AUC0‐t.
Percent of radioactive dose.
3.3.4. Plasma
A representative radiochromatogram of an AUC‐pooled plasma sample (AUC0‐264h) showed five radioactive peaks (Figure 5A) that were identified as aficamten and its metabolites by comparison with reference standards and by LC–MS/MS analysis. Unchanged aficamten was the second major circulating component and accounted for approximately 19.8% of the total radioactivity exposure (Table 4). There were 3 major human plasma metabolites, M1a, M1b, and M5, detected. Metabolite M1 (an ω‐1‐hydroxylated metabolite of the ethyl group of the ethyl‐1,2,4‐oxadiazol‐3‐yl moiety eluting as a mixture of M1a and M1b diastereoisomers) was the major circulating component and accounted for approximately 46.9% of the total radioactivity exposure. Based on chiral analysis of a 2‐ to 264‐h plasma pool (Figure 6), M1a and M1b accounted for 22.28% and 77.37% of the M1 radioactivity, respectively, resulting in plasma exposures for M1a and M1b that were approximately 10.5% and 36.4% of the total radioactivity AUC, respectively. The third most abundant metabolite in plasma was M5 (an oxygen‐linked glucuronide conjugate of metabolite M1a) and represented approximately 10.3% of the total radioactivity AUC. Two other minor metabolites detected were M3 (a hydroxylated metabolite of the indane‐moiety at benzylic carbon position 3; chiral designation at the 3‐position of M3 is not known) and M64 (a sulfonate conjugate of metabolite M1a or M1b) representing approximately 0.231 and 1.31% of the total radioactive AUC, respectively.
FIGURE 5.

Representative radiochromatograms from analysis of (A) a 24‐h pooled plasma sample, (B) a 0‐ to 384‐h urine sample, and (C) a 0‐ to 168‐h feces sample after a single oral dose of aficamten to male human (20 mg, 100 μCi).
FIGURE 6.

Representative radiochromatogram from analysis (Method 2) of a (A) pooled 2‐ to 264‐h plasma sample and (B) pooled 0‐ to 432‐h urine sample after a single oral dose of aficamten to male humans (20 mg, 100 μCi).
3.3.5. Urine
Metabolite profiles of radioactivity in urine (Figure 5B) consisted of 10 radioactive peaks identified as aficamten metabolites. No unchanged aficamten was recovered in urine. There were no major metabolites (representing >10% of administered dose) in the urine. M5 was the most abundant metabolite representing approximately 8.02% of the radioactive dose. Metabolite M1, mixture of M1a and M1b, accounted for approximately 9.37% of the radioactive dose. Based on chiral chromatographic analysis of a 0‐ to 412‐h urine pool, M1a and M1b accounted for 65.76 and 30.43% of the M1 radioactivity, respectively, resulting in urine percent of dose for M1a and M1b of approximately 6.16% and 2.85% of dose, respectively. Other identified minor metabolites included M3, M6 (an oxygen‐linked glucuronide conjugate of metabolite M1b), M7 (identified as an oxygen‐linked sulfonate conjugate of metabolite M1a or metabolite M1b), and M9 (a 1,2,4‐oxadiazole ring‐cleaved and hydrolyzed metabolite) were less abundant metabolites representing 3.38, 0.885, 1.14, and 0.177% of the radioactive dose, respectively. Trace metabolites (<1% of radioactive dose) included M58, M59, M61, M62, and M65.
3.3.6. Feces
Metabolite profiles of radioactivity in feces (Figure 5C) consisted of 6 radioactive peaks identified as aficamten and 5 metabolites. Unchanged aficamten detected in feces represented approximately 5.07% of the radioactive dose and metabolite M18 (a reductive ring‐cleavage product of the 1,2,4‐oxadiazole moiety of aficamten followed by amide hydrolysis to the imidamide‐type product) was the major component in feces and accounted for approximately 44.1% of the radioactive dose. M9 (formed from subsequent hydrolysis reactions of the imidamide moiety of M18) was a minor metabolite in feces and accounted for approximately 2.74% of the radioactive dose. Trace metabolites (each <1% of the dose) in feces included M60, M63, and M66.
4. DISCUSSION
Aficamten is a next‐in‐class, small‐molecule, selective cardiac myosin inhibitor in Phase 3 development as a potential treatment for symptomatic HCM. In this study, the absorption, metabolism, and elimination of [14C]aficamten was determined in 8 healthy male participants. Aficamten was well tolerated with a safety profile consistent with other Phase 1 aficamten studies.
Following oral administration, the absorption of aficamten was estimated to be moderate, with a median tmax value of 2 h postdose and steady formation of metabolites M1a (median tmax: 5 h postdose) and M1b (median tmax: 5 h postdose). The median t1/2 of aficamten was 99.6 h (range: 81.5 to 209 h). The similar t1/2 observed for these metabolites and total radioactivity in plasma and whole blood suggest that they are formation rate limited. These results also indicate that there are no other long‐lived metabolites present. Plasma concentrations generally remained quantifiable up to 456 h (Day 19) postdose. The geometric mean whole blood/plasma ratio for total radioactivity was 0.566 for AUC0‐inf, indicating that radioactivity did not disproportionately partition into blood components. Additionally, the geometric mean ratios of aficamten, M1a, and M1b to plasma total radioactivity were 0.290, 0.171, and 0.313, respectively, suggesting presence of other circulating metabolites.
Mass balance was achieved as the mean cumulative recovery of the total radioactivity in the urine and feces combined was 89.7% by the end of sample collection (600 h postdose). However, most of the administered dose was recovered by 336 h. The primary route of elimination of radioactivity was feces, with mean recovery of 57.7%. Urinary recovery of unchanged aficamten was low representing 0.554% of the administered dose. Based on this recovery data, the fraction of dose absorbed was at least 0.95. Renal clearance was 2.63 mL/h indicating that the majority of aficamten elimination was through metabolism.
Study results indicate that [14C]aficamten undergoes extensive metabolism which is primarily mediated by hydroxylation followed by subsequent pathways of glucuronidation and hydrolysis to produce 9 identified metabolites. The major circulating components identified in plasma were aficamten and inactive metabolites M1a and M1b followed by M5, the ether‐linked glucuronide metabolite of M1a. The fecal metabolite M18 represented 44.1% of the administered radioactive dose. M18 is proposed to be formed in the intestine primarily from the reductive metabolism of M5 by the gut microbiome based on observations in rat mass balance studies. 17 Following oral dose administration in rat, aficamten absorption was rapid and tissue distribution was extensive resulting in approximately 8% of radioactive dose excreted in urine and approximately 90% by the hepatobiliary route. Aficamten underwent extensive metabolism after oral administration by cytochrome P450‐mediated hydroxylation followed by subsequent glucuronidation and sulfonation, and by reductive 1,2,4‐oxadiazole ring cleavage with subsequent hydrolysis where 11 metabolites were identified. The predominant pathway of aficamten metabolism in rat was by phase 1 followed by phase 2 metabolic pathways leading to the formation of M1 and M5, respectively. As was observed in human, the reductive ring cleaved imidamide‐type metabolite M18 was the major metabolite detected in rat and only in feces from intact rats accounting for 35.3% of the [14C]aficamten radioactive dose, and where the hydroxy‐glucuronide M5 metabolite was not detected in feces. However, in bile duct cannulated rats, biliary excretion, the major route of elimination of radioactivity after oral dosing, metabolite M5 was the major component in bile accounting for 35.2% of the [14C]aficamten radioactive dose, and where no M18 was detected.
The metabolic route of M18 formation in rat was investigated in an in vitro study. The incubations of aficamten‐dosed rat bile containing metabolite M5 with naive rat intestinal contents under anaerobic conditions were examined for its ability to be metabolized to M18. 17 Results showed complete degradation of M5 and corresponding formation of M18. Evidence was obtained that M18 detected in rat feces from aficamten‐dosed rats is formed initially from the P‐450‐mediated metabolism of aficamten to a hydroxylated metabolite M1a, followed by UDP‐glucuronosyl‐mediated glucuronidation of M1a leading to the glucuronide‐linked M5 in rat liver, then biliary excretion of M5 into rat intestine with subsequent metabolism by intestinal microbiota leading to the ring‐cleaved imidamide‐type product M18. Since M5 was the most abundant metabolite excreted in rat bile, presumably the pathway of M18 formation derived from M5 predominates relative to the other minor metabolites also present in bile. In [14C]aficamten‐dosed rat bile, the major metabolite detected was M5 (35.2% of dose). Other less abundant metabolites were M6 (glucuronide conjugate of M1b, 2.59% of dose), and M7 (sulfonate conjugate of M1a/M1b, 9.55% of dose) which may also contribute to M18 formation in the intestine, albeit to a lower extent due to their lower abundance in rat bile and therefore, presumably, lower abundance in rat intestine. In addition, a trace level of aficamten detected in rat bile was completely cleared from the incubation of the rat bile with rat intestinal contents solution. This result, which is consistent with the lack of detection of aficamten in rat feces, implies that parent drug might also be degraded in the intestine presumably to metabolite M18. 17 These assumptions may be true for M18 detected in human feces where metabolite M5 exposure in plasma and excreted in urine predominates over these other metabolites. This proposal of gut‐mediated M18 formation from M5 eliminated into the intestine from bile is strengthened by a recent publication on the metabolism of DS‐8500a, a G protein‐coupled receptor 119 agonist, in monkey and human. Similar to aficamten, the chemical structure of DS‐8500a also contains a 1,2,4‐oxadiazole ring‐moiety that was also shown to undergo reductive ring‐opening by gut microbiome with subsequent hydrolysis to an imidamide‐type product. 18
In conclusion, this study provided a greater understanding of aficamten PK and metabolism. There were no new safety concerns observed. Following oral administration, the recovery of aficamten and its related components from urine and feces was nearly complete, with feces being the principal route of excretion. Oral aficamten was extensively metabolized. These results supported the progression of aficamten to Phase 3 clinical studies.
AUTHOR CONTRIBUTIONS
Participated in Research Design: Xu, Divanji, Griffith, Sukhun, Cheplo, Li, German. Performed Data Analysis: Xu, German, Li. Wrote or Contributed to the writing of the manuscript: Xu, Divanji, Griffith, Sukhun, Cheplo, Li, German.
FUNDING INFORMATION
This work was supported by Cytokinetics and did not receive external funding.
DISCLOSURE STATEMENT
Cytokinetics, Inc. sponsored this research; authors areemployed by and/or hold stock in Cytokinetics.
ETHICS STATEMENT
The study was performed in accordance with ethical principles consistent with the International Conference on Harmonization Good Clinical Practice guidance and the ethical guidelines of the Declaration of Helsinki.
ACKNOWLEDGMENTS
Authors would like to thank Sunila Reddy, Pharm.D. for support with the manuscript writing.
Xu D, Divanji P, Griffith A, et al. Pharmacokinetics, disposition, and biotransformation of the cardiac myosin inhibitor aficamten in humans. Pharmacol Res Perspect. 2024;12:e70006. doi: 10.1002/prp2.70006
Previous Presentations: Xu D, Divanji P, Cheplo K, Li, J, German P. 2023. Disposition and Metabolism of the Cardiac Myosin Inhibitor Aficamten in Humans. Proceedings of a symposium held at the American Association of Pharmaceutical Scientists. 2023, October 22–25; Orlando, FL, United States.
DATA AVAILABILITY STATEMENT
The authors confirm that the data supporting the findings of this study are available within the article and its supplementary materials and can also be obtained from the corresponding author upon reasonable request.
REFERENCES
- 1. Maron MS, Masri A, Choudhury L, et al. Phase 2 study of Aficamten in patients with obstructive hypertrophic cardiomyopathy. J Am Coll Cardiol. 2023;81:34‐45. [DOI] [PubMed] [Google Scholar]
- 2. Rossano JW, Lin KY. Hypertrophic cardiomyopathy: a problem at any age. J Am Coll Cardiol. 2022;79:1998‐2000. [DOI] [PubMed] [Google Scholar]
- 3. Lavarone M, Monda E, Vritz O, et al. Medical treatment of patients with hypertrophic cardiomyopathy: an overview of current and emerging therapy. Arch Cardiovasc Dis. 2022;115:529‐537. [DOI] [PubMed] [Google Scholar]
- 4. Litt MJ, Ali A, Reza N. Familial hypertrophic cardiomyopathy: diagnosis and management. Vasc Health Risk Manag. 2023;19:211‐221. [DOI] [PMC free article] [PubMed] [Google Scholar]
- 5. Malik FI, Robertson LA, Armas DR, et al. A phase 1 dose‐escalation study of the cardiac myosin inhibitor aficamten in healthy participants. JACC Basic Transl Sci. 2022;7:763‐775. [DOI] [PMC free article] [PubMed] [Google Scholar]
- 6. Ommen SR, Mital S, Burke MA, et al. 2020 AHA/ACC guideline for the diagnosis and treatment of patients with hypertrophic cardiomyopathy: executive summary: a report of the American college of cardiology/American Heart Association joint Committee on clinical practice guidelines. Circulation. 2020;142:e533‐e557. [DOI] [PubMed] [Google Scholar]
- 7. Hensley N, Dietrich J, Nyhan D, Mitter N, Yee MS, Brady M. Hypertrophic cardiomyopathy: a review. Anesth Analg. 2015;120:554‐569. [DOI] [PubMed] [Google Scholar]
- 8. Maron BJ, Desai MY, Nishimura RA, et al. Diagnosis and evaluation of hypertrophic cardiomyopathy: JACC state‐of‐the‐art review. J Am Coll Cardiol. 2022;79:372‐389. [DOI] [PubMed] [Google Scholar]
- 9. Chuang C, Collibee S, Ashcraft L, et al. Discovery of Aficamten (CK‐274), a next‐generation cardiac myosin inhibitor for the treatment of hypertrophic cardiomyopathy. J Med Chem. 2021;64:14142‐14152. [DOI] [PubMed] [Google Scholar]
- 10. Teekakirikul P, Zhu W, Huang HC, Fung E. Hypertrophic cardiomyopathy: an overview of genetics and management. Biomol Ther. 2019;9:878. [DOI] [PMC free article] [PubMed] [Google Scholar]
- 11. Norrish G, Cleary A, Field E, et al. Clinical features and natural history of preadolescent nonsyndromic hypertrophic cardiomyopathy. J Am Coll Cardiol. 2022;79:1986‐1997. [DOI] [PMC free article] [PubMed] [Google Scholar]
- 12. Maron BJ, Maron MS, Maron BA, Loscalzo J. Moving beyond the sarcomere to explain heterogeneity in hypertrophic cardiomyopathy: JACC review topic of the week. J Am Coll Cardiol. 2019;73:1978‐1986. [DOI] [PMC free article] [PubMed] [Google Scholar]
- 13. Owens AT, Masri A, Abraham TP, et al. Aficamten for drug‐refractory severe obstructive hypertrophic cardiomyopathy in patients receiving disopyramide: REDWOOD‐HCM cohort 3. J Card Fail. 2023;29:1576‐1582. [DOI] [PubMed] [Google Scholar]
- 14. Xu D, Divanji P, Kim E, et al. Effect of moderate hepatic impairment of moderate hepatic impairment on the pharmacokinetics of Aficamten and its metabolites. Proceedings of a Symposium Held at the American Society for Clinical Pharmacology and Therapeutics. Colorado Springs; 2024:27‐29. [Google Scholar]
- 15. Harding SD, Sharman JL, Faccenda E, et al. The IUPHAR/BPS guide to PHARMACOLOGY in 2018: updates and expansion to encompass the new guide to IMMUNOPHARMACOLOGY. Nucleic Acids Res. 2018;46:D1091‐D1106. [DOI] [PMC free article] [PubMed] [Google Scholar]
- 16. Alexander SPH, Christopoulos A, Davenport AP, et al. The concise guide to PHARMACOLOGY 2023/24: G protein‐coupled receptors. Br J Pharmacol. 2023;180:S23‐S144. [DOI] [PubMed] [Google Scholar]
- 17. Grillo MP, Sukhun R, Bashir M, Ashcraft L, Morgan BP. Pharmacokinetics, mass balance, tissue distribution, metabolism, and excretion of [14C]aficamten following single oral dose administration to rats. Xenobiotica (in Press). FDA (2024) Clinical Pharmacology Considerations for Human Radiolabeled Mass Balance Studies Guidance for Industry, U.S; 2024. Department of Health and Human Services Food and Drug Administration, Center for Drug Evaluation and Research, Silver Spring, MD, Xenobiotica. [DOI] [PubMed] [Google Scholar]
- 18. Makino C, Watanabe A, Kata M, et al. Species differences between rats and primates (humans and monkeys) in complex cleavage pathways of DS‐8500a characterized by 14C‐ADME studies in humans and monkeys after administration of two radiolabeled compounds and in vitro studies. Drug Metab Pharmacokinet. 2022;45:100459. [DOI] [PubMed] [Google Scholar]
Associated Data
This section collects any data citations, data availability statements, or supplementary materials included in this article.
Data Availability Statement
The authors confirm that the data supporting the findings of this study are available within the article and its supplementary materials and can also be obtained from the corresponding author upon reasonable request.