

Summary
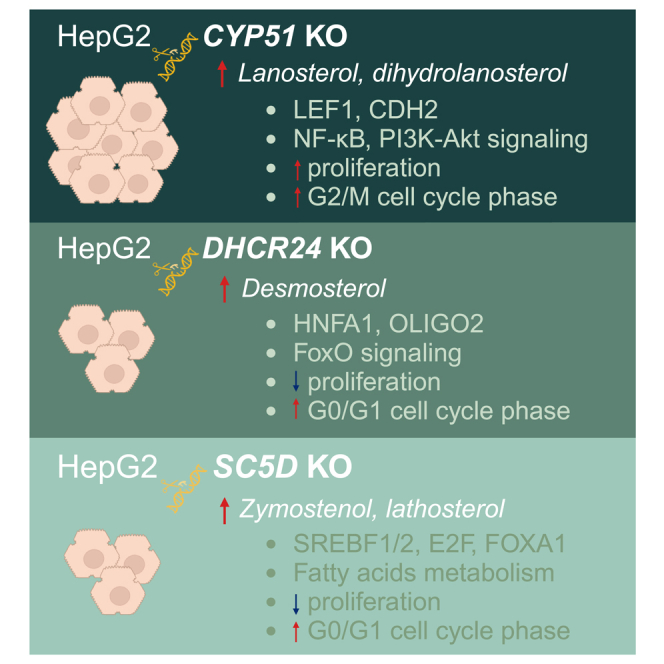
Sterols from cholesterol synthesis are crucial for cholesterol production, but also have individual roles difficult to assess in vivo due to essentiality of cholesterol. We developed HepG2 cell models with knockouts (KOs) for three enzymes of cholesterol synthesis, each accumulating specific sterols. Surprisingly, KOs of CYP51, DHCR24, and SC5D shared only 9% of differentially expressed genes. The most striking was the phenotype of CYP51 KO with highly elevated lanosterol and 24,25-dihydrolanosterol, significant increase in G2+M phase and enhanced cancer and cell cycle pathways. Comparisons with mouse liver Cyp51 KO data suggest 24,25-dihydrolanosterol activates similar cell proliferation pathways, possibly via elevated LEF1 and WNT/NFKB signaling. In contrast, SC5D and DHCR24 KO cells with elevated lathosterol or desmosterol proliferated slowly, with downregulated E2F, mitosis, and enriched HNF1A. These findings demonstrate that increase of lanosterol and 24,25-dihydrolanosterol, but not other sterols, promotes cell proliferation in hepatocytes.
Subject areas: Cellular physiology, Cell biology
Graphical abstract
Highlights
-
•
Only 9% of changed genes are shared among the three sterols KO cell lines
-
•
CYP51A1 KO cells with high (24,25-dihydro)lanosterol show increased proliferation
-
•
DHCR24 and SC5D KO cells with high desmosterol/lathosterol show slower proliferation
-
•
24,25-dihydrolanosterol activate LEF1 in CYP51A1 KO cells
Cellular physiology; Cell biology
Introduction
Cholesterol is by far the most abundant and studied sterol molecule, being a part of cell membranes, as well as a precursor of steroid hormones, bile acids, and oxysterols, all with specific downstream signaling. Cholesterol enhances membrane fluidity and decreases membrane permeability1,2,3 and is involved in the formation of lipid rafts that guide many signaling pathways4 through interaction with proteins with cholesterol binding sites.4,5 Other important roles are connected to cell division and proliferation, with sufficient cholesterol levels being necessary for cell cycle progression from G2 to the M phase.6,7 It is thus not surprising that the mouse full knockouts of cholesterol synthesis genes are either embryonic lethal (Cyp518), stillborn (Sc5d9), or die a few days after birth (Dhcr2410). In humans congenital defects in cholesterol synthesis are rare and result in severe malformations. Examples include desmosterolosis, with defected DHCR24 (24-dehydrocholesterol reductase) that was characterized so far in only 10 patients11 and lathosterolosis with defected SC5D (sterol-C5-desaturase) gene, which is also extremely rare inherited condition associated with progressive liver disease.12 CYP51A1 (cytochrome P450 family 51 subfamily A member 1) has only a few missense mutations and low association with pathologies in humans. Sporadic cases link CYP51A1 gene defects to Antley-Bixler syndrome,13 pediatric cataract,14 global developmental delay, and hepatic failure, where also the heterozygous CYP51A1 variants show damaging phenotypes.15 Even if in all cases the same metabolic pathway (cholesterol synthesis) is disrupted, there are dramatic differences in the disease phenotypes, depending on which sterols accumulate in the patients.11,16,17,18
Despite the potential toxicity of sterol intermediates, cholesterol synthesis represents an important drug targeting pathway for treating hypercholesterolemia,19,20 where an early enzyme HMGCR is targeted. This minimizes the risk of accumulating sterols but can alter other physiological processes.21,22
Another controversy about cholesterol and its homeostasis is in cancer development, with complex results across studies. These studies usually consider just cholesterol and not the potential impact of the non-polar sterols intermediates, from the late part of cholesterol synthesis, that are structurally similar to cholesterol23,24,25,26 (See Figure S1 for detailed cholesterol synthesis and individual sterol structures). Some of the sterols, like desmosterol, can partially replace cholesterol in membranes,27 but not specifically in lipid rafts.28 Some have been proposed as ligands of the nuclear receptor retinoic acid related nuclear receptor C (RORC; zymostenol derivatives)29 and liver X receptor (LXR; desmosterol).30 Lanosterol can reverse protein aggregation in the lens31 and serves as an endogenous regulator that promotes HMGCR (3-hydroxy-3-methylglutaryl-CoA reductase) degradation, while other C4-dimethylated sterols may regulate both HMGCR degradation and SREBP-2 cleavage (sterol regulatory element binding transcription factor 2).29,30,32,33 Lanosterol metabolism mediated by CYP51 is critical for TH17 differentiation since azole-based CYP51 inhibitors decreased TH17 differentiation.34 In contrast, accumulation of the 8,9-unsaturated sterols (such as lanosterol and 24,25-dihydrolanosterol) upon inhibition of CYP51A1 by drugs, promote formation of oligodendrocytes that also include cell division and differentiation.35,36 Additionally 24,25-epoxylanosterol is even more potent in enhancing oligodendrocyte formation, which adds another level of complexity to research of sterol signaling.37 While it was proposed initially that 7-dehydrocholesterol (7-DHC) and derived oxysterols might have toxic effect for cells,38,39 two recent comprehensive studies40,41 showed how 7-DHC have crucial roles in promoting cell survival through inhibiting ferroptosis, an intracellular iron-dependent form of cell death. Collectively, these data demonstrate that different sterols play crucial and often opposing roles in regulating cell proliferation and survival.
Here, we prepared human hepatoma HepG2 cell models in which individual genes encoding the cholesterol synthesis enzymes CYP51A1, DHCR24, and SC5D were disrupted using a CRISPR-Cas9 knockout strategy. Our previous data show that blocking Cyp51 in a liver mouse model leads to the development of liver cancer23 and we aim to further explore the signaling pathways altered by accumulation of lanosterol and 24,25-dihydrolanosterol (see Figure S3 for details). The DHCR24 enzyme acts on the sterols from the Bloch pathway. The ablation of DHCR24 enzyme activity eliminates the sterols from the Kandutsch-Russell pathway, enabling the study of Bloch pathway sterols, especially desmosterol. Ablation SC5D enzyme activity allows for the study of lathosterol, the sterol with the highest concentration besides cholesterol in liver cells.42 We challenge the hypothesis that individual, non-polar sterol intermediates of cholesterol synthesis regulate unique sets of genes and signaling pathways that can be distinguished from their role in producing cholesterol. In both SC5D and DHCR24 KOs we expected elevated RORC signaling activated by desmosterol and/or lathosterol.29,34 Additionally, we investigated the role of sterols in hepatic cell proliferation and cell cycle progression through the regulation of different TFs.
Results
Targeting cholesterol synthesis
CRISPR-Cas9 was used to generate deletion of selected genes from the late part of cholesterol synthesis (CYP51A1, DHCR24, and SCD5). HepG2 single-cell clones were initially validated at the DNA level (Figure S2) from colonies with identical changes on both alleles (homozygous change of the gene in the DNA sequence). The detailed DNA changes, with the positions of the deletions/insertions, the guide sequences for individual gene targeted by CRISPR-Cas9 and their predicted effects on protein sequences are shown in Table S1. The selected colonies were then tested at the mRNA and protein levels (Figure 1). For the CYP51 and DHCR24 genes, an early stop codon was predicted (Table S1) and we were able to completely eliminate mRNA expression and consequently protein levels of CYP51A1 and DHCR24 (Figures 1A and 1B). In the case of targeting the SC5D gene, we introduced a 2bp deletion on both alleles, which did not result in a stop codon; consequently, mRNA and protein were still detected. Nevertheless, changes in the open reading frame and modified amino acid sequence resulted in a non-functional SC5D enzyme which was proven by sterol analysis (Figures 1D–1G). Cytoplasmic and nuclear forms of SREBP2 protein are lowered, especially in the SC5D KO (Figure 1B), suggesting that disrupted cholesterol synthesis did not directly activate its synthesis pathway through SREBP2.
Figure 1.

Expression of CRISPR-Cas9 targeted mRNA and proteins in control HepG2 cells (Native) and in knockout cells of enzymes from the late part of cholesterol synthesis (CYP51 KO, DHCR24 KO, SCD KO)
See Figure S2 for Sanger sequence of selected clones and Table S1 targeted gene region and predicted effect of indel on protein. Bars represent the mean ± SD of three replicates from different cell culture wells.
(A) Relative mRNA expression of targeted genes (CYP51, DHCR24, and SC5D). Expression data were normalized to ACTB, GAPDH, and RPLP0 reference genes (See Table S2 for primers used).
(B) Targeted protein expression by WB (CYP51A1, DHCR24, SC5D, Total SREBP2, H—nuclear - n-SREBP2). 10 μg of proteins were loaded and normalized to total proteins (for un-cropped full blots see Figure S8; Table S3 for antibodies used).
(C) A simplified cholesterol synthesis, with measured sterols from the post-lanosterol part of a synthesis and the position of deleted enzymes in red. The Bloch and Kandutsch-Russell sterol pathways are indicated (See Figure S1 for detailed synthesis pathway; Figure S3 for sterol synthesis in individual genotypes).
(D–G) represent sterols analysis by LC-MS. Sterol concentrations are represented as a mean ± SD (n = 4) and normalized to total amount of proteins (For result normalized to cell number are represented in Table S4). (D) Sterols and epoxylanosterol isolated from control and KO HepG2 cells with concentration normalize to total proteins. (E) Sterols isolated from culture medium. Result medium represent sterols from culture medium used in experiments (DMED +10% LDS +1% P/S with addition of cholesterol 30 μg/mL medium) and other results represent sterols from medium collected after 48 h of cell growth (endpoint). (F) Net weight of sterols calculated from total sterols from cell + medium. (G) Measurements of sterols labeled with deuterium (D6) after addition of lanosterol-D6 to culture medium. For statistical testing Brown-Forsythe and Welch ANOVA tests was used with all groups compared to Native (∗p < 0.1, ∗∗p < 0.05, ∗∗∗p < 0.01, ∗∗∗∗p < 0.001).
Accumulation of sterols upon targeted inactivation of genes from cholesterol synthesis
For sterol intermediate quantification we developed improved method based on our previous work,42 where majority of sterols can be quantified as low as 5 ng/mL (Table 1 in STAR Methods section). Sterols isolated from cells and quantified by LC-MS/MS (Figure 1D) showed that the three targeted enzymes are non-functional. In total we were able to quantify 12 different sterols in native HepG2 cell line from both Bloch and K-R pathway, generally their concentration higher closer to the end of synthesis. In the KO cell lines we detected accumulated sterols that are substrates of the KO targeted enzymes. In the CYP51 KO cells, lanosterol was elevated ∼22x fold compared to native (542 ng/mg of proteins), while 24,25-dihydrolanosterol was extremely elevated with ∼1300x fold increase compared to native (24 μg/mg of proteins). No other cholesterol precursors were present in CYP51 KO cells, with the exception of desmosterol, the source of which is the culture medium used (Figures 1E and 1F). Addition of deuterium labeled lanosterol to CYP51 KO cells showed that cells cannot synthesize cholesterol de novo. The synthesis is stopped with accumulation of 24,25-dihydrolanosterol-D6 (Figure 1G). In the DHCR24 KO cells, sterols from the K-R pathway are completely absent and only sterols from the Bloch synthesis pathway are observed (Figure 1D), with the highest concentration of sterols from the end of synthesis, especially desmosterol with ∼1200x fold changes compared to native) (35 μg/mg proteins). The major sterol in the SC5D KO cells is lathosterol with a ∼100x fold change compared to native cells (57 μg/mg proteins), followed by ∼10x fold change in 24-dehydrolathosterol (240 ng/mg proteins) and ∼6x fold change of zymostenol (1.8 μg/mg proteins). Since the deuterium labeling experiment confirmed that the cells with functional KO cannot synthetize cholesterol (Figure 1G), the cholesterol origin measured in the KO cells is most likely derived from the culture medium. Calculating the total amount of cholesterol in the experiments (cholesterol in cells + medium cholesterol) shows net lower cholesterol in the three KO cell lines compared to native cell line (Figure 1F). Metabolic labeling also showed that only in native cells cholesterol originates from de novo synthesis. In CYP51 KO cell line we were able to detect also 24,25-epoxylanosterol in relatively high concentrations (135 ng/mg proteins). 24,25-epoxylanosterol was previously connected with promoting cell proliferation.37
Table 1.
LC-MS parameters use for detection of sterol metabolites
| Sterol | MRMa | RT (min) | LOQ (ng/mL) | LOD (ng/mL) | CE (V) | Q1 pre bias (V) | Q3 pre bias (V) |
|---|---|---|---|---|---|---|---|
| 24,25-dihydrolanosterol | 411.30 > 191.10 | 14.5 | 5.60 | 1.90 | −17 | −11 | −15 |
| FF-MAS | 393.30 > 309.20 | 12.5 | 4.68 | 1.56 | −23 | −19 | −17 |
| T-MAS | 395.00 > 243.00 | 12.8 | 9.34 | 3.13 | −18 | −20 | −19 |
| Zymosterol | 367.30 > 215.10 | 11.0 | 6.29 | 2.08 | −20 | −13 | −26 |
| Lathosterol | 369.30 > 215.10 | 12.3 | 10.1 | 3.32 | −22 | −13 | −17 |
| 24-dehydrolathosterol | 367.30 > 215.10 | 11.4 | 4.44 | 1.47 | −20 | −13 | −26 |
| Desmosterol | 367.30 > 215.10 | 11.7 | 12.9 | 4.27 | −20 | −13 | −26 |
| Lanosterol | 409.30 > 191.10 | 13.1 | 4.37 | 1.44 | −14 | −11 | −15 |
| Zymostenol | 369.30 > 215.10 | 12.0 | 5.37 | 1.77 | −22 | −13 | −17 |
| 7-dehydrodesmosterol | 365.30 > 199.10 | 11.4 | 4.05 | 1.34 | −18 | −13 | −16 |
| Dehydro-T-MAS | 397.40 > 177.10 | 14.4 | 8.09 | 2.67 | −19 | −11 | −21 |
| Dehydro-FF-MAS | 395.50 > 123.10 | 13.8 | 6.30 | 2.08 | −25 | −11 | −24 |
| Lathosterol-D7 | 376.30 > 215.10 | 12.4 | / | / | −22 | −13 | −17 |
| Cholesterol | 369.30 > 215.10 | 12.8 | 2000b | / | −22 | −13 | −17 |
| 24,25-epoxylanosterol | 425.15 > 95.20 | 9.0 | 6.55 | 2.18 | −30 | −22 | −11 |
MRM, Multiple Reaction Monitoring; RT, Retention Time; LOQ, Limit of Quantification; LOD, Limit of Detection.
For MRM measurements of deuterium labeled sterols (D6), Q1 mass +6 was used, Q3 mass remained the same as in natural sterols).
LOD/LOQ for cholesterol was not tested lower as concentrations in samples are higher.
Gene expression profiling, transcription factor enrichment, and pathway enrichment analysis
After measuring the transcriptome and statistical analysis, differentially expressed genes (DEGs) lists (adjusted p value < 0.05) for each KO cell line were obtained (full list in Tables S6, S7, and S8). All genes were used for the principal-component analysis (PCA) plot (Figure 2A), on which the three KO cell lines cluster separately and away from the native HepG2 cells. Compared to the HepG2 native cell line there were 411 DEGs in CYP51 KO, 542 in DHCR24 KO and 765 DEGs in SC5D KO (Figure 2B). Comparison of DEG lists between the three genotypes showed only 107 DEGs (or 8.9% of total) that are common to all genotypes. This was surprising since the three KO genes belong to the same synthesis pathway. Between 5 and 10% of genes are common to two KO lines, but over 65% of DEGs are changed just in one of the KO cell lines (Figure 2C). These data indicate that majority of DEG in the studied functional KOs affected downstream pathways that are not linked directly to cholesterol but is most likely a consequence of accumulation of specific group of sterols and their signaling. To study further the sterol signaling, we searched for genes with very high log fold change (logFC) that are differentially expressed in just one genotype. In CYP51 KO the CDH2 gene (N-cadherin) is downregulated with a logFC of −3.4. In the DHCR24 KO, CPNE8, EBP, and OXCT1 are highly downregulated, while FREM1 is upregulated. EBP (emopamil binding protein), gene encoding enzyme from late part of sterol synthesis is downregulated just in DHCR24 KO. It is unclear why EBO is changed just in this KO, while SREBP2 is lower to some extent in DHCR24 KO, it is lower also in other KOs (Figure 1B). In the SC5D KO the ZNF385B gene involved in the promotion of apoptosis by TP53 factor43 is extremely upregulated with a logFC of 4.8, while unchanged in CYP51 KO and DHCR24 KO.
Figure 2.

Differential gene expression (DEG) using Clarium S microarrays
(A) PCA (Principal component analysis) of raw gene expression data for all four conditions (Native, CYP51 KO, DHCR24 KO, and SC5D KO), each measurement in three replicates from different cell culture wells.
(B) Number of up, down, and total differently expressed genes in all three genotypes compare to the Native HepG2 cell line after false discovery rate (FDR) correction (adj pvalue<0.05).
(C) Venn diagram of DEGs comparing gene expression between different genotypes.
(D) Venn diagram of changed KEGG pathways comparing different genotypes.
(E) (CYP51 KO), (F) (DHCR24 KO), and (G) (SC5D KO) represent volcano plots of differentially expressed genes, downregulated shown in blue and upregulated in red (FDR<0.05). The top 10 statistically significant genes are labeled.
(H) (CYP51 KO), (I) (DHCR24 KO), and (J) (SC5D KO) represent changes in KEGG metabolic pathways (FDR<0.05), with red showing the pathways that are upregulated and blue those that are downregulated. The # after the pathway name indicates significant change unique for this KOs cell line. See Figures S4–S6 for GSEA enriched pathways.
Kyoto Encyclopedia of Genes and Genomes (KEGG) metabolic pathway analysis showed that more than half of the pathways were significantly changed just in one of the KOs (Figure 2D). These pathways are indicated with # in Figures 2H–2J. Insulin resistance, ECM-receptor interaction, NF-κB, and PI3K-Akt signaling are modulated only in the CYP51 KO cell line. FoxO, insulin and apelin signaling are changed only in DHCR24 KO, while biosynthesis of unsaturated fatty acids, fatty acid metabolism, cellular senescence, and PPAR signaling pathways are a hallmark of the SC5D KO cell line, with fatty acid metabolism genes FADS2, ELOVL6, HSD17B12, and CYP2J2 upregulated. The commonly modulated pathways changed in at least two KOs are mostly linked to disturbed cholesterol synthesis, like steroid biosynthesis and bile secretion.
For enriched transcription factor analyses, we applied Transfac 2.044 and ChEA.45 Methods that use different approaches to propose transcription factor gene regulatory networks based on differentially expressed genes and pathways. The top enriched TFs from both analyses are presented (Figures 3A–3C) (full list in Table S12. Transcription factors enriched using Transfac analysis in CYP51 KO, DHCR24 KO and SC5D KO, related to Figure 3, Table S13. Transcription factors enriched using CHEA3 analysis in CYP51 KO, related to Figure 3, Table S14. Transcription factors enriched using CHEA3 analysis in DHCR24 KO, related to Figure 3, Table S15. Transcription factors enriched using CHEA3 analysis in SC5D KO, related to Figure 3). Based on the ChEA analysis (Figures 3A and 3B) the TF with the lowest p value in all KOs was FOXA2 (also HNF3β), which regulates bile acid metabolism and is associated with ER stress.46,47 Nuclear receptors enriched in all KOs were: LXR, PPARA (peroxisome proliferator activated receptor alpha), and RXR (retinoid X receptor), which are known to act as heterodimers and regulate hepatic lipid homeostasis.48,49 Sterol intermediates and oxysterols were proposed as LXR agonists, with desmosterol being the main sterol agonist, while lanosterol appears not to affect LXR activation.50,51,52 The DHCR24 KO with high desmosterol concentration had the highest LXR enrichment (lowest p value). Our data also indicate activated LXR in CYP51 KO where just lanosterol and 24,25-dihydrolanosterol are present. Based on previous studies it is unlikely that either of lanosterols would activate LXR, but possibly some secondary oxysterols or bile acids originating from accumulated (24,25-dihydro)lanosterol can do so.
Figure 3.

Transcription factor enrichment analysis using ChEA 2022 and TransFac 2.0
(A) The top 20 enriched TFs from each KO cell line were used for visualization of ChEA data.
(B) The Venn diagram of enriched TFs from ChEA analysis, (C) The Venn diagram of enriched TFs from TransFac 2.0 analysis. Number of TFs are in each group is represented. % indicates the fraction of all TFs in this analysis (m.i.—muscle initiator), (D) Common differentially expressed gene in HepG2 and mouse liver specific CYP51A1 KO. Red dots represent upregulated, blue dots downregulated genes and gray dots genes up and downregulated in both experiments. See Figure S12 for enriched KEGG pathways in mouse Cyp51 KO.
Transfac analysis showed TRIM28, TFAP2A, KLF6, and E2F as the main TFs enriched in all KO cell lines with KLF6 and E2F1 also enriched in the SC5D KO in ChEA analysis. KLF6 (Kruppel-like factor 6) is a known tumor suppressor factor that suppress cell proliferation in a TP53-independent manner,53 while E2F1 can promote proliferation and/or apoptosis.54 Complementary to KEGG pathway analysis (Figure 2E), NFKB1 (nuclear factor Kappa B subunit 1) is enriched in both datasets in the CYP51 KO (Figures 3A and 3C), which strongly indicates the potential role of 24,25-dihydrolanosterol (Figure 1) in the activation of the NFKB pathway. NFKB regulates the expression of genes involved in cancer development and progression, such as proliferation, migration, and apoptosis.55 The TFs enriched mainly in the CYP51 KO (Figures 3B and 3C) are connected to proliferation control—ESR1, STAT3, NANOG, and especially TP53,56,57,58,59 together with NFKB, indicate changes in cell growth control in CYP51 KO. LEF1 (lymphoid enhancer binding factor 1), enriched in CYP51 KO and DHCR24 KO, is a part of WNT signaling, connected to increased cell proliferation, epithelial-mesenchymal transition, and cancer progression.60,61,62 Its mRNA and protein levels were highly elevated in the CYP51 KO, as discussed in further detail. The CYP51 and DHCR24 KOs also share enriched CJUN and NR1I2 (also PXR-pregnane X receptor) TFs. The TFs that were mainly enriched in the DHCR24 KO (Figures 3B and 3D) are NR3C1 (also GR-glucocorticoid receptor), HNF1A, TP63, and OLIG2. The latter activates the expression of myelin-associated genes that are normally expressed only in brain tissue and not in the liver. The enrichment of OLIG2 is interesting in the context of recent discoveries showing that 8,9-unsaturated sterols can drive oligodendrocyte formation and remyelination..35 With the largest number of DEGs, the SC5D KO has the highest number of unique enriched TFs. These are: XBP1 an ER stress-related TF active in the unfolded protein response,63 possibly resulting due to errors in SC5D protein folding; SREBF1/2 a TF responsible for regulation of genes responsible for uptake of cholesterol, fatty acids, triglycerides, and phospholipids64; CCND1 (cyclin D1), which controls G1/S cell phase transition65; and EGR1 (early growth response-1) which regulates several tumor suppressor factors and inhibits cell proliferation.66 Similar results were obtained from pathway enrichment analysis (Figures S4–S6). In the CYP51 KO (Figure S4) processes involved in immune response and higher cell proliferation are upregulated, whereas these pathways that enable successful cell division are downregulated in the DHCR24 (Figure S5) and SC5D KOs Figure S6).
Comparing DEGs from the HepG2 CYP51 KO model and the hepatocyte specific Cyp51 KO mouse model23 showed 42 commonly expressed genes (Figure 3D). The Cyp51 hepatocyte KO mice develop hepatocellular carcinoma as they age. Importantly, a number of genes overlapping between the human HepG2 CYP51 KO and the mouse hepatocyte Cyp51 KO, like PIK3R3, SPP1, and RELN, are involved cancer associated pathways. These include ECM-receptor interaction, Focal adhesion, NF-κB signaling pathway and PI3K-Akt signaling, majority of which are common to HepG2 CYP51 KO (Figure 2H) and mouse Cyp51 KO (Figure S12) in KEGG enrichment analysis. In both sets, FOXA1 (also HNF3α) known to promote cell proliferation and hepatocellular carcinoma progression, is downregulated.67,68
Sterols modulate cell proliferation and cell cycle
Based on the transcription factor gene regulatory networks and pathway analysis, we expected major changes in proliferation and cell cycle phase in KO cells. Proliferation assays were performed under different culture medium conditions (see also Figure S7) represented in Figure 4: classic 10% FBS (A), 10% LDS +30 μg/mL cholesterol (B) and 10% LDS (C), LDS- lipid depleted serum. Measuring sterol concentrations in LDS showed that some cholesterol remains present (∼1.4 μg/mL, shown in Table S5) in the delipidated serum. In fetal bovine serum (FBS) which contains cholesterol and sterol intermediates, proliferation of KO cells was not significantly changed compared to native cells and cells grew normally. However, in delipidated serum LDS, CYP51 KO cells grew faster compared to DHCR24 (p = 0.0011) and SC5D KOs (p = 0.0026) at the 72-h time point (statistical significance not indicated on Figure 4A). In both conditions using LDS instead of FBS (Figures 4B and 4C), DHCR24 KO and SC5D KO proliferation slowed significantly at 48 h and 72 h, but CYP51 KO cells grew at nearly the same speed as native cells. To test if the CYP51A1 KO cells remain functional KOs over time, we sampled cells at different passages and sequenced by Sanger sequencing the DNA from the CYP51 gene locus. The sequence analysis confirmed that the CYP51 KO cultures remained KOs in a homozygous state (Figure S11). Especially interesting is the fact that although the KO cells cannot synthesize cholesterol, CYP51 KO cells seem to grow normally for 72 h in culture medium with lipid depleted serum, which only has trace amount of cholesterol. This is not the case for DHCR24 KO and SC5D KO cells where the accumulated sterols (Figure 1) are structurally more similar to cholesterol and can replace cholesterol to some degree, especially in the desmosterol from the DHCR24 KO cells.27 24,25-dihydrolansterol and lanosterol are the first sterols in cholesterol synthesis, structurally most different from cholesterol and can in principle not substitute cholesterol in membranes. Cell cycle analysis (Figure 4D) confirms the result from cell proliferation assays. Compared to native, the DHCR24 KO and especially the SC5D KO have a higher percentage of cells in the G0+G1 cell phase (58% for native cells compared to 63% for the DHCR24 KO and 68% for the SC5D KO), while CYP51 KO (57%) does not differ from native in the G0+G1 phase (Figure 4E). All KOs have a statistically significantly lower percentage of cells in S phase, with the lowest in SC5D KO. Differences between KOs are again seen in G2+M, where DHCR24 KO (22%) and SC5D KO (20%) have lower, but CYP51 KO (28%) a significantly higher percentage of cells in G0+M phase compared to the native (24%). This is consistent with the previous results showing slower growth of DHCR24 KO and SC5D KO cell lines. These results indicate that sterols like desmosterol, lathosterol, and zymostenol in large concentrations could have toxic effects and promote apoptosis. Unexpectedly, lanosterol and 24,25-dihydrolanosterol, structurally most distinct from cholesterol, are in high concentrations not immediately toxic but promote cell proliferation. In concordance are also the data from the transcription factor gene regulatory network and pathway enrichment analysis (Figures S4–S6), where proliferation pathways are upregulated in the CYP51 KO while in DHCR24 and SC5D KOs pathways like E2F, mitosis and regulation of cell cycle, and cell cycle transition are downregulated and HNF1A, which acts as tumor suppressor,69 is enriched.
Figure 4.

Proliferation and cell cycle analysis of HepG2 cell lines
Plots represent the proliferation of HepG2 cell lines in different serum and cholesterol conditions on (A) FBS, (B) LDS +30 μg/mL cholesterol and (C) LDS. See Table S5 for sterol composition of FBS and LDS. The assay was performed using the CCK8 method and data are represented as mean ± SEM (n = 6). Statistical significance was tested using One-way ANOVA with comparison to control, the native cell line result at the same time point, p value - ∗< 0.05, ∗∗< 0.01, ∗∗∗< 0.001, ∗∗∗∗<0.0001. Cell cycle measurements using propidium iodide are represented on (D) as a direct measurement and on (E) results normalized to total cell number (100%) and statistically evaluated. All KOs were compared with control native cell line using the statistical test described above. See Figure S7 for individual genotype proliferation and additional cholesterol concentration tested.
LEF1 from WNT/NFKB pathway, but not RORC, respond to sterol-dependent signaling in HepG2 cells
Measuring the first 40 RORC target genes obtained from70 (Figure S10) did not indicate changes that would depend on accumulating sterols in individual HepG2 KO cell lines. Especially desmosterol and zymosterol are known RORC agonists,29,34 so we expected upregulation of RORC targeted genes in DHCR24 and SC5D KOs and downregulation in the CYP51 KO. Using overexpression of RORC, immunoprecipitation and LC-MS/MS (Figure S9) we aimed to evaluate whether the accumulating sterols can bind to RORC protein in our cell models. However, we could not prove a specific binding.
Based on the expression profiling data and cell growth analysis we further hypothesized that sterols, especially both lanosterols, may modulate the WNT signaling pathway as seen on mouse Cyp51 KO model.23 Figure 5A shows differential expression of genes from the WNT signaling pathway (obtained from the KEGG pathway database, PATHWAY: map04310) as detected by transcriptome analysis, with selected WNT genes measured by quantitative reverse-transcription PCR (RT-qPCR) (Figure 5B). Interestingly, DKK4 is highly upregulated in all KOs and is a WNT pathway antagonist.71 Another WNT antagonist is TLE472 which is highly upregulated in SC5D KO. The RT-qPCR mRNA expression of LEF1, the key transcription factor of WNT signaling is moderately elevated in DHCR24 KO and extremely elevated (17x fold change) in CYP51 KO HepG2 cells, but unchanged in the SC5D KO. LEF1 protein is detected only in the CYP51 KO, in high quantity (Figure 5C). Transcription factors LEF1 and TCFs (T cell factors, not differentially express in our transcriptome data) are the main effectors of WNT signaling, whose transcription is regulated by β-catenin (CTNNB1). When the WNT pathway is active β-catenin stops being translocated to proteasomes for degradation and it is translocated to the nucleus where it binds the LEF1/TCF promoter region. N-cadherin (CDH2) whose mRNA is downregulated (logFC of −3.4) in CYP51 KO can bind to the AXIN1-LRP6 complex and promote β-catenin degradation.73 Looking at WNT signaling proteins (Figure 5C) revealed that majority of them are unchanged. AXIN1 and cytoplasmic β-catenin were lower in CYP51 KO, which could indicate active state of WNT signaling, but nuclear fraction of β-catenin was unchanged. While accumulation of desmosterol, lathosterol, and other downstream sterols caused some changes in WNT genes, the LEF1 protein was not expressed. These data indicate that accumulation of 24,25-dihydrolansterol caused high transcription and translation and (based on TFs enrichment) also activation of LEF1, which is known to promote cell proliferation and epithelial-mesenchymal transition,60,62,74 as seen in CYP51 KO cells and Cyp51 KO mouse. Study in mouse hepatocyte Cyp51 KO also shows enriched LEF1 TF.23 Recent research75 has shown an opposite effect of the plant sterol sitosterol, which lowers cell proliferation by blocking the WNT-LEF1 pathway, indicating that different sterols have unique and sometimes opposite effects on LEF1 signaling.
Figure 5.

Modulation of the WNT signaling pathway
(A) Heatmap of genes from the WNT signaling (obtained from the KEGG database76), as determined by expression profiling with microarrays. White represents genes that are not changed after statistical testing, blue are downregulated and red upregulated genes, with color intensity representing fold change (see Figures S9 and S10 for enriched RORC controlled genes and RORC-sterol immunoprecipitation).
(B) WNT genes measured by RT-qPCR—data are represented as mean ± SD (three replicates from different cell culture wells).
(C) Expression of proteins from the WNT signaling pathway analyzed by western blotting.
(D) Quantification of WB signal for targeted proteins from WNT pathway. Statistical significance was tested using One-way ANOVA with comparison to control—native cell line. p value—∗< 0.05, ∗∗< 0.01, ∗∗∗< 0.001, ∗∗∗∗<0.0001.
Outside the WNT pathway, LEF1 is regulated by the SMAD and NFKB TFs, both enriched in CYP51 KO.77 The NFKB pathway regulates LEF1 by direct binding of NFKB to the LEF1 promoter region.77,78 Besides LEF1, genes regulated by NFKB and changed in CYP51 KO are IL-18, ICAM-1, ICAM2 C3, and LYN (immune response group also changed in GSEA analysis Figure S4). The third mechanism by which LEF1 expression is controlled is by the SMAD TFs, and both SMAD2 and SMAD3 are enriched in CYP51 KO.79 There are some indications that the SMAD and WNT pathways can cooperatively regulate LEF1.80 Considering that WNT and NFKB can also crosstalk and regulate LEF1,81 changes in LEF1 (resulting from 24,25-dihydrolanosterol pile-up) could emerge via one or more of these pathways.
Discussion
Despite cholesterol being one of the most researched molecules, its synthesis pathway still hides unresolved questions, especially in the late part of the synthesis where the sterol ring is already formed. Sterols derived from lanosterol are not only cholesterol precursors but also have additional biological roles that are not yet fully understood. Recently the evidence of importance of individual sterols in controlling—promoting and inhibiting cell proliferation and/or apoptosis is increasing,35,37,40,41 while the mechanisms remain unclear. In our study we applied the HepG2 cell line model and investigated the regulatory roles of different sterols by knocking out consecutive genes from the late part of cholesterol synthesis82,83—CYP51, DHCR24, and SC5D. This resulted in non-functional enzymes, accumulation of sterols upstream of the deleted genes/enzymes, and depletion of downstream sterols. The KO cell lines were unable to synthesize cholesterol. In humans, the errors in the late part of cholesterol synthesis result in mental and physical defects, generally being more severe at the beginning of the post-lanosterol part of synthesis.16 In mouse models, the whole body Cyp51 deletion was embryonically lethal.8 Deletion only in the liver resulted in lanosterol and 24,25-dihydrolansterol accumulation, which led to tumor growth and hepatocellular carcinoma-like symptoms.23,84 Much of our findings in HepG2 CYP51 KO cells where especially 24,25-dihydrolansterol concentration are high, align with results in the mouse models,23 where signaling pathways such as NFKB, PI3K/Akt, epithelial-mesenchymal transition and the cell cycle are altered. Recently, Sax et al.85 performed high-throughput small-molecule screens and tested oligodendrocyte formation. They observed a higher number of living cells and increased proliferation in cells treated with amorolfine, an inhibitor of CYP51A1 and EBP enzymes. This is consistent with our results where the deletion of CYP51 and accumulation of lanosterol and 24,25-dihydrolansterol resulted in HepG2 cells having a higher percentage of cells in G2+M and the same proliferation level as native cells even in lower cholesterol content in the medium. Additionally, only in CYP51 KO we detected 24,25-epoxylanosterol, which can promote cell proliferation37 and could contribute to higher proliferation of these cells. Higher proliferation in CYP51 KO might be explained also by high expression of LEF1, which promotes cell proliferation and has oncogene potential.61 LEF1 can be activated through the WNT pathway, by activation of NFKB81 or by SMADs TFs.77
In contrast to the CYP51 KO, in cells with elevated concentration of desmosterol in DHCR24 KO and lathosterol in SC5D KO, the sterols caused slower proliferation rates and more cells accumulating in G0/1 phase. Although it is not possible to establish beyond doubt that the lower proliferation and cell cycle changes are caused by sterols downstream of zymosterol rather than by lower cholesterol levels, the depletion of which can both promote or inhibit proliferation,86,87 the downstream sterols appear to have a direct effect on cell cycle regulation and proliferation. A possible mechanism is through TFs like factor E2F, which plays a crucial role in the cell cycle control and apoptosis,88 and HNF1A which in hepatocytes suppresses proliferation.69 Recent data reveal the ferroptosis-suppressing role of 7-dehydrocholesterol and the pro-ferroptotic function of the DHCR7 enzyme,40,41 which transforms 7-DHC into cholesterol. In the Bloch pathway, DHCR7 is responsible for the synthesis of desmosterol, where our data indicate promotion of the pro-apoptotic pathway. Interestingly, lathosterol accumulation in SC5D KO caused upregulation of fatty acid metabolism pathways and PPAR signaling. Sterols from the Bloch pathway, especially desmosterol in DHCR24 KO, caused enrichment of OLIG2, a TF usually found in the brain promoting myelination.89 From our experiments in HepG2 cells we were unable to confirm that sterols like desmosterol and zymosterol bind to RORC or activate nuclear receptor RORC as was shown previously for other cell types.29,34 The reason could be that this sterol-RORC interaction does not occur in hepatocytes, more specifically in the HepG2 cell line, or that RORC transcriptional activity was lower compared to other transcriptome changes caused by sterols in KO cells.
In conclusion, the characterized HepG2 cells with functional knockouts of CYP51A1, DHCR24, or SC5D are valuable tools to study the biochemical functions of non-polar sterols from cholesterol synthesis. Our findings, together with previous works, show that sterols from the late part of cholesterol synthesis have distinct biological functions, regulate distinct downstream gene regulatory pathways and most importantly affect cell fate. In HepG2 cells only early sterols can promote cell proliferation, with 24,25-dihydrolanosterol having the largest effect, possible through the LEF1 signaling, while sterols like lathosterol and desmosterol from the end of cholesterol synthesis suppress proliferation. Whether sterols exert their downstream effects through changing the membrane properties, or through receptor-mediated pathways, awaits to be determined.
Key findings
-
•
Distinct gene expression profiles: only 9% of differentially expressed genes are shared among the three KO cell lines with ablated genes from cholesterol synthesis (CYP51A1, DHCR24 or SC5D), indicating the specific roles of individual sterols in gene regulation.
-
•
Cell proliferation and cycle regulation: CYP51A1 KO cells, characterized by elevated 24,25-dihydrolanosterol, exhibit increased cell proliferation and significant changes in cancer and cell cycle pathways. Conversely, DHCR24 and SC5D KO cells, which accumulate desmosterol and lathosterol, show slower proliferation rates and an increase in the G0 phase of cell cycle.
-
•
Elevated 24,25-dihydrolanosterol in CYP51A1 KO cells potentially drives cell proliferation through LEF1 activation, modulated by WNT, NFKB, and SMAD pathways. In contrast, sterols accumulating in DHCR24 and SC5D KO cells, such as desmosterol and lathosterol, may exert pro-apoptotic effects and inhibit cell proliferation.
Limitations of the study
The currents experiments were performed only in HepG2 cells so results may not necessarily apply to other cell types or tissues. The conclusion that 24,25-dihydrolanosterol promotes cell division cannot be directly extrapolated to other models; however, indirect evidence suggests it has similar effects in other cells and tissues. The potentially combined effects of multiple sterols (or oxysterols) were not addressed due to the complexity of studying individual sterol effects in vitro. Precise molecular mechanisms of sterol action need further elucidation.
STAR★Methods
Key resources table
| REAGENT or RESOURCE | SOURCE | IDENTIFIER |
|---|---|---|
| Antibodies | ||
| anti CYP51A1 peptide QRLKDSWAERLDFNPDRY | Custom synthesized (Keber et al.8) | anti CYP51A1 |
| Recombinant Anti-Seladin 1 antibody | Abcam | ab181062; RRID:AB_2832945 |
| Anti-SC5DL antibody | Abcam | ab221764 |
| Anti-SREBP2 | Thermo Fisher Scientific | PA1-338; RRID:AB_2194237 |
| Anti-Wnt5a/b | Cell Signalling Technology | C27E8; RRID:AB_2215595 |
| Anti-Dvl3 | Cell Signalling Technology | 3218; RRID:AB_10694060 |
| Anti-Dvl2 (30D2) | Cell Signalling Technology | 3224; RRID:AB_2093336 |
| Anti-LRP6 (C47E12) | Cell Signalling Technology | 3395; RRID:AB_1950408 |
| Anti- Phospho-LRP6 (Ser1490) | Cell Signalling Technology | 2568; RRID:AB_2139327 |
| Chemicals, peptides, and recombinant proteins | ||
| lanosterol | Avanti Polar Lipids | Cat#700063 |
| 24,25-dihydrolanosterol | Avanti Polar Lipids | Cat#700067 |
| T-MAS | Avanti Polar Lipids | Cat#700073 |
| FF-MAS | Avanti Polar Lipids | Cat#700177 |
| dihydro-T-MAS | Avanti Polar Lipids | Cat#700173 |
| dihydro-FF-MAS | Avanti Polar Lipids | Cat#700173 |
| zymosterol | Avanti Polar Lipids | Cat#700068 |
| zymostenol | Avanti Polar Lipids | Cat#700118 |
| 24-dehydrolathosterol | Avanti Polar Lipids | Cat#700114 |
| lathosterol | Avanti Polar Lipids | Cat#700069 |
| 7-dehydrodesmosterol | Avanti Polar Lipids | Cat#700138 |
| desmosterol | Avanti Polar Lipids | Cat#700060 |
| cholesterol | Merck | Cat#C3045 |
| lathosterol-D7 | Avanti Polar Lipids | Cat#700056 |
| Lanosterol-D6 | Avanti Polar Lipids | Cat#700090 |
| 24(S/R) 25-epoxylanosterol | Avanti Polar Lipids | Cat#792747 |
| Lipid depleted serum (LDS) | Biosera inc | Cat#FB-1001L/100 |
| TRI Reagent® RNA Isolation Reagent | Sigma-Aldrich | Cat# T9424 |
| Critical commercial assays | ||
| Agilent RNA 6000 Nano Kit | Agilent Technologies | Cat# 5067-1511 |
| Human Clariom™ S Assay | Thermo Fisher Scientific | Cat# 902927 |
| QuantiNova Reverse Transcription Kit | Qiagen | Cat# 205411 |
| SYBR Green I Master | Roche | Cat# 04887352001 |
| No-Stain Protein Labeling Reagent | Invitrogen | Cat#A44717 |
| Deposited data | ||
| Raw and analyzed data | This paper | GEO GSE221582 |
| Experimental models: Cell lines | ||
| HepG2 cell line | Synthego/This paper | Native |
| HepG2 CYP51A1 KO | Synthego/This paper | CYP51 KO |
| HepG2 DHCR24 KO | Synthego/This paper | DHCR24 KO |
| HepG2 SC5D KO | Synthego/This paper | SC5D KO |
| Software and algorithms | ||
| GraphPad Prism 10.2.2 | https://www.graphpad.com | GraphPad Software |
| Venny 2.0 | https://bioinfogp.cnb.csic.es/tools/venny/index.htm | Venny 2.0 |
| Biorender | https://www.biorender.com/ | Biorender |
| ToppGene Suite | https://toppgene.cchmc.org/ | ToppGene Suite |
Resource availability
Lead contact
Further information and requests for resources and reagents should be directed to and will be fulfilled by the lead contact, Damjana Rozman (damjana.rozman@mf.uni-lj.si).
Materials availability
KO cell lines generated in this manuscript are available upon request.
Data and code availability
-
•
The expression profiling data have been deposited in GEO: GSE221582 and are publicly available. Lists of differentially expressed genes, KEGG enriched pathways and ChEA/Transfac enriched transcription factor are available in Supplementary data. Original western blot images are seen in Figure S8.
-
•
No original code has been produced in this manuscript.
-
•
Any additional information required to reanalyze the data reported in this paper is available from the lead contact upon request.
Experimental model and study participant details
Preparation of knock-out cells
HepG2 (human male liver cancer cell line, Synthego, Menalo Park, CA, USA) with CRISPR-Cas9 mediated deletion of one of the enzymes from cholesterol synthesis (CYP51A1, DHCR24 and SC5D) and the Native cell line were ordered from Synthego (Synthego, Menalo Park, CA, USA) with certificate of authentication and negative mycoplasma test. Cells were provided as a mixed culture on which the CRISPR-Cas9 reaction was performed (Figure S2) and were seeded 1 cell per well on a 96-well plate to obtain single cell colonies. Each colony was expanded, and the target gene region was PCR amplified and sequenced using Sanger sequencing (targeted regions are in Table S1). The deletions that caused frameshifts (predicted with the Expasy translate tool90) were chosen, target gene expression measured using RT-qPCR (described in 3.3), and protein expression tested by western blot using specific antibodies (See 3.4). As a final control, sterols were isolated from KO cell lines and sterol intermediates quantified by LC-MS/MS as described in 3.5 and 3.6 and previously by our group.42
Cell culture condition
Cells were plated on 6-well plates and kept for 24 h in normal culturing conditions (37°C, 5% CO2) in Dulbecco’s Modified Eagle’s Media (DMEM) high glucose, with 10% FBS (Fetal Bovine Serum) and 1% P/S (Penicillin-Streptomycin, all from Sigma-Aldrich®). After 24 h, culture medium was removed, cells were washed 2 times with PBS, and DMEM with 10% lipid depleted serum (Biosera inc., France) and 1% P/S with 30 μg/ml of cholesterol (Sigma Aldrich) dissolved in 100% ethanol was added. This cell culture medium was used to reduce the effects of sterol intermediates naturally present in FBS. After 48 h in lipid depleted medium, cells were washed with PBS and RNA isolated using Tri Reagent (Sigma Aldrich) following the commercial protocol.
Method details
Gene expression analyses
For gene expression measurements all 4 cell lines (KOs and Native HepG2) were seeded on 6-well plates (1.5x10ˆ5/well) and cultured as described in 3.2. After 48 h in lipid depleted medium, cells were washed 2 times using 1x PBS. RNA was isolated using Tri Reagent (Sigma-Aldrich®) following the commercial protocol. RNA concentration and purity were measured using Nanodrop ND-1000 and RNA integrity (RIN) using Agilent 2100 Bioanalyses. Human Clariom™ S Assay (Thermo Fisher Scientific) microarrays were used to determine the transcriptome profiles. All KO lines were processed in triplicates. ToppGene Suite (https://toppgene.cchmc.org/ ) was used to transform mouse gene names to humane in order to enable direct comparison. The expression of selected genes was measured by RT-qPCR (LightCycler 480; Roche), cDNA was prepared from 1 μg of RNA using QuantiNova Reverse Transcription Kit (Qiagen). SYBR Green I Master (Roche) was used for detection. Primer pairs for selected genes are listed in Table S2.
Protein isolation and western blot
Total proteins were isolated using RIPA buffer; nuclear and cytoplasmic proteins were isolated according to Shreiber et al..91 All lysis buffers were supplemented with PhosSTOP and cOmplete-mini protease inhibitor cocktail (both Roche). Protein concentration was measured by a Pierce BCA Protein Assay Kit (Thermo Scientific, USA). For protein separation Mini-PROTEAN TGX Stain-Free Precast Gels (Bio-Rad Laboratories, CA, USA) were used and then transferred to Immobilon-P PVDF Membrane (Millipore, MA, USA). For total protein normalization, No-Stain Protein Labeling Reagent (Invitrogen, MA, USA) was used to stain PVDF membrane, which was then blocked using 5% milk or BSA in TBST for 1 h at room temperature. Membranes were incubated with primary antibodies (antibodies and dilutions used are represented in Table S3) overnight at 4°C, washed 3 times with TBST for 5 min and incubated with secondary antibodies for 1 h at room temperature. After washing 3 times with TBST, proteins were imaged using Immobilon Classico Western HRP substrate or Immobilon Ecl Ultra Western HRP substrate (Millipore, MA, USA) on the iBright FL1500 Imaging System (Invitrogen, MA, USA) and quantified using Image J software (ImageJ, U. S. National Institutes of Health, Bethesda, Maryland, USA). All data are normalized to total protein staining.
Sterol isolation
Sterols were isolated following the protocol described in our previous work.42 Briefly, 2x10⁶ of HepG2 cell lines (Native and 3 KO lines) were plated on a T75 culture flask for each sterol isolation (n=4 per genotype). Cells were cultured in classic DMEM medium with 10% FBS and 1% P/S. After 24 h, the cell medium was replaced with DMEM containing 10% LDS (Lipid depleted serum, Biosera inc.), 30 μg/ml cholesterol (C3045, Sigma Aldrich, Sigma Grade, ≥99%) and 1% P/S to eliminate the effect of sterol intermediates from classic FBS. After 48 h, media was collected for sterol analysis and cells were washed two times with PBS, detached using 1 mL of Trypsin (Sigma Aldrich), resuspended in 5 mL of DMEM without FBS and transferred to a 15 mL glass vial with a Polytetrafluoroethylene (PTFE) cap and cells counted for normalization. To each sample, 200 ng of internal standard Lathosterol-D7 (Avanti Polar Lipids) was added. Sterols were first hydrolysed using NaOH in ethanol for 1 h on 65°C, isolated using cyclohexane extraction, followed by evaporation on vacuum centrifuge and final resuspension of sterols in 300 μl of methanol and transferred to HPLC vials.
LC-MS/MS sterol quantification
Sterol isolation and analysis was performed using improved version of method described in.42 Sterols were separated on column with F5 stationary phase (Kinetex 2.6 μm F5 100 Å 150 x 2.1 mm) on a Shimadzu Nexera XR HPLC. The mobile phase consisted of solvent A (water with 0.05% formic acid) and solvent B (methanol/1-propanol/formic acid, 90/10/0.05%). The gradient program was as follows: 0-3 min, 75% B; 3-5 min, linear increase to 90% B; 5-18 min held at 90% B, 18 min drop to 75 % B followed by 18-20 min re-equilibration at 75% B. The flow rate was maintained at 0.15 mL/min throughout the run. HPLC was connected to a Shimadzu 8050 Triple Quadrupole Mass Spectrometer for detection. For ionization, APCI (Atmospheric-pressure chemical ionization) was used in positive mode and detection was made in MRM (Multiple reaction monitoring) mode, all details of method in Table 1. The sample concentration was normalized on an internal standard (Lathosterol-d7) and sterol concentrations calculated corresponding to standards from Avanti Lipids (Avanti Polar Lipids, Alabaster, AL, USA).
Cell cycle analysis and proliferation assays
Proliferation assays were performed using Cell Counting Kit-8 (CCK8, Dojindo Molecular Technologies, Rockville, MD, USA) according to the manufacturer’s protocol. Different culture medium conditions were tested (10% FBS, 10% LDS, 10% LDS + 30 μg/ml of cholesterol) and cells were grown for up to 72 h in 6 biological replications at 5000 cell/well on a 96-well plate. After 2 h of incubation of the reagent with cells, absorbance at 450nm was measured on an Epoch Microplate Spectrophotometer (Synergy-BioTek, USA).
Cell cycle analysis was performed on 6 well plates (1.5x10ˆ5 cells/well) in culture conditions as described in 3.2. After 48 h in lipid depleted medium, cells were washed with PBS, harvested by trypsinization, and fixed in 70% ice-cold ethanol at 4°C for 2 h. After fixation, cells were washed and resuspended in 300 μL propidium iodide (PI) staining solution (0.1% Triton X-100, 0.1 mg/mL RNase, 0.125 μg/mL PI) for 30 min at room temperature in the dark. Cell cycle distribution was analysed using the BD FACSCanto II system (BD Biosciences, San Jose, California, US), with the BD FACSDiva™ software (BD Biosciences, San Jose, California, US). The assay was repeated in 3 independent measurements each time in 6 technical repeats (n=6).
Quantification and statistical analysis
Transcriptome data analysis
The quality of the raw microarray data was assessed as follows. Firstly, microarray images were visually inspected for any visible aberrations. Further quality assessment was then done using the arrayQualityMetrics function of the arrayQualityMetrics library, and the RLE (Relative Log Expression) and NUSE (normalised unscaled standard errors) functions of the oligo library. All microarrays passed the quality checks. Array data was then processed for background correction, normalisation and summarisation using the robust multichip average algorithm (rma) in the Oligo library. Differentially expressed genes were determined by linear models using the Limma Bioconductor package (Full list in Tables S9, S10, and S11). Analysis for KEGG enrichment of gene sets was performed using the clusterProfiler library. A 5% level of significance was accepted after correcting for multiple testing using the BH-FDR (Benjamini-Hochberg False Discovery Rate) method (Tables S6, S7, and S8). All analyses were performed in R v4.0.2. Data was deposited in GEO (Gene Expression Omnibus) under accession number GSE221582.
Enrichment of pathways and transcription factors
For Transcription Factor Enrichment Analysis two databases were used: TRANSFAC 2.044 and ChIP-x Enrichment analysis 2022 (ChEA).45 Release 2022.2 of the TRANSFAC MATRIX TABLE was used for TRANSFAC using input lists of differentially expressed genes for each KO cell line individually. For the background sequencing file 10.000 genes for the equivalent KO with the highest p-values were used. The TRANSFAC profile Vertebrate_non_redundant_minFP was used as a matrix, and a p-value < 0.01 was used as a cut-off for statistically significant enriched TFs. Chea analysis was done using the Enrichr online tool92,93 (https://maayanlab.cloud/Enrichr/). For each KO a list of differentially expressed genes (DEGs) was used as input. The top 20 TFs for each KO cell line are represented in Figure 4 and a full list is presented in Table S12 (Transfac) and S12-14 (ChEA).
Pathway enrichment analysis
The GSEA 4.1.0 (Gene Set Enrichment Analysis) method was used for pathway enrichment analysis94,95 and results were visualized by Cytoscape software 3.8.0.96 All parameters were used as detailed in.97 In short, a ranked gene list of all detected genes for each cell line was used as input and analysed in GSEA with 1000 permutations to obtain enriched pathways. The statistically significant (FDR<0.01) positive and negative enriched gene sets were obtained and clustered into nodes using Cytoscape and EnrichmentMap. The AutoAnotate function was used to describe the obtained clusters and then additionally manually curated. Results are illustrated in Figures S4–S6.
Statistical analysis
To evaluate results obtained from different cell lines, a Brown-Forsythe and Welch ANOVA test was used with multiple comparison against the Native cell line. The significance levels were defined as: ∗ p < 0.05, ∗∗ p < 0.01, ∗∗∗ p < 0.001, and ∗∗∗∗ p < 0.0001. Unless otherwise stated results are presented as mean +/- standard deviation (error bars). Number of technical/biological replicates used are represented in legends of individual results. Analysis and visualization were performed in GraphPad Prism 10.2.2 (GraphPad Software, San Diego, CA, USA). The statistics for microarray data, enrichment analyses and pathway enrichment analysis were performed separately as described. Venn diagrams were prepared using the Venny 2.1.0 platform (https://bioinfogp.cnb.csic.es/tools/venny/index.html). Figures were prepared in BioRender (https://www.biorender.com/).
Acknowledgments
Funding: This work was funded by the Slovenian Research Agency (ARRS) program grants P1-0390, IP-022 MRIC-Elixir, MRIC-CFGBC and project grant J1-9176. We thank John Hancock for reviewing the English language in the final manuscript.
Author contributions
Conceptualization, D.R. and C.S.; investigation, C.S., H.T., P.N., T.K., K.P., and S.P.; formal analysis and visualization, C.S., A.W., and K.P.; writing – original draft, C.S. and D.R.; writing – review & editing, D.R., C.S., H.T., T.K., and T.R.; funding acquisition and project administration, D.R. and A.I., graphical abstract design H.T.
Declaration of interests
Authors declare no competing interests.
Published: August 3, 2024
Footnotes
Supplemental information can be found online at https://doi.org/10.1016/j.isci.2024.110651.
Supplemental information
References
- 1.Simons K., Ikonen E. How cells handle cholesterol. Science. 2000;290:1721–1726. doi: 10.1126/science.290.5497.1721. [DOI] [PubMed] [Google Scholar]
- 2.Brown A.J., Sharpe L.J. Sixth Edition. Elsevier; 2016. Cholesterol Synthesis. [DOI] [Google Scholar]
- 3.Skubic C., Rozman D. In: Mammalian Sterols : Novel Biological Roles of Cholesterol Synthesis Intermediates, Oxysterols and Bile Acids. Rozman D., Gebhardt R., editors. Springer International Publishing; 2020. Sterols from the Post-Lanosterol Part of Cholesterol Synthesis: Novel Signaling Players; pp. 1–22. [DOI] [Google Scholar]
- 4.Pike L.J. Lipid rafts: Bringing order to chaos. J. Lipid Res. 2003;44:655–667. doi: 10.1194/jlr.R200021-JLR200. [DOI] [PubMed] [Google Scholar]
- 5.Bukiya A.N., Dopico A.M. Common structural features of cholesterol binding sites in crystallized soluble proteins. J. Lipid Res. 2017;58:1044–1054. doi: 10.1194/jlr.R073452. [DOI] [PMC free article] [PubMed] [Google Scholar]
- 6.Fernández C., Lobo Md M.d.V.T., Gómez-Coronado D., Lasunción M.A. Cholesterol is essential for mitosis progression and its deficiency induces polyploid cell formation. Exp. Cell Res. 2004;300:109–120. doi: 10.1016/j.yexcr.2004.06.029. [DOI] [PubMed] [Google Scholar]
- 7.Rodríguez-Acebes S., de la Cueva P., Fernández-Hernando C., Ferruelo A.J., Lasunción M.A., Rawson R.B., Martínez-Botas J., Gómez-Coronado D. Desmosterol can replace cholesterol in sustaining cell proliferation and regulating the SREBP pathway in a sterol-Δ 24-reductase-deficient cell line. Biochem. J. 2009;420:305–315. doi: 10.1042/BJ20081909. [DOI] [PMC free article] [PubMed] [Google Scholar]
- 8.Keber R., Motaln H., Wagner K.D., Debeljak N., Rassoulzadegan M., Ačimovič J., Rozman D., Horvat S. Mouse knockout of the cholesterogenic cytochrome P450 lanosterol 14alpha-demethylase (Cyp51) resembles Antley-Bixler syndrome. J. Biol. Chem. 2011;286:29086–29097. doi: 10.1074/jbc.M111.253245. [DOI] [PMC free article] [PubMed] [Google Scholar]
- 9.Krakowiak P.A., Wassif C.A., Kratz L., Cozma D., Kovárová M., Harris G., Grinberg A., Yang Y., Hunter A.G.W., Tsokos M., et al. Lathosterolosis: an inborn error of human and murine cholesterol synthesis due to lathosterol 5-desaturase deficiency. Hum. Mol. Genet. 2003;12:1631–1641. doi: 10.1093/hmg/ddg172. [DOI] [PubMed] [Google Scholar]
- 10.Mirza R., Hayasaka S., Takagishi Y., Kambe F., Ohmori S., Maki K., Yamamoto M., Murakami K., Kaji T., Zadworny D., et al. DHCR24 gene knockout mice demonstrate lethal dermopathy with differentiation and maturation defects in the epidermis. J. Invest. Dermatol. 2006;126:638–647. doi: 10.1038/sj.jid.5700111. [DOI] [PubMed] [Google Scholar]
- 11.Rohanizadegan M., Sacharow S. Desmosterolosis presenting with multiple congenital anomalies. Eur. J. Med. Genet. 2018;61:152–156. doi: 10.1016/j.ejmg.2017.11.009. [DOI] [PMC free article] [PubMed] [Google Scholar]
- 12.Prasun P., Ferguson E., Iverson A., Cork E., Dolinger M., Ward S.C., Arnon R. Lathosterolosis: An Extremely Rare Inherited Condition Associated With Progressive Liver Disease. J. Pediatr. Gastroenterol. Nutr. 2019;69:e142–e145. doi: 10.1097/MPG.0000000000002434. [DOI] [PubMed] [Google Scholar]
- 13.Kelley R.I., Kratz L.E., Glaser R.L., Netzloff M.L., Wolf L.M., Jabs E.W. Abnormal sterol metabolism in a patient with Antley-Bixler syndrome and ambiguous genitalia. Am. J. Med. Genet. 2002;110:95–102. doi: 10.1002/ajmg.10510. [DOI] [PubMed] [Google Scholar]
- 14.Patel N., Anand D., Monies D., Maddirevula S., Khan A.O., Algoufi T., Alowain M., Faqeih E., Alshammari M., Qudair A., et al. Novel phenotypes and loci identified through clinical genomics approaches to pediatric cataract. Hum. Genet. 2017;136:205–225. doi: 10.1007/s00439-016-1747-6. [DOI] [PMC free article] [PubMed] [Google Scholar]
- 15.Režen T., Ogris I., Sever M., Merzel F., Golic Grdadolnik S., Rozman D. Evaluation of Selected CYP51A1 Polymorphisms in View of Interactions with Substrate and Redox Partner. Front. Pharmacol. 2017;8:417. doi: 10.3389/fphar.2017.00417. [DOI] [PMC free article] [PubMed] [Google Scholar]
- 16.Porter F.D., Herman G.E. Malformation syndromes caused by disorders of cholesterol synthesis. J. Lipid Res. 2011;52:6–34. doi: 10.1194/jlr.R009548. [DOI] [PMC free article] [PubMed] [Google Scholar]
- 17.Rojare C., Opdenakker Y., Laborde A., Nicot R., Mention K., Ferri J. The Smith–Lemli–Opitz syndrome and dentofacial anomalies diagnostic: Case reports and literature review. Int. Orthod. 2019;17:375–383. doi: 10.1016/j.ortho.2019.03.020. [DOI] [PubMed] [Google Scholar]
- 18.Rozman D., Monostory K. Perspectives of the non-statin hypolipidemic agents. Pharmacol. Ther. 2010;127:19–40. doi: 10.1016/j.pharmthera.2010.03.007. [DOI] [PubMed] [Google Scholar]
- 19.Ogura S., Yoshida Y., Kurahashi T., Egawa M., Furuta K., Kiso S., Kamada Y., Hikita H., Eguchi H., Ogita H., et al. Targeting the mevalonate pathway is a novel therapeutic approach to inhibit oncogenic FoxM1 transcription factor in human hepatocellular carcinoma. Oncotarget. 2018;9:21022–21035. doi: 10.18632/oncotarget.24781. [DOI] [PMC free article] [PubMed] [Google Scholar]
- 20.Yang J., Wang L., Jia R. Role of de novo cholesterol synthesis enzymes in cancer. J. Cancer. 2020;11:1761–1767. doi: 10.7150/jca.38598. [DOI] [PMC free article] [PubMed] [Google Scholar]
- 21.Wages P.A., Kim H.-Y.H., Korade Z., Porter N.A. Identification and characterization of prescription drugs that change levels of 7-dehydrocholesterol and desmosterol. J. Lipid Res. 2018;59:1916–1926. doi: 10.1194/jlr.M086991. [DOI] [PMC free article] [PubMed] [Google Scholar]
- 22.Coates H.W., Capell-Hattam I.M., Olzomer E.M., Du X., Farrell R., Yang H., Byrne F.L., Brown A.J. Hypoxia truncates and constitutively activates the key cholesterol synthesis enzyme squalene monooxygenase. Elife. 2023;12 doi: 10.7554/elife.82843. [DOI] [PMC free article] [PubMed] [Google Scholar]
- 23.Cokan K.B., Urlep Ž., Lorbek G., Matz-Soja M., Skubic C., Perše M., Jeruc J., Juvan P., Režen T., Rozman D. Chronic disruption of the late cholesterol synthesis leads to female-prevalent liver cancer. Cancers. 2020;12:3302. doi: 10.3390/cancers12113302. [DOI] [PMC free article] [PubMed] [Google Scholar]
- 24.Silvente-Poirot S., Poirot M. Cholesterol and Cancer, in the Balance. Science. 2014;343:1445–1446. doi: 10.1126/science.1252787. [DOI] [PubMed] [Google Scholar]
- 25.Ding X., Zhang W., Li S., Yang H. The role of cholesterol metabolism in cancer. Am. J. Cancer Res. 2019;9:219–227. [PMC free article] [PubMed] [Google Scholar]
- 26.Zhao Z., Liu X., Xiang Y., Hou Z., He K., Zhong G., Hu J., Cai D., Liu Y., Ren J., et al. Inhibiting cholesterol de novo synthesis promotes hepatocellular carcinoma progression by upregulating prostaglandin E synthase 2-mediated arachidonic acid metabolism under high fatty acid conditions. Cancer Sci. 2024;115:477–489. doi: 10.1111/cas.16035. [DOI] [PMC free article] [PubMed] [Google Scholar]
- 27.Huster D., Scheidt H.A., Arnold K., Herrmann A., Müller P. Desmosterol may replace cholesterol in lipid membranes. Biophys. J. 2005;88:1838–1844. doi: 10.1529/biophysj.104.048926. [DOI] [PMC free article] [PubMed] [Google Scholar]
- 28.Vainio S., Jansen M., Koivusalo M., Róg T., Karttunen M., Vattulainen I., Ikonen E. Significance of sterol structural specificity: Desmosterol cannot replace cholesterol in lipid rafts. J. Biol. Chem. 2006;281:348–355. doi: 10.1074/jbc.M509530200. [DOI] [PubMed] [Google Scholar]
- 29.Santori F.R., Huang P., Van De Pavert S.A., Douglass E.F., Leaver D.J., Haubrich B.A., Keber R., Lorbek G., Konijn T., Rosales B.N., et al. Identification of Natural RORg Ligands that Regulate the Development of Lymphoid Cells. Cell Metab. 2015;21:286–297. doi: 10.1016/j.cmet.2015.01.004. [DOI] [PMC free article] [PubMed] [Google Scholar]
- 30.Muse E.D., Yu S., Edillor C.R., Tao J., Spann N.J., Troutman T.D., Seidman J.S., Henke A., Roland J.T., Ozeki K.A., et al. Cell-specific discrimination of desmosterol and desmosterol mimetics confers selective regulation of LXR and SREBP in macrophages. Proc. Natl. Acad. Sci. USA. 2018;115:E4680–E4689. doi: 10.1073/pnas.1714518115. [DOI] [PMC free article] [PubMed] [Google Scholar]
- 31.Zhao L., Chen X.-J., Zhu J., Xi Y.-B., Yang X., Hu L.-D., Ouyang H., Patel S.H., Jin X., Lin D., et al. Lanosterol reverses protein aggregation in cataracts. Nature. 2015;523:607–611. doi: 10.1038/nature14650. [DOI] [PubMed] [Google Scholar]
- 32.Chen L., Ma M.Y., Sun M., Jiang L.Y., Zhao X.T., Fang X.X., Man Lam S., Shui G.H., Luo J., Shi X.J., Song B.L. Endogenous sterol intermediates of the mevalonate pathway regulate HMGCR degradation and SREBP-2 processing. J. Lipid Res. 2019;60:1765–1775. doi: 10.1194/jlr.RA119000201. [DOI] [PMC free article] [PubMed] [Google Scholar]
- 33.Nakamura Y., Sakakibara J., Izumi T., Shibata A., Ono T. Transcriptional Regulation of Squalene Epoxidase by Sterols and Inhibitors in HeLa Cells (∗) J. Biol. Chem. 1996;271:8053–8056. doi: 10.1074/jbc.271.14.8053. [DOI] [PubMed] [Google Scholar]
- 34.Hu X., Wang Y., Hao L.Y., Liu X., Lesch C.A., Sanchez B.M., Wendling J.M., Morgan R.W., Aicher T.D., Carter L.L., et al. Sterol metabolism controls TH17 differentiation by generating endogenous RORγ agonists. Nat. Chem. Biol. 2015;11:141–147. doi: 10.1038/nchembio.1714. [DOI] [PubMed] [Google Scholar]
- 35.Hubler Z., Allimuthu D., Bederman I., Elitt M.S., Madhavan M., Allan K.C., Shick H.E., Garrison E., T Karl M., Factor D.C., et al. Accumulation of 8,9-unsaturated sterols drives oligodendrocyte formation and remyelination. Nature. 2018;560:372–376. doi: 10.1038/s41586-018-0360-3. [DOI] [PMC free article] [PubMed] [Google Scholar]
- 36.Pleshinger M.J., Friedrich R.M., Hubler Z., Rivera-León A.M., Gao F., Yan D., Sax J.L., Srinivasan R., Bederman I., Shick H.E., et al. Inhibition of SC4MOL and HSD17B7 shifts cellular sterol composition and promotes oligodendrocyte formation. RSC Chem. Biol. 2022;3:56–68. doi: 10.1039/d1cb00145k. [DOI] [PMC free article] [PubMed] [Google Scholar]
- 37.Hubler Z., Friedrich R.M., Sax J.L., Allimuthu D., Gao F., Rivera-León A.M., Pleshinger M.J., Bederman I., Adams D.J. Modulation of lanosterol synthase drives 24,25-epoxysterol synthesis and oligodendrocyte formation. Cell Chem. Biol. 2021;28:866–875.e5. doi: 10.1016/j.chembiol.2021.01.025. [DOI] [PMC free article] [PubMed] [Google Scholar]
- 38.Gaoua W., Chevy F., Roux C., Wolf C. Oxidized derivatives of 7-dehydrocholesterol induce growth retardation in cultured rat embryos: a model for antenatal growth retardation in the Smith-Lemli-Opitz syndrome. J. Lipid Res. 1999;40:456–463. [PubMed] [Google Scholar]
- 39.Pfeffer B.A., Xu L., Porter N.A., Rao S.R., Fliesler S.J. Differential cytotoxic effects of 7-dehydrocholesterol-derived oxysterols on cultured retina-derived cells: Dependence on sterol structure, cell type, and density. Exp. Eye Res. 2016;145:297–316. doi: 10.1016/j.exer.2016.01.016. [DOI] [PMC free article] [PubMed] [Google Scholar]
- 40.Freitas F.P., Alborzinia H., dos Santos A.F., Nepachalovich P., Pedrera L., Zilka O., Inague A., Klein C., Aroua N., Kaushal K., et al. 7-Dehydrocholesterol is an endogenous suppressor of ferroptosis. Nature. 2024;626:401–410. doi: 10.1038/s41586-023-06878-9. [DOI] [PubMed] [Google Scholar]
- 41.Li Y., Ran Q., Duan Q., Jin J., Wang Y., Yu L., Wang C., Zhu Z., Chen X., Weng L., et al. 7-Dehydrocholesterol dictates ferroptosis sensitivity. Nature. 2024;626:411–418. doi: 10.1038/s41586-023-06983-9. [DOI] [PMC free article] [PubMed] [Google Scholar]
- 42.Skubic C., Vovk I., Rozman D., Križman M., Samples B. Simplified LC-MS Method for Analysis of Sterols in Biological Samples. Molecules. 2020;25:4116–4125. doi: 10.3390/MOLECULES25184116. [DOI] [PMC free article] [PubMed] [Google Scholar]
- 43.Iijima K., Yamada H., Miharu M., Imadome K.-I., Miyagawa Y., Akimoto S., Kobayashi K., Okita H., Nakazawa A., Fujiwara S., et al. ZNF385B is characteristically expressed in germinal center B cells and involved in B-cell apoptosis. Eur. J. Immunol. 2012;42:3405–3415. doi: 10.1002/eji.201242530. [DOI] [PubMed] [Google Scholar]
- 44.Matys V., Kel-Margoulis O.V., Fricke E., Liebich I., Land S., Barre-Dirrie A., Reuter I., Chekmenev D., Krull M., Hornischer K., et al. TRANSFAC and its module TRANSCompel: transcriptional gene regulation in eukaryotes. Nucleic Acids Res. 2006;34:D108–D110. doi: 10.1093/nar/gkj143. [DOI] [PMC free article] [PubMed] [Google Scholar]
- 45.Keenan A.B., Torre D., Lachmann A., Leong A.K., Wojciechowicz M.L., Utti V., Jagodnik K.M., Kropiwnicki E., Wang Z., Ma’ayan A. ChEA3: transcription factor enrichment analysis by orthogonal omics integration. Nucleic Acids Res. 2019;47:W212–W224. doi: 10.1093/nar/gkz446. [DOI] [PMC free article] [PubMed] [Google Scholar]
- 46.Kanaki M., Kardassis D. Regulation of the human lipoprotein lipase gene by the forkhead box transcription factor FOXA2/HNF-3β in hepatic cells. Biochim. Biophys. Acta. Gene Regul. Mech. 2017;1860:327–336. doi: 10.1016/j.bbagrm.2017.01.007. [DOI] [PubMed] [Google Scholar]
- 47.Bochkis I.M., Rubins N.E., White P., Furth E.E., Friedman J.R., Kaestner K.H. Hepatocyte-specific ablation of Foxa2 alters bile acid homeostasis and results in endoplasmic reticulum stress. Nat. Med. 2008;14:828–836. doi: 10.1038/nm.1853. [DOI] [PMC free article] [PubMed] [Google Scholar]
- 48.Yue L., Ye F., Gui C., Luo H., Cai J., Shen J., Chen K., Shen X., Jiang H. Ligand-binding regulation of LXR/RXR and LXR/PPAR heterodimerizations: SPR technology-based kinetic analysis correlated with molecular dynamics simulation. Protein Sci. 2005;14:812–822. doi: 10.1110/ps.04951405. [DOI] [PMC free article] [PubMed] [Google Scholar]
- 49.Yoshikawa T., Ide T., Shimano H., Yahagi N., Amemiya-Kudo M., Matsuzaka T., Yatoh S., Kitamine T., Okazaki H., Tamura Y., et al. Cross-Talk between Peroxisome Proliferator-Activated Receptor (PPAR) α and Liver X Receptor (LXR) in Nutritional Regulation of Fatty Acid Metabolism. I. PPARs Suppress Sterol Regulatory Element Binding Protein-1c Promoter through Inhibition of LXR Signali. Mol. Endocrinol. 2003;17:1240–1254. doi: 10.1210/me.2002-0190. [DOI] [PubMed] [Google Scholar]
- 50.Yang C., McDonald J.G., Patel A., Zhang Y., Umetani M., Xu F., Westover E.J., Covey D.F., Mangelsdorf D.J., Cohen J.C., Hobbs H.H. Sterol Intermediates from Cholesterol Biosynthetic Pathway as Liver X Receptor Ligands. J. Biol. Chem. 2006;281:27816–27826. doi: 10.1074/jbc.M603781200. [DOI] [PubMed] [Google Scholar]
- 51.Spann N.J., Garmire L.X., McDonald J.G., Myers D.S., Milne S.B., Shibata N., Reichart D., Fox J.N., Shaked I., Heudobler D., et al. Regulated Accumulation of Desmosterol Integrates Macrophage Lipid Metabolism and Inflammatory Responses. Cell. 2012;151:138–152. doi: 10.1016/j.cell.2012.06.054. [DOI] [PMC free article] [PubMed] [Google Scholar]
- 52.Heverin M., Meaney S., Brafman A., Shafir M., Olin M., Shafaati M., Von Bahr S., Larsson L., Lövgren-Sandblom A., Diczfalusy U., et al. Studies on the cholesterol-free mouse: Strong activation of LXR-regulated hepatic genes when replacing cholesterol with desmosterol. Arterioscler. Thromb. Vasc. Biol. 2007;27:2191–2197. doi: 10.1161/ATVBAHA.107.149823. [DOI] [PubMed] [Google Scholar]
- 53.Reeves H.L., Narla G., Ogunbiyi O., Haq A.I., Katz A., Benzeno S., Hod E., Harpaz N., Goldberg S., Tal-Kremer S., et al. Kruppel-like factor 6 (KLF6) is a tumor-suppressor gene frequently inactivated in colorectal cancer. Gastroenterology. 2004;126:1090–1103. doi: 10.1053/j.gastro.2004.01.005. [DOI] [PubMed] [Google Scholar]
- 54.Hallstrom T.C., Mori S., Nevins J.R. An E2F1-Dependent Gene Expression Program that Determines the Balance between Proliferation and Cell Death. Cancer Cell. 2008;13:11–22. doi: 10.1016/j.ccr.2007.11.031. [DOI] [PMC free article] [PubMed] [Google Scholar]
- 55.Dolcet X., Llobet D., Pallares J., Matias-Guiu X. NF-kB in development and progression of human cancer. Virchows Arch. 2005;446:475–482. doi: 10.1007/s00428-005-1264-9. [DOI] [PubMed] [Google Scholar]
- 56.Gelsomino L., Gu G., Rechoum Y., Beyer A.R., Pejerrey S.M., Tsimelzon A., Wang T., Huffman K., Ludlow A., Andò S., Fuqua S.A.W. ESR1 mutations affect anti-proliferative responses to tamoxifen through enhanced cross-talk with IGF signaling. Breast Cancer Res. Treat. 2016;157:253–265. doi: 10.1007/s10549-016-3829-5. [DOI] [PMC free article] [PubMed] [Google Scholar]
- 57.Zhang J., Wang X., Chen B., Suo G., Zhao Y., Duan Z., Dai J. Expression of Nanog gene promotes NIH3T3 cell proliferation. Biochem. Biophys. Res. Commun. 2005;338:1098–1102. doi: 10.1016/j.bbrc.2005.10.071. [DOI] [PubMed] [Google Scholar]
- 58.Barclay J.L., Nelson C.N., Ishikawa M., Murray L.A., Kerr L.M., McPhee T.R., Powell E.E., Waters M.J. GH-dependent STAT5 signaling plays an important role in hepatic lipid metabolism. Endocrinology. 2011;152:181–192. doi: 10.1210/en.2010-0537. [DOI] [PubMed] [Google Scholar]
- 59.Wawryk-Gawda E., Chylińska-Wrzos P., Lis-Sochocka M., Chłapek K., Bulak K., Jędrych M., Jodłowska-Jędrych B. P53 protein in proliferation, repair and apoptosis of cells. Protoplasma. 2014;251:525–533. doi: 10.1007/s00709-013-0548-1. [DOI] [PMC free article] [PubMed] [Google Scholar]
- 60.Chen C.L., Tsai Y.S., Huang Y.H., Liang Y.J., Sun Y.Y., Su C.W., Chau G.Y., Yeh Y.C., Chang Y.S., Hu J.T., Wu J.C. Lymphoid Enhancer Factor 1 Contributes to Hepatocellular Carcinoma Progression Through Transcriptional Regulation of Epithelial-Mesenchymal Transition Regulators and Stemness Genes. Hepatol. Commun. 2018;2:1392–1407. doi: 10.1002/hep4.1229. [DOI] [PMC free article] [PubMed] [Google Scholar]
- 61.Reya T., O’Riordan M., Okamura R., Devaney E., Willert K., Nusse R., Grosschedl R. Wnt Signaling Regulates B Lymphocyte Proliferation through a LEF-1 Dependent Mechanism. Immunity. 2000;13:15–24. doi: 10.1016/S1074-7613(00)00004-2. [DOI] [PubMed] [Google Scholar]
- 62.Hao Y.-H., Lafita-Navarro M.C., Zacharias L., Borenstein-Auerbach N., Kim M., Barnes S., Kim J., Shay J., DeBerardinis R.J., Conacci-Sorrell M. Induction of LEF1 by MYC activates the WNT pathway and maintains cell proliferation. Cell Commun. Signal. 2019;17:129. doi: 10.1186/s12964-019-0444-1. [DOI] [PMC free article] [PubMed] [Google Scholar]
- 63.Acosta-Alvear D., Zhou Y., Blais A., Tsikitis M., Lents N.H., Arias C., Lennon C.J., Kluger Y., Dynlacht B.D. XBP1 Controls Diverse Cell Type- and Condition-Specific Transcriptional Regulatory Networks. Mol. Cell. 2007;27:53–66. doi: 10.1016/j.molcel.2007.06.011. [DOI] [PubMed] [Google Scholar]
- 64.Horton J.D., Goldstein J.L., Brown M.S. SREBPs: activators of the complete program of cholesterol and fatty acid synthesis in the liver. J. Clin. Invest. 2002;109:1125–1131. doi: 10.1172/JCI15593. [DOI] [PMC free article] [PubMed] [Google Scholar]
- 65.Sun F., Fu H., Liu Q., Tie Y., Zhu J., Xing R., Sun Z., Zheng X. Downregulation of CCND1 and CDK6 by miR-34a induces cell cycle arrest. FEBS Lett. 2008;582:1564–1568. doi: 10.1016/j.febslet.2008.03.057. [DOI] [PubMed] [Google Scholar]
- 66.Baron V., Adamson E.D., Calogero A., Ragona G., Mercola D. The transcription factor Egr1 is a direct regulator of multiple tumor suppressors including TGFβ1, PTEN, p53, and fibronectin. Cancer Gene Ther. 2006;13:115–124. doi: 10.1038/sj.cgt.7700896. [DOI] [PMC free article] [PubMed] [Google Scholar]
- 67.Gan H.-Y., Li N., Zhang Q., Feng Z.-Z. Silencing FOXA1 gene regulates liver cancer cell apoptosis and cell proliferation. Eur. Rev. Med. Pharmacol. Sci. 2018;22:397–404. doi: 10.26355/eurrev_201801_14187. [DOI] [PubMed] [Google Scholar]
- 68.He S., Zhang J., Zhang W., Chen F., Luo R. FOXA1 inhibits hepatocellular carcinoma progression by suppressing PIK3R1 expression in male patients. J. Exp. Clin. Cancer Res. 2017;36:175. doi: 10.1186/s13046-017-0646-6. [DOI] [PMC free article] [PubMed] [Google Scholar]
- 69.Hoskins J.W., Jia J., Flandez M., Parikh H., Xiao W., Collins I., Emmanuel M.A., Ibrahim A., Powell J., Zhang L., et al. Transcriptome analysis of pancreatic cancer reveals a tumor suppressor function for HNF1A. Carcinogenesis. 2014;35:2670–2678. doi: 10.1093/carcin/bgu193. [DOI] [PMC free article] [PubMed] [Google Scholar]
- 70.Takeda Y., Kang H.S., Freudenberg J., DeGraff L.M., Jothi R., Jetten A.M. Retinoic acid-related orphan receptor γ (RORγ): a novel participant in the diurnal regulation of hepatic gluconeogenesis and insulin sensitivity. PLoS Genet. 2014;10 doi: 10.1371/journal.pgen.1004331. [DOI] [PMC free article] [PubMed] [Google Scholar]
- 71.Lou X., Meng Y., Hou Y. A literature review on function and regulation mechanism of DKK4. J. Cell Mol. Med. 2021;25:2786–2794. doi: 10.1111/jcmm.16372. [DOI] [PMC free article] [PubMed] [Google Scholar]
- 72.Gammons M., Bienz M. Multiprotein complexes governing Wnt signal transduction. Curr. Opin. Cell Biol. 2018;51:42–49. doi: 10.1016/j.ceb.2017.10.008. [DOI] [PubMed] [Google Scholar]
- 73.Revollo L., Kading J., Jeong S.Y., Li J., Salazar V., Mbalaviele G., Civitelli R. N-cadherin restrains PTH activation of Lrp6/β-catenin signaling and osteoanabolic action. J. Bone Miner. Res. 2015;30:274–285. doi: 10.1002/jbmr.2323. [DOI] [PMC free article] [PubMed] [Google Scholar]
- 74.Liang J., Li X., Li Y., Wei J., Daniels G., Zhong X., Wang J., Sfanos K., Melamed J., Zhao J., Lee P. LEF1 targeting EMT in prostate cancer invasion is mediated by miR-181a. Am. J. Cancer Res. 2015;5:1124–1132. [PMC free article] [PubMed] [Google Scholar]
- 75.Gu S., Liu F., Xie X., Ding M., Wang Z., Xing X., Xiao T., Sun X. β-Sitosterol blocks the LEF-1-mediated Wnt/β-catenin pathway to inhibit proliferation of human colon cancer cells. Cell. Signal. 2023;104 doi: 10.1016/j.cellsig.2022.110585. [DOI] [PubMed] [Google Scholar]
- 76.Kanehisa M., Goto S. KEGG: kyoto encyclopedia of genes and genomes. Nucleic Acids Res. 2000;28:27–30. doi: 10.1093/nar/28.1.27. [DOI] [PMC free article] [PubMed] [Google Scholar]
- 77.Yuan L., Roy B., Ratna P., Uhler C., Shivashankar G.V. Lateral confined growth of cells activates Lef1 dependent pathways to regulate cell-state transitions. Sci. Rep. 2022;12 doi: 10.1038/s41598-022-21596-4. [DOI] [PMC free article] [PubMed] [Google Scholar]
- 78.Yun K., Choi Y.D., Nam J.H., Park Z., Im S.-H. NF-κB regulates Lef1 gene expression in chondrocytes. Biochem. Biophys. Res. Commun. 2007;357:589–595. doi: 10.1016/j.bbrc.2007.03.170. [DOI] [PubMed] [Google Scholar]
- 79.Massagué J., Seoane J., Wotton D. Smad transcription factors. Genes Dev. 2005;19:2783–2810. doi: 10.1101/gad.1350705. [DOI] [PubMed] [Google Scholar]
- 80.Letamendia A., Labbé E., Attisano L. Transcriptional Regulation by Smads: Crosstalk between the TGF-β and Wnt Pathways. JBJS. 2001;83:S31–S39. [PubMed] [Google Scholar]
- 81.Huang F.-I., Chen Y.-L., Chang C.-N., Yuan R.-H., Jeng Y.-M. Hepatocyte growth factor activates Wnt pathway by transcriptional activation of LEF1 to facilitate tumor invasion. Carcinogenesis. 2012;33:1142–1148. doi: 10.1093/carcin/bgs131. [DOI] [PubMed] [Google Scholar]
- 82.Ačimovič J., Rozman D. Steroidal triterpenes of cholesterol synthesis. Molecules. 2013;18:4002–4017. doi: 10.3390/molecules18044002. [DOI] [PMC free article] [PubMed] [Google Scholar]
- 83.Mitsche M.A., McDonald J.G., Hobbs H.H., Cohen J.C. Flux analysis of cholesterol biosynthesis in vivo reveals multiple tissue and cell-type specific pathways. Elife. 2015;4 doi: 10.7554/elife.07999. [DOI] [PMC free article] [PubMed] [Google Scholar]
- 84.Lorbek G., Perše M., Jeruc J., Juvan P., Gutierrez-Mariscal F.M., Lewinska M., Gebhardt R., Keber R., Horvat S., Björkhem I., et al. Lessons from Hepatocyte-Specific Cyp51 Knockout Mice: Impaired Cholesterol Synthesis Leads to Oval Cell-Driven Liver Injury. Sci. Rep. 2015;5:1–11. doi: 10.1038/srep08777. [DOI] [PMC free article] [PubMed] [Google Scholar]
- 85.Sax J.L., Hubler Z., Allimuthu D., Adams D.J. Screening Reveals Sterol Derivatives with Pro-Differentiation, Pro-Survival, or Potent Cytotoxic Effects on Oligodendrocyte Progenitor Cells. ACS Chem. Biol. 2021;16:1288–1297. doi: 10.1021/acschembio.1c00461. [DOI] [PubMed] [Google Scholar]
- 86.Mohammad N., Malvi P., Meena A.S., Singh S.V., Chaube B., Vannuruswamy G., Kulkarni M.J., Bhat M.K. Cholesterol depletion by methyl-β-cyclodextrin augments tamoxifen induced cell death by enhancing its uptake in melanoma. Mol. Cancer. 2014;13:204. doi: 10.1186/1476-4598-13-204. [DOI] [PMC free article] [PubMed] [Google Scholar]
- 87.Portilho D.M., Soares C.P., Morrot A., Thiago L.S., Butler-Browne G., Savino W., Costa M.L., Mermelstein C. Cholesterol depletion by methyl-β-cyclodextrin enhances cell proliferation and increases the number of desmin-positive cells in myoblast cultures. Eur. J. Pharmacol. 2012;694:1–12. doi: 10.1016/j.ejphar.2012.07.035. [DOI] [PubMed] [Google Scholar]
- 88.Matsumura I., Tanaka H., Kanakura Y. E2F1 and c-Myc in cell growth and death. Cell Cycle. 2003;2:332–335. doi: 10.4161/cc.2.4.428. [DOI] [PubMed] [Google Scholar]
- 89.Zhang K., Chen S., Yang Q., Guo S., Chen Q., Liu Z., Li L., Jiang M., Li H., Hu J., et al. The Oligodendrocyte Transcription Factor 2 OLIG2 regulates transcriptional repression during myelinogenesis in rodents. Nat. Commun. 2022;13:1423. doi: 10.1038/s41467-022-29068-z. [DOI] [PMC free article] [PubMed] [Google Scholar]
- 90.Gasteiger E., Gattiker A., Hoogland C., Ivanyi I., Appel R.D., Bairoch A. ExPASy: The proteomics server for in-depth protein knowledge and analysis. Nucleic Acids Res. 2003;31:3784–3788. doi: 10.1093/nar/gkg563. [DOI] [PMC free article] [PubMed] [Google Scholar]
- 91.Schreiber E., Harshman K., Kemler I., Malipiero U., Schaffner W., Fontana A. Astrocytes and glioblastoma cells express novel octamer-DNA binding proteins distinct from the ubiquitous Oct-1 and B cell type Oct-2 proteins. Nucleic Acids Res. 1990;18:5495–5503. doi: 10.1093/nar/18.18.5495. [DOI] [PMC free article] [PubMed] [Google Scholar]
- 92.Xie Z., Bailey A., Kuleshov M.V., Clarke D.J.B., Evangelista J.E., Jenkins S.L., Lachmann A., Wojciechowicz M.L., Kropiwnicki E., Jagodnik K.M., et al. Gene Set Knowledge Discovery with Enrichr. Curr. Protoc. 2021;1:e90. doi: 10.1002/cpz1.90. [DOI] [PMC free article] [PubMed] [Google Scholar]
- 93.Chen E.Y., Tan C.M., Kou Y., Duan Q., Wang Z., Meirelles G.V., Clark N.R., Ma’ayan A. Enrichr: interactive and collaborative HTML5 gene list enrichment analysis tool. BMC Bioinf. 2013;14:128. doi: 10.1186/1471-2105-14-128. [DOI] [PMC free article] [PubMed] [Google Scholar]
- 94.Subramanian A., Tamayo P., Mootha V.K., Mukherjee S., Ebert B.L., Gillette M.A., Paulovich A., Pomeroy S.L., Golub T.R., Lander E.S., Mesirov J.P. Gene set enrichment analysis: A knowledge-based approach for interpreting genome-wide expression profiles. Proc. Natl. Acad. Sci. USA. 2005;102:15545–15550. doi: 10.1073/pnas.0506580102. [DOI] [PMC free article] [PubMed] [Google Scholar]
- 95.Mootha V.K., Lindgren C.M., Eriksson K.-F., Subramanian A., Sihag S., Lehar J., Puigserver P., Carlsson E., Ridderstråle M., Laurila E., et al. PGC-1α-responsive genes involved in oxidative phosphorylation are coordinately downregulated in human diabetes. Nat. Genet. 2003;34:267–273. doi: 10.1038/ng1180. [DOI] [PubMed] [Google Scholar]
- 96.Shannon P., Markiel A., Ozier O., Baliga N.S., Wang J.T., Ramage D., Amin N., Schwikowski B., Ideker T. Cytoscape: a software environment for integrated models of biomolecular interaction networks. Genome Res. 2003;13:2498–2504. doi: 10.1101/gr.1239303. [DOI] [PMC free article] [PubMed] [Google Scholar]
- 97.Reimand J., Isserlin R., Voisin V., Kucera M., Tannus-Lopes C., Rostamianfar A., Wadi L., Meyer M., Wong J., Xu C., et al. Pathway enrichment analysis and visualization of omics data using g:Profiler, GSEA, Cytoscape and EnrichmentMap. Nat. Protoc. 2019;14:482–517. doi: 10.1038/s41596-018-0103-9. [DOI] [PMC free article] [PubMed] [Google Scholar]
Associated Data
This section collects any data citations, data availability statements, or supplementary materials included in this article.
Supplementary Materials
Data Availability Statement
-
•
The expression profiling data have been deposited in GEO: GSE221582 and are publicly available. Lists of differentially expressed genes, KEGG enriched pathways and ChEA/Transfac enriched transcription factor are available in Supplementary data. Original western blot images are seen in Figure S8.
-
•
No original code has been produced in this manuscript.
-
•
Any additional information required to reanalyze the data reported in this paper is available from the lead contact upon request.