Abstract
The comparison between breast cancer recognition by electrical impedance tomography implemented with Gaussian relaxation time distribution (EIT-GRTD) and conventional EIT has been conducted to evaluate the optimal frequency for cancer detection fcancer. The EIT-GRTD has two steps, which are 1) the determination of the fcancer and 2) the refinement of breast reconstruction through time-constant enhancement. This paper employs two-dimensional numerical simulations by a finite element method (FEM) software to replicate the process of breast cancer recognition. The simulation is constructed based on two distinct electrical properties, which are conductivity σ and permitivitty ε, inherent to two major breast tissues: adipose tissues, and breast cancer tissues. In this case, the σ and ε of breast cancer σcancer, εcancer are higher than adipose tissues σadipose, εadipose. The simulation results indicate that the most effective frequency for breast cancer detection based on EIT-GRTD is fcancer = 56,234 Hz. Meanwhile, conventional EIT requires more processing to determine the fcancer based on image results or spatial conductivity analysis. Quantitatively, both EIT-GRTD and conventional EIT can clearly show the position of the cancer in layers 1 and 2 for EIT-GRTD and only layer 1 for conventional EIT.
Keywords: Breast cancer, impedance, tomography, recognition, Gaussian Relaxation-Time Distribution
Introduction
Breast cancer is characterized by uncontrolled abnormal cell growth in breast tissue [1]. This critical condition underscores the imperative for heightened awareness, efficacious treatments, and prompt recognition to enhance patient survival rates. Conventional technologies used in breast cancer recognition include mammography, ultrasound, and biopsy. Mammography uses X-rays to identify breast abnormalities [2], while ultrasound uses sound waves for internal imaging [3]. A biopsy involves taking a small sample of breast tissue for microscopic analysis to detect cancer cells. Despite their advantages, these devices have limitations, such as being less sensitive to dense breast tissue on mammography [4], having limitations in detecting small lesions on ultrasound, and their invasive nature increases the risk of discomfort on biopsy. Therefore, precise, non-invasive, and real-time breast cancer recognition technologies are needed.
Electrical Impedance Tomography (EIT) has emerged as an affordable, non-invasive [5], radiation-free, and real-time medical imaging solution [6][7], particularly applicable in the breast area. EIT aims to reconstruct the impedance distribution within an object based on electrical measurements taken at the object’s boundaries. Since the 1970s, EIT has been the subject of active research, yielding numerous valuable and inspiring findings [8]. Numerous studies have employed electrical impedance tomography (EIT) for breast cancer detection, employing various layer configurations, electrode quantities, and methodologies. Gutierrez et al. [9] utilized eight circular electrodes within a single layer. Gomes et al. [10] and Rao et al. [11] employed 16 circular electrodes in a single layer. Conversely, Zarafshani et al. [12] utilized 85 electrodes arranged in a planar array, whereas Hong Sunjoo et al. [13] employed 92 electrodes distributed across multiple circular layers. The exploration of EIT encompasses various methodologies to reveal the conductivity distribution within an object [14]. While EIT systems offer certain advantages, they also face limitations, especially in the optimal frequency determination for cancer detection fcancer, necessitating further investigation within conventional EIT.
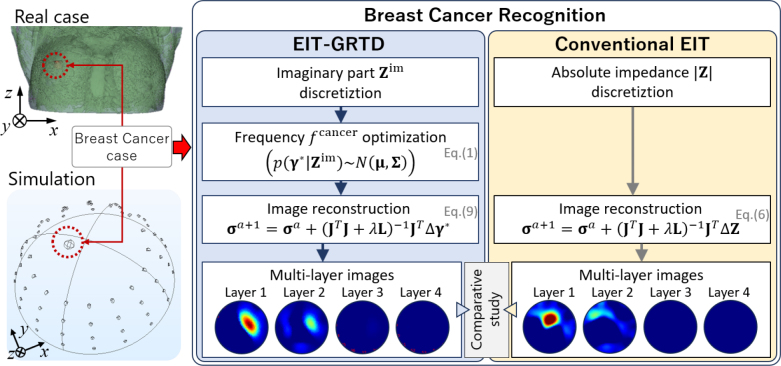
To overcome the drawbacks, integrating EIT with the Gaussian relaxation time distribution (GRTD) method could present a promising approach. This integration is anticipated to mitigate this limitation by simplifying the determination of optimal frequencies for cancer detection. This study has two objectives, which are 1) to conduct a comprehensive analysis of the fcancer between EIT-GRTD and conventional EIT and 2) to perform a detailed comparison effectiveness of image reconstruction between EIT-GRTD and conventional EIT. Fig. 1 shows the overview of the breast recognition by EIT-GRTD and conventional EIT.
Fig. 1:
Overview of breast cancer recognition by EIT-GRTD versus conventional EIT
Breast cancer recognition by electrical impedance tomography implemented with Gaussian relaxation-time distribution (EIT-GRTD)
Fig.1 shows the overview of breast cancer recognition by electrical impedance tomography with Gaussian relaxation-time distribution EIT-GRTD versus conventional EIT. The main difference between the two methods lies in determining the optimal frequency value fcancer for breast cancer detection and in the reconstruction of the input image. EIT-GRTD utilizes the difference of the predicted distribution relaxation time function Δγ* input, while conventional EIT rely on the discrepancy of impedance ΔZ between two measured voltages.
Gaussian relaxation-time distribution (GRTD)
GRTD is a refinement of the conventional relaxation time distribution (RTD) using Gaussian distribution. With this approach, we can more accurately predict the relaxation-time distribution function from the imaginary part of impedance . The correlation of imaginary impedance at m-th and relaxation time distribution function at k-th is depicted in the following equation [15]:
| 1 |
where 2πf and τ are angular frequency within the measured spectrum and relaxation-times, respectively.
The joint distribution between Zim and γ* is expressed as follows [15]:
| 2 |
where N is the Gaussian distribution, p is posterior distribution, μ and Σ are mean and covariance, respectively. The optimal frequency for detection the cancer is shown as follows:
| 3 |
The arg max function in eq.2 serves the purpose of determining the optimal value for the input variable that maximizes the objective function. Within this framework, the objective function pertains to the conditional probability in eq.2, wherein γ* denotes the variable subject to optimization in relation to the dataset Zim. The γ* term is computed across a range of frequencies at each measurement number, with the optimized frequency for each measurement determined by the highest γ* peak. The overall optimized frequency is then selected based on the highest γ* peak from the measurement number that best represents the object of interest.
Breast Cancer Imaging
Conventional EIT by frequency difference EIT
The conductivity distribution σ of breast cancer is expressed as [16]
| 4 |
where is the row vector at the mesh point (1 ≤ g ≤ G). Standard Jacobian J is utilized to obtain the σ, which consist of all combinations of the injection current I and measured impedance Z. The standard Jacobian is defined by
| 5 |
where G is the total mesh number of spatial resolution and M is the total measurement number. The calculation of the for the m-th measured pattern at g-th mesh element is calculated by [17]
| 6 |
Here, ϕ(Ia) represents the potential field influenced by the injected current I into the a-th electrode, while ϕ(Ib) denotes the potential field observed at the b-th measuring electrode. The variable Zm corresponds to the measured impedance at the m-th measurement instance (1≤m≤M), which is obtained from the measurement voltage vm. σg represents the conductivity at the g-th mesh element (1≤g≤G). Ω represents the region of the electric field within the EIT sensor. Furthermore, Gaussian-Newton is utilized to obtain the conductivity distribution which is defined by [18]
| 7 |
where, a, λ and L are the a-th electrode, the regularization factors which is automatically obtained from L-curve [19] and regularization factors based on Tikhonov regularization, which is an identity matrix, respectively.
The signifies the discrepancy in impedance between two measured voltage values: is derived from injecting a high-frequency current (f2), and is obtained from injecting a low-frequency current (f1) [20][21]. The ΔZm is expressed by
| 8 |
where the chosen fixed frequency is, f0= 1,000 Hz while the range of fi = 17,783 ~ 316,228 Hz, to reconstruct the conductivity σ.
In order to evaluate the performance of conventional EIT in breast recognition, the spatial mean conductivity is utilized using the following equation [22]
| 9 |
where σg denotes the conductivity distribution in the g-th mesh voxel.
Time-constant enhancement by EIT-GRTD
EIT-GRTD, a Gauss-Newton is utilized to time constant enhance imaging which is expressed by [16] [19]
| 10 |
where Δγ* is the difference of the predicted distribution relaxation time function at the optimal frequency fopt expressed by
| 11 |
where
| 12 |
where, and are inclusion and initial measurement distribution of relaxation time function, respectively. In this study, the was chosen based on the measurement results of the lowest relaxation time distribution value.
Ethical approval
The conducted research is not related to either human or animal use.
Simulation
Simulation Setup and Condition
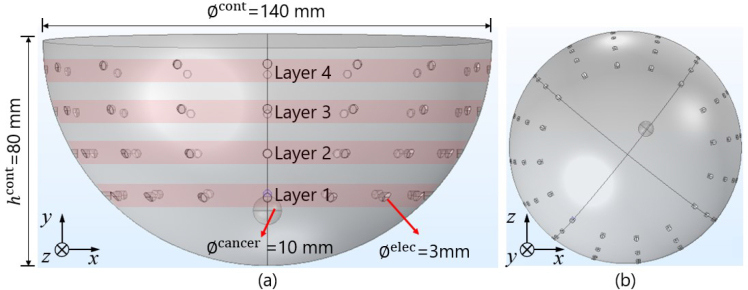
Fig. 2 shows simulation setup of breast cancer recognition in the case of (a) z-axis view, and (b) y-axis view. In this study, the simulation is carried out by a finite element method (FEM) simulation software in 3D coordinates. In order to mimic breast cancer recognition, a breast container was designed in a half-spherical cup shape with diameter ∅cont = 140 mm, a height hcont= 80 mm, and electrode diameter ∅elec= 3 mm.
Fig. 2:
Simulation setup of breast cancer recognition in the case of (a) z-axis view, and (b) y-axis view
This study represents a preliminary investigation into the application of electrical impedance tomography (EIT) for breast cancer recognition. The use of simplified, hemispherical models in the simulation was chosen initially to establish foundational insights into impedance response, specifically focusing on impedance as a parameter for locating potential cancerous lesions within breast tissue. While we acknowledge that real breasts are soft and exhibit non-hemispherical shapes, these factors were simplified in this preliminary phase to facilitate controlled exploration of impedance characteristics. Spherical breast cancer is made with a diameter ∅cancer= 10 mm with the cancer position set close to layer 1. The breast container is composed of adipose tissue and breast cancer. Fig. 3 shows the electrical properties utilized in this simulation. The electrical properties of breast cancer are employed with the electrical properties of breast glandular. In this case, we assumed that the conductivity σ and permittivity ε of breast cancer σcancer, εcancer are higher than adipose tissues σadipose, εadipose. The authors employed glandular breast tissue conductivity and permittivity as representative parameters for breast cancer tissue, given the absence of specific data on its electrical properties along with the frequency data we used. Imaging cancer in dense breast tissue, which contains a substantial glandular component, is inherently challenging. However, data limitations led to this approach. Incorporating breast cancer-specific parameters into a background with a larger glandular component would enhance the simulation’s relevance and accuracy. Until breast cancer tissue data is available, glandular tissue attributes are utilized to approximate the situation as closely as possible.
Fig. 3:
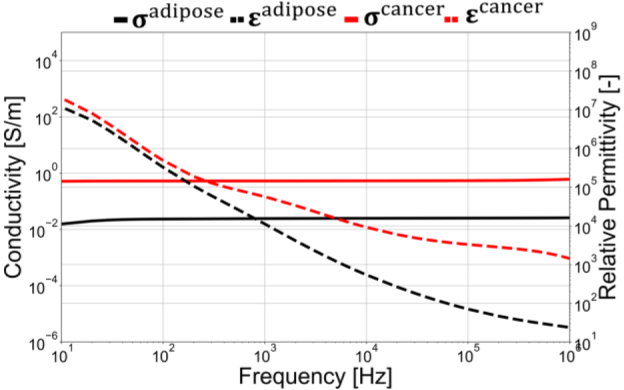
Electrical properties utilized in the simulation [24].
Simulation method
The simulation is carried out in this section with Multiphysics 3D simulation software. The simulation utilizes a breast container model of four layers with 64 electrodes. Fig. 4 shows the adjacent pattern utilized in this stimulation with 1 mA injection current to acquire the voltage measurement vm at the m-th measurement. Measurements were performed with 6 frequency variations from 17,783 to 316,228 Hz with 1000 Hz as background. The Maxwell equation was applied to the simulation, defined by
| 13 |
where ∇, σ, ∅, and ε stand for gradient operator, conductivity [S/m], potential [V], and permittivity [F/m], respectively [14]. The simulation is assumed to be conducted under static conditions. In the boundary condition, the equation is assigned as follows [23]:
| 14 |
to simplify, (σ∇∅) was replaced with H= (σ∇∅), so the boundary conditions are the following
| 15 |
| 16 |
| 17 |
where n denotes the outward normal vector of the boundary, ∂Ωe represent the boundary of the electrode, I0 is current injection, and ds is the surface element of the electrode’s boundaries.
Fig. 4:
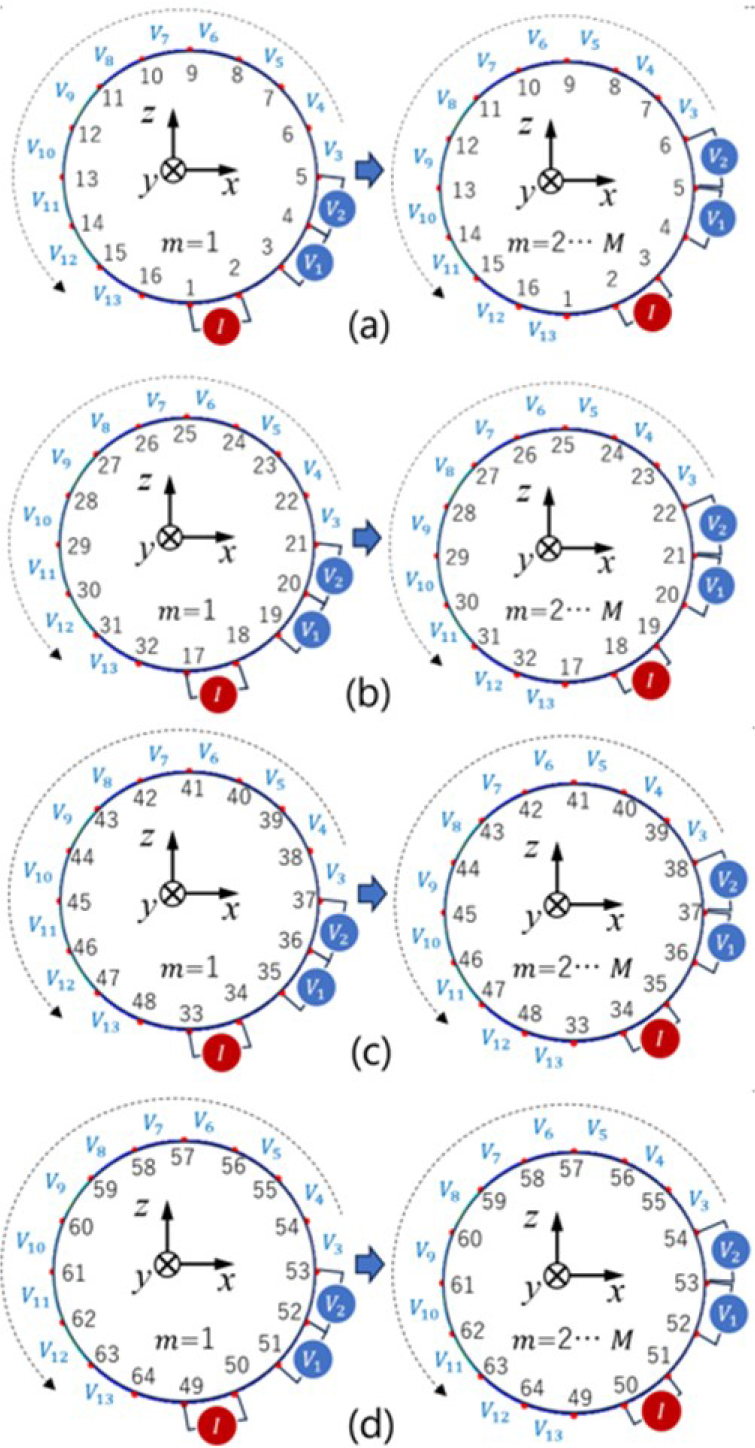
Adjacent pattern in simulation [25]
Simulation Results
Fig. 5 shows the results of frequency determination for cancer detection using the EIT-GRTD. The majority of γ peaks and dominance are observed at a frequency of 56,234 Hz in layers 1 and 2. However, in layers 3 and 4, EIT-GRTD does not identify a significant peak frequency compared in layer 1 and 2. EIT-GRTD only uses one frequency, whereas conventional EIT uses frequencies from 17,783 to 316,228 Hz to determine which is more appropriate for detecting cancer.
Fig. 5:
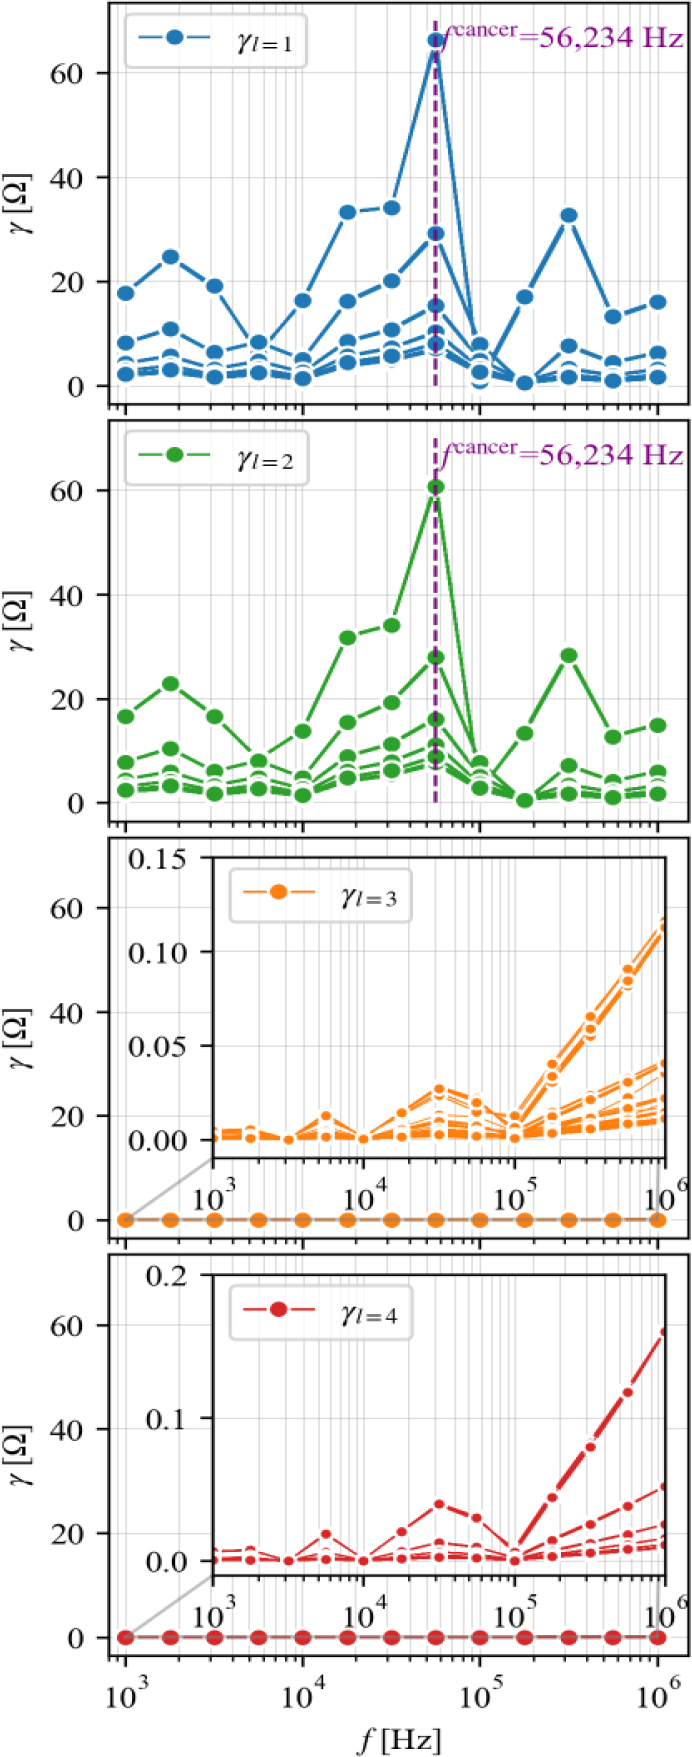
The determination of the frequency for cancer detection fcancer in the simulation study
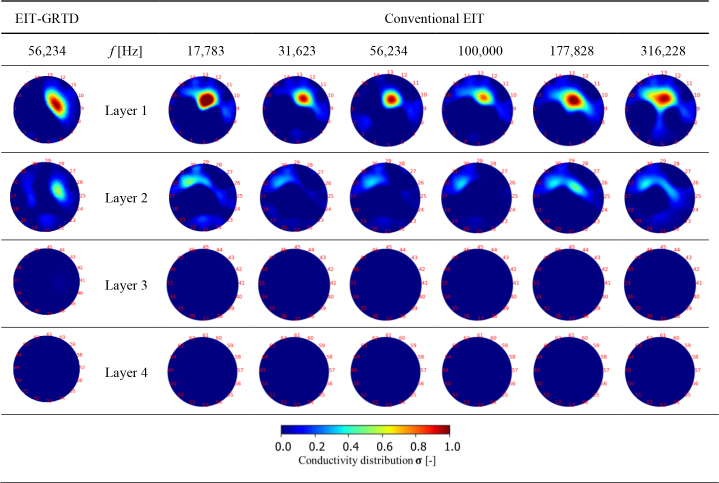
Fig. 6 shows the comparison image results between the EIT-GRTD and conventional EIT. EIT GRTD and conventional EIT revealed successful cancer recognition in the first layer within the simulation environment at a distance of 5 mm from the center of the cancerous sphere to this layer. However, recognition accuracy declined for conventional EIT. It remained unchanged for EIT-GRTD when the cancerous sphere was placed farther away, such as in layer 2, which is positioned 20 mm from the cancerous sphere. Cancer was not visible in conventional EIT at layer 2, indicating limitations in the recognition system at greater distances. Only subtle indications of cancer could be observed through color gradients. Furthermore, in layers 3 and 4, positioned 35 mm and 50 mm from the center of the cancerous sphere, both EIT-GRTD and conventional EIT failed to detect cancer. This indicates more pronounced limitations in recognition capability as the distance between the sensors and the target increases.
Fig. 6:
Image reconstruction result by time constant enhancement breast imaging at fcancer = 56,234 Hz and conventional EIT
Discussion
Regarding the location of the cancer detection position shown in Fig. 6, there are significant differences between the EIT-GRTD method and conventional EIT. In both methods, cancer can be detected accurately in the same position in layer 1 compared to simulation setting. However, when switching to layer 2, the EIT-GRTD method is still able to identify the position of cancer precisely, while in conventional EIT, the cancer detection position is not clearly visible. Both methods exhibited noise on Layer 2. Although the object was isolated to Layer 1 in the simulated environment, noise appears in Layer 2 for both the proposed method and the conventional EIT method. This indicates the need for a noise-filtering method in future research to improve accuracy. Notably, in the proposed method, the noise in Layer 2 is not random but instead reveals the location of the object in Layer 1. In contrast, the noise in the conventional method is random and does not provide useful information about the lesion’s location. This distinction suggests that, while noise filtering is necessary, the noise characteristics in the proposed method still offer valuable insights into the object’s position.
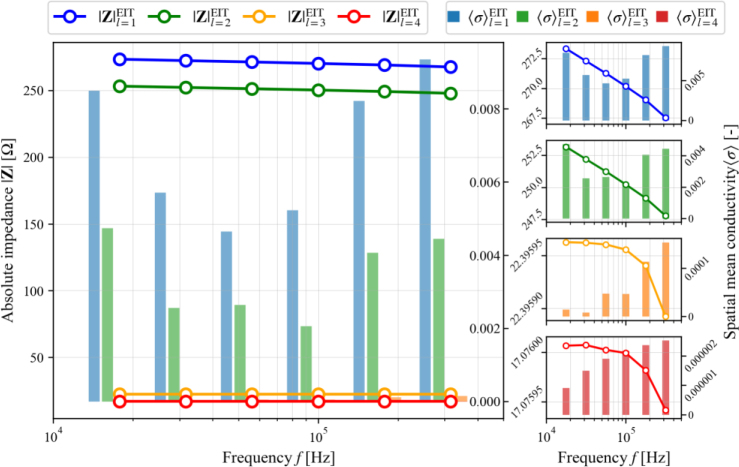
The analysis of absolute impedance and spatial mean conductivity in four layers is also needed in conventional EIT to determine the optimal frequency of cancer detection. Fig. 7 shows the absolute impedance and spatial mean conductivity in four layers of the breast container with increasing frequency. Layer 1 has a higher absolute impedance compared to the other layers. The absolute impedance value in this simulation decreases with increasing frequency. The spatial mean conductivity values exhibit a pattern similar to the absolute impedance, which indicates the highest value at Layer 1.
Fig. 7:
Absolute impedance |Z| and spatial mean conductivity 〈σ〉 plot in all layers
However, a different pattern is observed as the frequency increases. There is a decrease in the spatial mean conductivity values from 17,783 Hz to 56,234 Hz, which then rises again with the increase in frequency until reaching 316,228 Hz. On the other hand, layers 3 and 4 consistently show an increase in spatial average conductivity as frequency increases. This complex behavior highlights the intricate dynamics governing the impedance and conductivity responses within the container breast model as frequency changes. This analysis still faces challenges in determining the best frequency for detecting cancer. Overall, the comparison of reconstruction results between EIT-GRTD and conventional EIT shows the superiority of EIT-GRTD in determining the frequency of cancer detection. The image results from EIT-GRTD are also closer to the settings in the simulation.
For future research, a more comprehensive comparison of the two imaging approaches could be achieved by considering the impact of noise. Moreover, the inclusions used in this study were of a single size and position; therefore, future research should incorporate variations in size and position to better assess the EIT-GRTD’s reliability. Additionally, future studies need to include experimental validation to verify the simulation results and ensure that the proposed methods are effective in practical applications.
Conclusion
The comparison between breast cancer recognition by electrical impedance tomography implemented with Gaussian relaxation time distribution (EIT-GRTD) and conventional EIT has been conducted to evaluate the optimal frequency for cancer detection fcancer. The results show that the EIT-GRTD is easier to determine the frequency for cancer detection at fcancer = 56,234 Hz than conventional EIT. Quantitatively, EIT-GRTD rapidly determines the correct position of cancer compared to conventional EIT, showcasing its capability to accurately locate the cancerous site.
Acknowledgment
Galih Setyawan was responsible for conducting the simulations, analyzing the data, and writing and revising the manuscript. Thanks to Panji Nur Setia, who provided the software support. Prima Asmara Sejati and Kiagus Aufa Ibrahim contributed to the conceptual development and revision of the manuscript, and Masahiro Takei managed the overall coordination of the paper.
Footnotes
Conflict of interest
Authors state no conflict of interest.
References
- 1.Arnold M., et al. Current and future burden of breast cancer: global statistics for 2020 and 2040 The Breast 2022 NaN66:15. doi: 10.1016/j.breast.2022.08.010. “. ,” . , . , vol. , pp. –. . [DOI] [PMC free article] [PubMed] [Google Scholar]
- 2.Devolli-Disha E., Manxhuka-Kërliu S., Ymeri H., Kutllovci A. Comparative accuracy of mammography and ultrasound in women with breast symptoms according to age and breast density Bosn J Basic Med Sci 2009 NaN;9(2):131. doi: 10.17305/bjbms.2009.2832. , “. ,” . , , vol. , no. , pp. –. . [DOI] [PMC free article] [PubMed] [Google Scholar]
- 3.Carovac A., Smajlovic F., Junuzovic D. Application of ultrasound in medicine Acta Informatica Medica 2011;19(3):168. doi: 10.5455/aim.2011.19.168-171. , “. ,” . , , vol. , no. , p. . [DOI] [PMC free article] [PubMed] [Google Scholar]
- 4.Mann R. M., et al. Breast cancer screening in women with extremely dense breasts recommendations of the european society of breast imaging (eusobi) Eur Radiol 2022 NaN32(6):4036. doi: 10.1007/s00330-022-08617-6. “. ,” . , . , vol. , no. , pp. –. . [DOI] [PMC free article] [PubMed] [Google Scholar]
- 5.Goren N., et al. Multi-frequency electrical impedance tomography and neuroimaging data in stroke patients Sci Data 2018 NaN5(1):180112. doi: 10.1038/sdata.2018.112. “. ,” . , . , vol. , no. , p. . [DOI] [PMC free article] [PubMed] [Google Scholar]
- 6.Cao L., et al. A novel time-difference electrical impedance tomography algorithm using multi-frequency information Biomed Eng Online 2019 NaN18(1):84. doi: 10.1186/s12938-019-0703-9. “. ,” . , . , vol. , no. , p. . [DOI] [PMC free article] [PubMed] [Google Scholar]
- 7.Sejati P. A., Sun B., Darma P. N., Shirai T., Narita K., Takei M. Multinode electrical impedance tomography (mnEIT) throughout whole-body electrical muscle stimulation (wbEMS) IEEE Trans Instrum Meas 2023;72:1. doi: 10.1109/TIM.2023.3282295. , “. ,” . , , vol. , pp. –. . [DOI] [Google Scholar]
- 8.Holder D. Electrical Impedance Tomography. CRC Press; 2004. . , . [DOI] [Google Scholar]
- 9.Gutierrez-Lopez M., Prado-Olivarez J., Diaz-Carmona J., Herrera-Ramírez C. A., Gutierrez-Gnecchi J. A., Medina-Sánchez C. G. Electrical impedance-based methodology for locating carcinoma emulators on breast models J Sens 2019 NaN;2019:1. doi: 10.1155/2019/8587191. , “. ,” . , , vol. , pp. –. . [DOI] [Google Scholar]
- 10.Gomes J. C., Barbosa V. A. F., Ribeiro D. E., de Souza R. E., dos Santos W. P. Electrical impedance tomography image reconstruction based on backprojection and extreme learning machines Research on Biomedical Engineering 2020 NaN36(4):399. doi: 10.1007/s42600-020-00079-3. , “. ,” . , . , vol. , no. , pp. –. . [DOI] [Google Scholar]
- 11.Rao A. J., Murphy E. K., Shahghasemi M., Odame K. M. Current-conveyor-based wide-band current driver for electrical impedance tomography Physiol Meas 2019 NaN40(3):034005. doi: 10.1088/1361-6579/ab0c3c. , “. ,” . , . , vol. , no. , p. . [DOI] [PubMed] [Google Scholar]
- 12.Zarafshani A., Bach T., Chatwin C. R., Tang S., Xiang L., Zheng B. Conditioning electrical impedance mammography system Measurement 2018 NaN116:38. doi: 10.1016/j.measurement.2017.10.052. , “. ,” . , . , vol. , pp. –. . [DOI] [Google Scholar]
- 13.Hong S., et al. A 4.9 mΩ-sensitivity mobile electrical impedance tomography ic for early breast-cancer detection system IEEE J Solid-State Circuits 2015 NaN50(1):245. doi: 10.1109/JSSC.2014.2355835. “. ,” . , . , vol. , no. , pp. –. . [DOI] [Google Scholar]
- 14.Shi Y., He X., Wang M., Yang B., Fu F., Kong X. Reconstruction of conductivity distribution with electrical impedance tomography based on hybrid regularization method Journal of Medical Imaging 2021 NaN8(03):20240011 doi: 10.1117/1.JMI.8.3.033503. , “. ,” . , . , vol. , no. . [DOI] [PMC free article] [PubMed] [Google Scholar]
- 15.Liu J., Ciucci F. The gaussian process distribution of relaxation times: a machine learning tool for the analysis and prediction of electrochemical impedance spectroscopy data Electrochim Acta 2020 NaN331 doi: 10.1016/j.electacta.2019.135316. , “. ,” . , . , vol. . [DOI] [Google Scholar]
- 16.Rifai I. N., Baidillah M. R., Wicaksono R., Akita S., Takei M. Sodium concentration imaging in dermis layer by square-wave open electrical impedance tomography (SW-oEIT) with spatial voltage thresholding (SVT) Biomed Phys Eng Express 2023 NaN9(4):045013. doi: 10.1088/2057-1976/acd4c6. , “. ,” . , . , vol. , no. , p. . [DOI] [PubMed] [Google Scholar]
- 17.Sun B., Baidillah M. R., Darma P. N., Shirai T., Narita K., Takei M. Evaluation of the effectiveness of electrical muscle stimulation on human calf muscles via frequency difference electrical impedance tomography Physiol Meas 2021 NaN42(3):035008. doi: 10.1088/1361-6579/abe9ff. , “. ,” . , . , vol. , no. , p. . [DOI] [PubMed] [Google Scholar]
- 18.Ibrahim K. A., Sejati P. A., Darma P. N., Nakane A., Takei M. Metal particle detection by integration of a generative adversarial network and electrical impedance tomography (GAN-EIT) for a wet-type gravity vibration separator Sensors 2023 NaN23(19):8062. doi: 10.3390/s23198062. , “. ,” . , . , vol. , no. , p. . [DOI] [PMC free article] [PubMed] [Google Scholar]
- 19.Hansen P. C., O’Leary D. P. The use of the l-curve in the regularization of discrete ill-posed problems SIAM Journal on Scientific Computing 1993 NaN14(6):1487. doi: 10.1137/0914086. , “. ,” . , . , vol. , no. , pp. –. . [DOI] [Google Scholar]
- 20.Baidillah M. R., Iman A.-A. S., Sun Y., Takei M. Electrical impedance spectro-tomography based on dielectric relaxation model IEEE Sens J 2017 NaN17(24):8251. doi: 10.1109/JSEN.2017.2710146. , “. ,” . , . , vol. , no. , pp. –. . [DOI] [Google Scholar]
- 21.Sun B., Darma P. N., Ikeda K., Shirai T., Narita K., Takei M. Relationship between fat thickness and current density magnitude in calf muscles compartments under electrical muscle stimulation (EMS) by coupling of electromagnetic simulation and electrical impedance tomography (ES-EIT) J Vis (Tokyo) 2023 NaN26(6):1375. doi: 10.1007/s12650-023-00932-4. , “. ,” . , . , vol. , no. , pp. –. . [DOI] [Google Scholar]
- 22.Sakai K., Darma P. N., Sejati P. A., Wicaksono R., Hayashi H., Takei M. Gastric functional monitoring by gastric electrical impedance tomography (geit) suit with dual-step fuzzy clustering Sci Rep 2023 NaN13(1):514. doi: 10.1038/s41598-022-27060-7. , “. ,” . , . , vol. , no. , p. . [DOI] [PMC free article] [PubMed] [Google Scholar]
- 23.Darma P. N., Kawashima D., Takei M. Gastric electrical impedance tomography (gEIT) based on a 3d jacobian matrix and dual-step fuzzy clustering post-processing IEEE Sens J 2022 NaN22(14):14336. doi: 10.1109/JSEN.2022.3181052. , “. ,” . , . , vol. , no. , pp. –. . [DOI] [Google Scholar]
- 24.Hasgall PA, et al. Itis.swiss/database [7th Aug 2024];IT’IS Database for thermal and electromagnetic parameters of biological tissues https://itis.swiss/virtual-population/tissue-properties/database/tissue-frequency-chart/ “. ,” . . Web: . Accessed . . [Google Scholar]
- 25.Brazey B., Haddab Y., Zemiti N. Robust imaging using electrical impedance tomography: review of current tools Proceedings of the Royal Society A: Mathematical, Physical and Engineering Sciences 2022 NaN478(2258):20240011 doi: 10.1098/rspa.2021.0713. , “. ,” . , . , vol. , no. . [DOI] [PMC free article] [PubMed] [Google Scholar]


