

Summary
Gluten proteins are responsible for the viscoelastic properties of wheat flour but also for triggering pathologies in susceptible individuals, of which coeliac disease (CD) and noncoeliac gluten sensitivity may affect up to 8% of the population. The only effective treatment for affected persons is a strict gluten‐free diet. Here, we report the effectiveness of seven plasmid combinations, encompassing RNAi fragments from α‐, γ‐, ω‐gliadins, and LMW glutenin subunits, for silencing the expression of different prolamin fractions. Silencing patterns of transgenic lines were analysed by gel electrophoresis, RP‐HPLC and mass spectrometry (LC‐MS/MS), whereas gluten immunogenicity was assayed by an anti‐gliadin 33‐mer monoclonal antibody (moAb). Plasmid combinations 1 and 2 downregulated only γ‐ and α‐gliadins, respectively. Four plasmid combinations were highly effective in the silencing of ω‐gliadins and γ‐gliadins, and three of these also silenced α‐gliadins. HMW glutenins were upregulated in all but one plasmid combination, while LMW glutenins were downregulated in three plasmid combinations. Total protein and starch contents were unaffected regardless of the plasmid combination used. Six plasmid combinations provided strong reduction in the gluten content as measured by moAb and for two combinations, this reduction was higher than 90% in comparison with the wild type. CD epitope analysis in peptides identified in LC‐MS/MS showed that lines from three plasmid combinations were totally devoid of CD epitopes from the highly immunogenic α‐ and ω‐gliadins. Our findings raise the prospect of breeding wheat species with low levels of harmful gluten, and of achieving the important goal of developing nontoxic wheat cultivars.
Keywords: CD epitopes, gluten‐free diet, gluten intolerance, immunogenic peptides, RNAi fragments, wheat breeding
Introduction
Cereal grains contain about 10–15% (dry weight) of protein, from which gluten is the most important fraction as it is major determinant of the technological properties of baking cereals. However, gluten is not a single protein but a complex mix of proteins, which are deposited in the starchy endosperm during grain development. Gluten proteins are divided into two major fractions: the gliadins and the glutenins, which are different in terms of structure and functionality. In turn, gliadins are formed by three different fractions; ω‐, γ‐, and α‐gliadins, while glutenins comprise two fractions; the high molecular weight (HMW) and the low molecular weight (LMW) subunits. The gliadins are generally present as monomers and contribute extensibility to wheat flour dough. The glutenins contribute elasticity to dough and form large polymers linked by disulphide bonds.
These proteins make up a complex mixture that in a typical bread wheat cultivar may be comprised of up to 45 different gliadins, 7–16 LMW glutenin subunits and 3–6 HMW glutenin subunits. Gliadins and glutenins are not present at the same amount in the grain of cereals, and their proportions can vary within a broad range depending on both genotype (variety) and growing conditions (soil, climate, fertilization, etc.). The ratio of gliadins to glutenins was examined in a range of cereals (Wieser and Koehler, 2009), and hexaploid common wheat showed the lowest ratio (1.5 : 1–3.1 : 1), followed by durum wheat (3.1 : 1–3.4 : 1), emmer wheat (3.5 : 1–7.6 : 1) and einkorn wheat (4.0 : 1–13.9 : 1).
In addition to their unique viscoelastic properties, gluten proteins are responsible for triggering certain pathologies in susceptible individuals: (i) coeliac disease (CD), which affects both children and adults throughout the world at various frequencies (from 0.1% to >2.8%) (Abadie et al., 2011; Mustalahti et al., 2010), and (ii) noncoeliac gluten sensitivity, a newly recognized pathology of intolerance to gluten (Sapone et al., 2011) with an estimated prevalence of 6% for the USA population. However, gliadins and glutenins do not contribute equally to CD, and gliadins are indubitably the main toxic component of gluten as most (DQ2 or DQ8‐specific) CD4+ T‐lymphocytes obtained from small intestinal biopsies from coeliac patients seem to recognize this fraction (Arentz Hansen et al., 2002;). In the immune epitope database (IEDB) (http://www.iedb.org/), 190 T‐lymphocytes stimulating epitopes related to CD can be found. Of these, 180 (95%) map to gliadins, while only 10 (5%) map to glutenins.
However, not all gliadin epitopes are equally important in triggering CD. The α‐2‐gliadin family contains the 33‐mer peptide, present in the N‐terminal repetitive region, with six overlapping copies of three different DQ2‐restricted T‐cell epitopes with high stimulatory properties and highly resistant to human intestinal proteases (Shan et al., 2002; Tye‐Din et al., 2010). The α‐gliadins also contain the peptide p31‐43, which has been reported to induce mucosal damage via a non‐T‐cell‐dependent pathway (innate response) (Di Sabatino and Corazza, 2009; Maiuri et al., 2003). Moreover, an additional DQ2‐restricted epitope (DQ2.5‐glia‐α3) which partially overlaps with 33‐mer peptide (Vader et al., 2002) is present in α‐2‐gliadins.
Tye‐Din et al. (2010) comprehensively assessed the potentially toxic peptides contained within wheat, but also barley, and rye, and identified which ones stimulate T‐cells from patients with coeliac disease. They found that the 33‐mer peptide from wheat α‐gliadin was highly stimulatory, and another peptide (QPFPQPEQPFPW) from ω‐gliadin/C‐hordein was immunodominant after eating wheat, barley and rye. These two peptides present in wheat, plus another from barley, can elicit 90% of the immunogenic response induced by wheat, barley and rye (Tye‐Din et al., 2010). These findings showed that the immunotoxicity of gluten could be reduced to three highly immunogenic peptides, which make the development of varieties with low‐toxic epitopes more affordable.
One promising approach for reducing gluten toxicity and, therefore the incidence of gluten‐related intolerances in cereals, is the downregulation of immunodominant peptides by RNAi. This technology was applied to downregulate the expression of γ‐gliadins (Gil‐Humanes et al., 2008), ω‐5 gliadins (Altenbach and Allen, 2011), α‐gliadins (Becker et al., 2012) and all gliadins (Gil‐Humanes et al., 2010) in bread wheat. In all these reports, the silencing of gliadin fractions was accompanied by an increase in other storage proteins or nongluten proteins (Rosell et al., 2014). Protein extracts from transgenic lines with all three gliadin fractions downregulated were tested for stimulation of DQ2‐ and DQ8‐restricted T‐cell clones of patients with coeliac disease, and a pronounced reduction in proliferative responses was seen in some transgenic lines (Gil‐Humanes et al., 2010).
In the present work, we have tested the effectiveness of seven plasmid combinations encompassing RNAi fragments from α‐, γ‐, ω‐gliadins, and LMW glutenin subunits for selectively silencing different fractions of prolamins. The results from different fragments are comparable as all seven constructs were placed under the control of the same endosperm‐specific promoter. Wheat grain protein composition was substantially modified by some of the plasmid combinations, which provided wheat lines devoid of CD epitopes from α‐ and ω‐gliadins, the most immunogenic gluten fractions in wheat. The plasmid combinations reported here may be useful for the development of new wheat cultivars with low levels of harmful gluten.
Results
RNAi sequence combinations and plasmid design
Figure 1a shows the structure of the α‐, γ‐, and ω‐gliadins, and LMW glutenins indicating the gene regions where seven RNAi sequences were designed. These RNAi sequences varied in length from 109 to 377 (nucleotide sequences provided in Table S1) and were cloned from different domains of the gliadin sequences. The alpha/beta ZR RNAi fragment covered part of the repetitive domain of α‐gliadins plus the poly‐Q domain, and a small region of the nonrepetitive domain I, whereas the alpha RNAi fragment was PCR‐amplified from the nonrepetitive domain I. The γ‐gliadin RNAi (g8.1) sequence encompassed part of the nonrepetitive domain I of the γ‐gliadins, plus the Q‐rich domain and part of the nonrepetitive domain II. Among the ω‐gliadins, the omega RNAi sequence was designed containing part of the signal peptide, the N‐terminal domain, and part of the repetitive domain; whereas both the omega4 and omega8 were cloned from the 3′ end of the repetitive domain of the ω‐gliadins. The LMW fragment contained part of the signal peptide, the N‐terminal domain, and part of the repetitive domain of the LMW glutenins. The identity observed between the IR fragments and the nontargeted prolamin fractions was in all cases between 40% and 60% (Table S2). The RNAi sequences were in some cases combined by fusion PCR to provide five different RNAi fragments, which were inserted downstream a D‐hordein promoter to produce five hairpin plasmids (Figure 1b). Plasmids were further used alone or combined with others providing seven plasmid combinations (Figure 1c). Plasmids pghpg8.1 and pDhp_ω/α were described previously (Gil‐Humanes et al., 2008, 2010), whereas all other plasmids and plasmid combinations are compared for the first time in this work. In total, 21 transgenic wheat lines (Table S3) containing any of the seven combination of plasmids (1–6 different lines for each combination) were assayed for the downregulation of gliadins and effects on other protein fractions, agronomic parameters, and the content of coeliac disease‐related gliadins as determined using the G12 monoclonal antibody and CD immunogenic peptides identified by LC‐MS/MS. Parental line and null segregants for most of the transgenic lines were generated and assayed. However, no significant differences were found between these null segregants and the parental line for the above parameters. Therefore, only parental line was included in all comparisons with transgenic lines.
Figure 1.
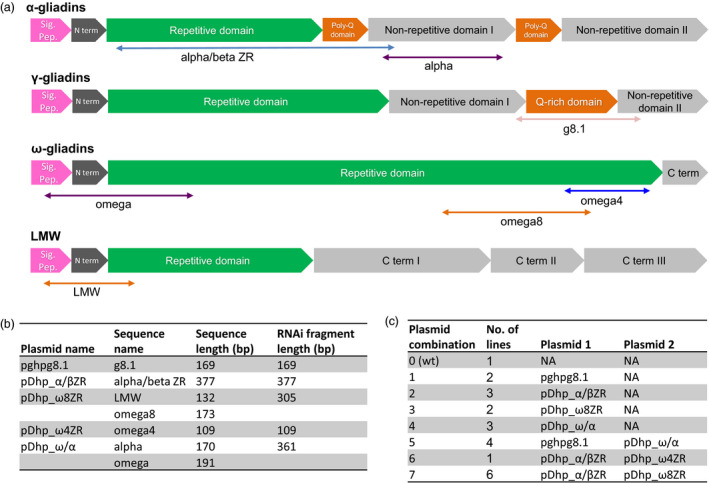
Plasmid design. (a) Structure of α‐, γ‐, and ω‐gliadins, and LMW glutenins as reviewed in (Qi et al., 2006), indicating the domains for each family where sequences for RNAi fragments were designated. (b) Sequences were or were not combined into a unique RNAi fragment and inserted downstream a D‐hordein promoter providing five different hairpin plasmids. (c) Plasmids were used alone or combined into seven combinations where number 0 corresponds to BW208 wild type (wt).
Plasmid combinations and patterns of silencing
Silencing patterns in all 21 transgenic lines were analysed by A‐PAGE and SDS‐PAGE, and the gliadin and glutenin fractions quantified by RP‐HPLC and compared with the untransformed wild‐type BW208 (denoted as Plasmid Combination 0). Examples of gliadin and glutenin patterns obtained with all seven plasmid combinations are in Figure S1. Detailed results for each line are in Supplementary Table S4. Figure 2 shows the transgenic lines and the effects of each plasmid combinations on the gliadin and glutenin fractions. Plasmid Combination 1 clearly targeted the γ‐gliadin fraction while ω‐, and α‐gliadins were upregulated. This Plasmid Combination did not significantly affect the total amount of the glutenin fractions. However, not all LMW glutenins were equally affected: while the amount of LMW glutenins appearing between 45 and 60 min of retention time decreased, LMW peaks between 35 and 45 min of retention time were slightly increased compared with the wild type (Figure S1). Plasmid Combination 2 achieved a greater reduction in the α‐gliadin fraction, with no major effects on other gliadin fractions, and an important increment in the HMW glutenin fraction compared with the wild type. Plasmid Combination 3 provided a significant reduction in all three ω‐, γ‐, and α‐gliadin fractions, and also a strong reduction in the LMW glutenin content, but an important increment in the HMW glutenin fraction (Figure 2b). In contrast to Plasmid Combination 1, Combination 3 affected mainly the LMW in the region between 35 and 45 min of retention time (Figure S1). Plasmid Combination 4 also provided a strong reduction in all three gliadin fractions, and a significant increment in the HMW glutenin fraction. However, in contrast to Plasmid Combination 3, the LMW glutenins were not reduced. Plasmid Combinations 5, 6 and 7 were equally effective in the downregulation of ω‐gliadins (Figure 2a), although Combination 5 was more effective in the downregulation of γ‐gliadins, and Combinations 6 and 7 in the downregulation of α‐gliadins (Figure 2a). These Plasmid Combinations (5, 6, and 7) also had an important impact in the glutenin fraction; while all three Plasmid Combinations decreased the content of LMW glutenins (with wide differences within Combination 5), only Combination 7 showed a strong increment in the HMW glutenin fraction (Figure 2b).
Figure 2.
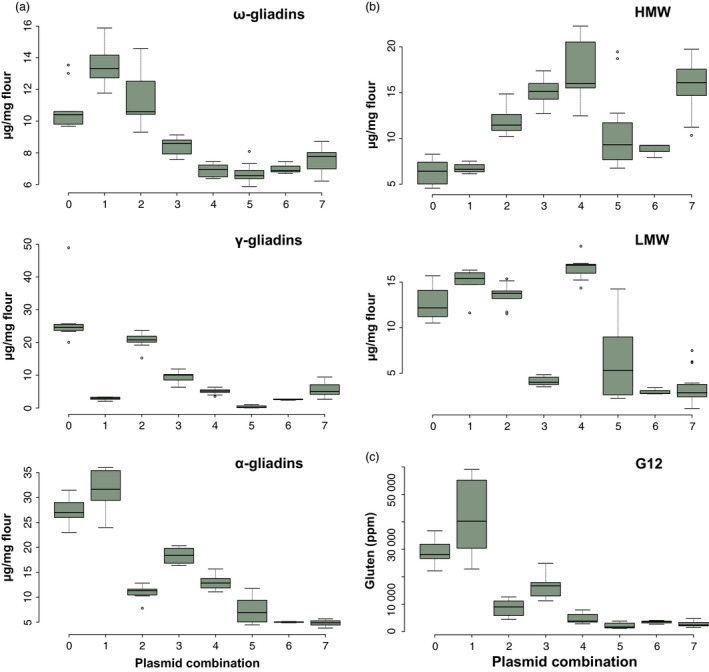
Box plots of gliadins (a) and glutenins (b) distribution in the grain of transgenic lines with seven plasmid combinations expressed as μg protein/mg flour. HMW and LMW denote the high molecular weight and low molecular weight subunits of glutenins, respectively. (c) Box plot of gluten content with seven plasmid combinations calculated by G12 competitive ELISA and expressed in parts per million (ppm). Plasmid combinations are as indicated in Figure 1c. Plasmid Combination 0 corresponds to BW208 wild type.
Protein fraction redistributions kernel composition and agronomic traits
Figure S2 shows the fold change in kernel composition of transgenic lines with the different plasmid combinations. Gliadins, Gli/Glu ratio and total prolamin content were significantly reduced in all the transgenic combinations compared with the control (Combination 0). Plasmid Combinations 5, 6 and 7, all three combinations of two different plasmids, were the most effective in the downregulation of total gliadin content in transgenic wheat (Table 1). Only three plasmid combinations, 2, 4 and 6, had significant effect on total glutenin content; Plasmid Combinations 2 and 4 increased the total glutenin content in transgenic wheat, whereas Combination 6 decreased it (Table 1 and Figure S2). The Gli/Glu ratio decreased significantly in all seven plasmid combinations compared with the wild type, with the largest differences found for Combinations 4, 5 and 7. As consequence of these changes, the prolamin fraction (comprising gliadins plus glutenins) was strongly decreased when Plasmid Combinations 5, 6 and 7 were used. In contrast, nongluten proteins, which represented about 4.3% DW in the wild type (Plasmid Combination 0), increased up to 9.9%, 10.6% and 9.4% DW in Plasmid Combinations 5, 6 and 7, respectively (Table 1). Nongluten proteins compensated the downregulation of prolamins, and total protein was not affected by any of the seven plasmid combinations, all of them showing protein contents around 13% DW. The major component of wheat grain, starch, was not significantly affected by the changes in the protein fraction observed with the seven combinations of plasmids. Hence, the lowest value for starch content was 62.8% DW for Plasmid Combinations 4 and 6, which was not significantly different to the 66.0% DW of the wild type (Table 1).
Table 1.
Average values for protein fractions, and quality and agronomic parameters for each plasmid combination
| Parameter | Plasmid combination | |||||||
|---|---|---|---|---|---|---|---|---|
| 0 (wt) | 1 | 2 | 3 | 4 | 5 | 6 | 7 | |
| Total gliadins (μg/mg flour) | 65 | 47.8** | 43.0** | 36.2** | 24.9** | 14.4** | 14.6** | 18.1** |
| Total glutenins (μg/mg flour) | 18.9 | 21.6 | 25.4** | 19.2 | 33.7** | 16.7 | 11.8* | 19.2 |
| Gli/Glu ratio | 3.5 | 2.2** | 1.7** | 1.9** | 0.7** | 0.9** | 1.3** | 1.0** |
| Total prolamins (μg/mg flour) | 84.0 | 69.4** | 68.4** | 55.4** | 58.6** | 31.1** | 26.4** | 37.3** |
| Nongluten proteins (% DW) | 4.3 | 5.9* | 5.9* | 7.2** | 7.4** | 9.9** | 10.6** | 9.4** |
| Grain protein (% DW) | 13.4 | 13.3 | 13.2 | 13.1 | 13.7 | 13.3 | 13.5 | 13.4 |
| Gluten content (ppm) | 29494 | 41332** | 8511** | 16721** | 4796** | 2146** | 3479** | 2720** |
| Starch (% DW) | 66.0 | 64.5 | 64.0 | 66.8 | 62.8 | 63.5 | 62.8 | 65.4 |
| SDSS (mL) | 9.3 | 8.6 | 10.4** | 6.6** | 9.6 | 7.0** | 6.2** | 6.6** |
| Anthesis (days) | 149 | 147 | 147 | 152 | 148 | 148 | 152 | 152 |
| Kernel weight (g) | 36.3 | 39.9* | 37.5 | 36.9 | 32.6 | 30.2** | 31.4* | 32.0* |
| Test weight (g/L) | 829.2 | 845.8 | 834.7 | 827.8 | 812.5 | 797.4* | 791.7* | 808.2 |
Plasmid combinations are as indicated in Figure 1C; DW, Dried Weight; ppm, parts per million; SDSS, sodium dodecyl sulphate sedimentation.
Significant differences were identified at the 5% (*) and 1% (**) probability levels by the two‐sided Dunnett's multiple comparisons with control indicated as (0) in plasmid combination.
Agronomic traits such as days to anthesis, kernel weight and test weight were determined in transgenic plants from all seven plasmid combinations and compared with that of the wild type. As showed in Table 1, the number of days from sowing to anthesis was around the 149 days in the wild type, with no significant differences for transgenic plants from all seven plasmid combinations. Kernel weights showed higher values than the wild type in Plasmid Combination 1, whereas Combinations 5, 6 and 7 had lower weights (Table 1 and Figure S2). With respect to kernel weight, these differences were significant for Combinations 1, 5, 6 and 7, and in the case of test weight for Combinations 5 and 6.
LC‐MS/MS analysis of the protein fraction in plasmid combinations
Total protein extracted from all plasmid combinations was also analysed by LC‐MS/MS after PT‐digestion. The total fragments detected by MS ranged from 46,287 (Plasmid Combination 1) to 52,129 (Plasmid Combination 7) (Table 2). Approximately 3% to 10% of these fragments were identified using the NCBI protein database restricted to Triticum species, comprising 146–198 proteins. More than 70% and 38% of the identified fragments and proteins, respectively, were seed storage proteins (SSPs). Although Plasmid Combination 1 targets γ‐gliadins, the number of identified γ‐gliadin fragments was not as low as would be expected (Table 2). In addition, the number of LMW glutenins was higher and that of ω‐gliadins was lower. In Plasmid Combination 2, the number of α‐gliadin peptides was lower but that of γ‐ and ω‐gliadins and glutenins was similar to the wild type. The profile of gliadin fraction in Plasmid Combination 3 was similar to the control, but the proportion of fragments derived from LMW glutenin was lower and that of nongluten proteins was higher. In contrast to Plasmid Combination 3, in Plasmid Combination 4 the number of gliadin fragments was lower and that of HMW glutenins was higher, while LMW glutenins were similar to the wild type. In this combination, the proportion of nongluten fragments was also higher. In Plasmid Combinations 5–7, the gliadin fraction was greatly decreased, affecting mainly the α‐gliadin in Combinations 6 and 7 and all gliadins in the Combination 5. The proportion of LMW glutenin peptides was also decreased with higher effect in Plasmid Combination 7, and with a strong increase in HMW glutenins in Plasmid Combination 5. There was also an increase in the proportion of nongluten protein fragments in these three combinations. In general, the higher proportion of nongluten fragments was due to the increase in serpins, globulins and triticins.
Table 2.
Fragments and proteins identified by LC‐MS/MS analysis in all seven plasmid combinations
| Plasmid Combination | 0 | 1 | 2 | 3 | 4 | 5 | 6 | 7 | ||||||||
|---|---|---|---|---|---|---|---|---|---|---|---|---|---|---|---|---|
| Line | BW208 | D623 | I17 | H754 | D783 | E82 | H320 | H811 | ||||||||
| Fragments | Proteins | Fragments | Proteins | Fragments | Proteins | Fragments | Proteins | Fragments | Proteins | Fragments | Proteins | Fragments | Proteins | Fragments | Proteins | |
| Total | 48405 | ND | 46287 | ND | 51660 | ND | 48480 | ND | 50980 | ND | 51221 | ND | 50365 | ND | 52129 | ND |
| Triticum | 3240 | 184 | 4832 | 198 | 1639 | 149 | 3436 | 197 | 1639 | 187 | 1464 | 162 | 2141 | 181 | 1616 | 146 |
| α‐gliadins | 1554 | 32 | 3107 | 44 | 21 | 2 | 1323 | 29 | 262 | 11 | 37 | 3 | 0 | 0 | 7 | 1 |
| γ‐gliadins | 404 | 14 | 341 | 15 | 409 | 14 | 641 | 18 | 189 | 13 | 33 | 5 | 555 | 20 | 361 | 13 |
| ω‐gliadins | 347 | 9 | 244 | 5 | 264 | 6 | 279 | 9 | 22 | 2 | 10 | 1 | 226 | 6 | 99 | 4 |
| Total gliadins | 2305 | 55 | 3692 | 64 | 694 | 22 | 2243 | 56 | 473 | 26 | 80 | 9 | 781 | 26 | 467 | 18 |
| LMW | 104 | 12 | 317 | 22 | 83 | 12 | 50 | 7 | 150 | 15 | 91 | 14 | 82 | 11 | 0 | 0 |
| HMW | 11 | 1 | 13 | 2 | 11 | 2 | 13 | 2 | 42 | 6 | 172 | 7 | 64 | 6 | 35 | 3 |
| Total glutenins | 115 | 13 | 330 | 24 | 94 | 14 | 63 | 9 | 192 | 21 | 263 | 21 | 146 | 17 | 35 | 3 |
| Total prolamins | 2420 | 68 | 4022 | 88 | 788 | 36 | 2306 | 65 | 665 | 47 | 343 | 30 | 927 | 43 | 502 | 21 |
| γ‐secalin | 72 | 3 | 39 | 2 | 28 | 1 | 123 | 5 | 12 | 1 | 0 | 0 | 109 | 3 | 20 | 1 |
| ω‐secalin | 93 | 3 | 36 | 1 | 82 | 3 | 51 | 3 | 7 | 1 | 0 | 0 | 54 | 2 | 0 | 0 |
| γ‐hordein‐like | 2 | 1 | 16 | 2 | 2 | 1 | 2 | 1 | 7 | 2 | 5 | 2 | 2 | 1 | 0 | 0 |
| γ‐gliadin‐like | 73 | 3 | 61 | 4 | 12 | 1 | 83 | 4 | 22 | 2 | 7 | 1 | 55 | 2 | 85 | 4 |
| Gliadin/avenin‐like | 38 | 3 | 44 | 5 | 50 | 5 | 33 | 4 | 41 | 5 | 29 | 4 | 24 | 4 | 46 | 4 |
| AAI | 48 | 9 | 53 | 8 | 67 | 10 | 72 | 10 | 69 | 11 | 78 | 13 | 71 | 11 | 77 | 10 |
| Globulins | 106 | 5 | 105 | 4 | 132 | 5 | 178 | 6 | 157 | 5 | 210 | 6 | 211 | 6 | 228 | 8 |
| Triticins | 8 | 1 | 10 | 1 | 17 | 1 | 18 | 1 | 25 | 1 | 60 | 2 | 27 | 1 | 28 | 1 |
| Serpin | 70 | 6 | 114 | 6 | 137 | 7 | 182 | 8 | 231 | 9 | 314 | 9 | 247 | 8 | 255 | 8 |
| Nongluten Proteins | 270 | 24 | 326 | 24 | 403 | 28 | 483 | 29 | 523 | 31 | 691 | 34 | 580 | 30 | 634 | 31 |
| LTPs | 3 | 1 | 3 | 2 | 4 | 1 | 4 | 1 | 3 | 1 | 4 | 2 | 3 | 1 | 3 | 1 |
| β‐amylase | 44 | 2 | 47 | 2 | 41 | 2 | 62 | 2 | 54 | 2 | 65 | 2 | 57 | 2 | 64 | 2 |
| Total SSPs | 2737 | 95 | 4398 | 116 | 1236 | 67 | 2855 | 97 | 1245 | 81 | 1103 | 68 | 1567 | 76 | 1203 | 55 |
CD immunotoxic peptides in fragments identified by LC‐MS/MS
In peptides identified by LC‐MS/MS analysis against Triticum proteins, CD immunogenic epitopes (Sollid et al., 2012) and the p31‐43 fragment of α‐gliadins were searched allowing up to one mismatch (Tables 3 and S5). In the wild type, a total of 645 epitopes with perfect match were found in 3,240 identified peptides, being most of them epitopes reported in γ‐gliadins (482 epitopes) followed by α‐gliadin (92 epitopes) and ω‐gliadin (24 epitopes) (Table 3). HMW glutenin epitopes were not found in these peptides. In transgenic lines, total perfect match epitopes ranged from 55 in Plasmid Combination 5 to 849 in Plasmid Combination 3 (Table 3), γ‐gliadin epitopes being the most abundant in all combinations. α‐gliadin epitopes were not found in the identified peptides in Plasmid Combinations 2, 5 and 6, and were much lower than wild type in Combinations 4 and 7. Furthermore, the number of ω‐gliadin epitopes found was lower in Plasmid Combinations 4, 5 and 7. Plasmid Combination 5 also exhibited the lowest number of γ‐gliadin epitopes and an increase in HMW glutenin epitopes. The p31‐43 fragment was lower in all transgenic lines except in Plasmid Combination 1, and it was not found in Plasmid Combinations 2, 6 and 7. Of the α‐gliadin epitopes, the most abundant was DQ2.5‐glia‐α2, followed by DQ2.5‐glia‐α1b and DQ2.5‐glia‐α1a (Table 3). Among the γ‐gliadin epitopes, DQ2.5‐glia‐γ4c/DQ8‐glia‐γ1a and DQ2.5‐glia‐γ5 were the majority. LMW glutenin epitopes were not found in Combinations 3 and 4, were lower in Combinations 2 and 7 and were similar to wild‐type levels in 5 and 6, and higher than wild type in Plasmid Combination 1. Epitopes matched to that reported in hordeins were lower in all transgenics.
Table 3.
Number of CD immunogenic epitopes with perfect match and found in peptides identified by MS
| Prolamin | Epitope | Deaminated sequence | Plasmid combination | 0 | 1 | 2 | 3 | 4 | 5 | 6 | 7 |
|---|---|---|---|---|---|---|---|---|---|---|---|
| Line | BW208 | D623 | I17 | H754 | D783 | E82 | H320 | H811 | |||
| Original sequence | |||||||||||
| γ‐gliadin | DQ2.5‐glia‐g4c/DQ8‐glia‐g1a | QQPEQPFPQ/EQPQQPFPQ | QQPQQPFPQ | 262 | 203 | 225 | 383 | 72 | 18 | 272 | 148 |
| γ‐gliadin | DQ2.5‐glia‐g5 | QQPFPEQPQ | QQPFPQQPQ | 181 | 185 | 122 | 241 | 15 | 12 | 210 | 67 |
| γ‐gliadin | DQ2.5‐glia‐g1/DQ8.5‐glia‐g1 | PQQSFPEQQ/PQQSFPEQE | PQQSFPQQQ | 17 | 7 | 10 | 36 | 16 | 1 | 25 | 17 |
| γ‐gliadin | DQ2.5‐glia‐g3/DQ8‐glia‐g1b | QQPEQPYPQ/EQPQQPYPE | QQPQQPYPQ | 7 | 5 | 3 | 15 | 8 | 0 | 14 | 8 |
| γ‐gliadin | DQ2.5‐glia‐g4a | SQPEQEFPQ | SQPQQQFPQ | 5 | 0 | 5 | 8 | 1 | 0 | 3 | 5 |
| γ‐gliadin | DQ2.5‐glia‐g2 | IQPEQPAQL | IQPQQPAQL | 4 | 4 | 7 | 7 | 4 | 2 | 4 | 7 |
| γ‐gliadin | DQ2.5‐glia‐g4b | PQPEQEFPQ | PQPQQQFPQ | 3 | 5 | 0 | 20 | 1 | 0 | 11 | 3 |
| γ‐gliadin | DQ2.5‐glia‐g4d | PQPEQPFCQ | PQPQQPFCQ | 3 | 0 | 0 | 3 | 0 | 0 | 1 | 0 |
| Total γ‐gliadin | 482 | 409 | 372 | 713 | 117 | 33 | 540 | 255 | |||
| α‐gliadin | DQ2.5‐glia‐a2 | PQPELPYPQ | PQPQLPYPQ | 43 | 63 | 0 | 49 | 4 | 0 | 0 | 2 |
| α‐gliadin | DQ2.5‐glia‐a1b | PYPQPELPY | PYPQPQLPY | 30 | 40 | 0 | 30 | 4 | 0 | 0 | 1 |
| α‐gliadin | DQ2.5‐glia‐a1a | PFPQPELPY | PFPQPQLPY | 15 | 29 | 0 | 17 | 1 | 0 | 0 | 0 |
| α‐gliadin | DQ2.5‐glia‐a3 | FRPEQPYPQ | FRPQQPYPQ | 0 | 3 | 0 | 2 | 0 | 0 | 0 | 0 |
| α‐gliadin | DQ8‐glia‐a1 | EGSFQPSQE | QGSFQPSQQ | 4 | 13 | 0 | 7 | 0 | 0 | 0 | 0 |
| Total α‐gliadin | 92 | 148 | 0 | 105 | 9 | 0 | 0 | 3 | |||
| ω‐gliadin | DQ2.5‐glia‐w1 | PFPQPEQPF | PFPQPQQPF | 17 | 8 | 11 | 14 | 2 | 0 | 13 | 3 |
| ω‐gliadin | DQ2.5‐glia‐w2 | PQPEQPFPW | PQPQQPFPW | 7 | 4 | 4 | 1 | 0 | 0 | 3 | 1 |
| Total ω‐gliadin | 24 | 12 | 15 | 15 | 2 | 0 | 16 | 4 | |||
| HMW‐GS | DQ8‐glut‐1 | QGYYPTSPQ | QGYYPTSPQ | 0 | 0 | 1 | 2 | 2 | 9 | 4 | 3 |
| α‐gliadin | p31‐43 | PGQQQPFPPQQPY | PGQQQPFPPQQPY | 13 | 14 | 0 | 3 | 3 | 0 | 0 | 0 |
| α‐gliadin | p31‐43 | LGQQQPFPPQQPY | LGQQQPFPPQQPY | 8 | 6 | 0 | 6 | 3 | 1 | 0 | 0 |
| Total α‐gliadin p31‐43 | 21 | 20 | 0 | 9 | 6 | 1 | 0 | 0 | |||
| LMW‐GS | DQ2.5‐glut‐L1 | PFSEQEQPV | PFSQQQQPV | 16 | 24 | 4 | 0 | 0 | 11 | 15 | 2 |
| LMW‐GS | DQ2.5‐glut‐L2 | FSQQQESPF | FSQQQQSPF | 0 | 1 | 0 | 0 | 0 | 1 | 0 | 0 |
| Total LMW‐GS | 16 | 25 | 4 | 0 | 0 | 12 | 15 | 2 | |||
| Hordein | DQ2.5‐hor‐2 | PQPEQPFPQ | PQPQQPFPQ | 10 | 1 | 4 | 5 | 1 | 0 | 3 | 2 |
| Hordein | DQ2.5‐hor‐3 | PIPEQPQPY | PIPQQPQPY | 0 | 0 | 0 | 0 | 0 | 0 | 0 | 0 |
| Total Hordein | 10 | 1 | 4 | 5 | 1 | 0 | 3 | 2 | |||
The epitopes with one mismatch also showed a similar pattern to those with perfect match. A total of 842 epitopes were found in the wild type, where 603 were γ‐gliadin epitopes, 95 ω‐gliadin and 82 α‐gliadin epitopes (Table S5). Similarly, a drastic decrease in all gliadin epitopes and an increase in HMW glutenin epitopes were observed in Plasmid Combination 5. Epitopes with one mismatch of all gliadins were also decreased in Combinations 4 and 7 compared with the wild type, with a decrease in LMW glutenin epitopes in the latter. Plasmid Combinations 2, 3 and 6 presented lower number of α‐gliadin epitopes, but differing in γ‐gliadin (slightly lower in combination 2) and ω‐gliadin (slightly increased in Combinations 3 and 6) epitopes. In Plasmid Combination 1, γ‐ and ω‐gliadin epitopes were slightly decreased, but LMW glutenin was increased compared with wild type. A drastic increase in Hordein epitopes was observed in Plasmid Combination 2. These results suggest that the Plasmid Combinations 4 and 5 have lower CD toxicity than wild type and other transgenics.
Transgenic lines and gluten immunogenicity by anti‐gliadin 33‐mer moAb
The 33‐mer peptide derived from α‐2 gliadin (residues 57–89) is one of the most highly antigenic peptides identified to date (Shan et al., 2002; Tye‐Din et al., 2010). This peptide was identified as the primary initiator of the inflammatory response to gluten in patients with CD. This 33‐mer fragment is naturally formed by digestion with gastric and intestinal proteases, binds to DQ2 after deamidation by tissue transglutaminases (tTG), contains a cluster of 6 T‐cell epitopes and is the most immunodominant peptide in patients with CD after eating wheat‐based products (Shan et al., 2002; Tye‐Din et al., 2010).
The G12 monoclonal antibody (moAb) is able to recognize with great sensitivity peptides (besides the 33‐mer) inmunotoxic for patients with CD. The sensitivity and epitope preferences of this antibody were found to be useful for detecting gluten‐relevant peptides to infer the potential toxicity of cereals for patients with CD (Comino et al., 2011; Morón et al., 2008b). Immunotoxic properties of the seven lines were studied with G12 to study the reduced toxicity profile.
As shown in Figure 2c, the reactive gluten identified by G12 moAb strongly decreased in transgenic lines for Plasmid Combinations 3, 4, 5, 6 and 7, but increased in wheat lines for Combination 2. We observed reductions of 84%, 93%, 88% and 92% gluten content by competitive G12 moAb in transgenic lines for Plasmid Combinations 4, 5, 6, and 7, respectively, in comparison with the wild type. G12 values for individual lines are shown in Table S4.
Discussion
IR sequences were designed using different regions of the gliadin and LMW coding sequences and combined to form seven different RNAi constructs (Figure 1). These combinations promoted differential changes in the prolamin (gliadins and glutenins) composition of the transgenic plants generated (Figure 2). Interestingly, pleiotropic effects (i.e. stronger downregulation of the targeted gliadin groups) were observed when two RNAi constructs with IR fragments targeting different groups were combined in the same transgenic plant. For example, downregulation of α‐ and γ‐gliadins was stronger in Combination 5 (pDhp_ω/α and the pghpg8.1 vectors) than when they were used alone (Combinations 4 and 1, respectively). Similarly, the downregulation of ω‐gliadins was significantly stronger in the Combination 7, in which the pDhp_ω8ZR was cotransformed with the pDhp_αβ/ZR, than when only the pDhp_ω8ZR was used (Combination 3). The same was observed in the α‐gliadins, with a stronger downregulation in the Combinations 6 and 7 (both with the pDhp_αβ/ZR plasmid plus a second plasmid targeting different prolamins) than in the Combination 2 (the pDhp_αβ/ZR plasmid alone). In summary, the on‐target silencing was normally higher when a second IR sequence (targeting a different gliadin group) was cotransformed, which might be a consequence of (i) off‐target activity of the second IR fragment, (ii) reduction in the cells of potential off‐target mRNA sequences that compete with the on‐target gliadin mRNAs for recognition and degradation by the post‐transcriptional silencing machinery, or (iii) a combination of both effects. When short interfering RNAs (siRNAs) from a certain double‐stranded RNA (dsRNA) sequence are formed, they lead the RNA‐induced silencing complex (RISC) to recognize homologous mRNA sequences for their cleavage and degradation (Hammond et al., 2000). It has been previously reported that nonspecific downregulation can occur during RNAi as 100% identity between the silencing siRNA and the target gene is not absolutely required to promote gene silencing (Senthil‐Kumar et al., 2007; Xu et al., 2006). In fact, only 14 nucleotides (or even less) of sequence complementarity between siRNA and mRNA can lead to gene silencing in plants (Jackson and Linsley, 2004; Jackson et al., 2006). Therefore, by reducing the number of possible off‐target sequences in the cell, the probability of the siRNA to find the on‐target sequences is enhanced, and so is the efficiency of the gene silencing.
The identity observed between the IR fragments and the nontargeted prolamin fractions (40–60%) would make it possible for there to be, among the pool of siRNAs formed from each IR fragment, some with total (or almost total) identity with nontargeted prolamins. This fact could explain the off‐target silencing observed with some plasmid combinations. For example, α‐ and γ‐gliadins were downregulated with Combination 3 that only contains the LMW and omega8 IR fragments (Figure 2). Similarly, Combination 6 showed off‐target reduction in γ‐gliadins and LMW glutenins (Figure 2). These results fit with the off‐target downregulation of γ‐gliadins and LMW glutenins reported in previous studies when using the IR ω/α (omega and alpha RNAi fragments) (Gil‐Humanes et al., 2010, 2014) (Gil‐Humanes et al., 2011). By contrast, Plasmid Combinations 1 and 2 were highly specific to their on‐target gliadin group (γ‐ and α‐gliadins, respectively) and did not silence any of the other prolamin groups. Moreover, the high number of γ‐ gliadin fragments found by LS‐MS/MS for Combination 1 could be explained as a consequence of the high specificity of the pgphp8.1 fragment in silencing just some of the proteins in this family. The analysis of the 11 active genes reported for the cultivar Chinese Spring (Anderson et al., 2013) shows that the identity between those sequences and the pgphp8.1 fragment varies from less than 60% to nearly 100%. Two of the proteins with lower identity (ɣ‐gliadin 3, 60.4%, and ɣ‐gliadin 4, 61.6%) are those containing an odd number of cysteine residues, supporting the hypothesis that the amount of gamma gliadin as measured by RP‐HPLC in our lines may be underestimated because they could be part of the polymer fraction.
The silencing of gliadins and LMW glutenins did not affect total protein and starch content or kernel weight. In contrast, quality parameters like SDSS and the gliadins to glutenins ratio were affected by the silencing of gliadins. The SDS sedimentation test provides information on the protein quantity and the quality of ground wheat and flour samples (Carter et al., 1999). Positive correlations were observed between sedimentation volume and gluten strength, and hence, SDSS test should be an effective small‐scale test for quality assessment. As plasmid combinations 3, 5, 6 and 7 had lower SDSS values than wild type, they might exhibit also lower gluten strength. The fact that Plasmid Combination 4 showed a SDSS value similar to the wild type, with lower gliadin content, but significantly higher contents of glutenins may indicate that glutenins are major determinants of SDSS as previously reported (Piston et al., 2011).
Because we did not perform quantitative LC‐MS/MS analysis, the number of protein fragments and immunotoxic epitopes identified do not necessarily reflect their abundance in the total gluten protein. In addition, not all epitopes are equally immunogenic for CD (Tye‐Din et al., 2010). The number of α‐gliadin peptides and epitopes were well correlated with α‐gliadin quantified by RP‐HPLC. The DQ2.5‐glia‐α3 epitope, downstream of the 33‐mer fragment, was the least abundant probably due to its digestibility with Trypsin. Because γ‐gliadins contain 5–10 epitopes per sequence (Salentijn et al., 2012), a high number of these epitopes was identified in almost all lines analysed, most prevalent being the epitopes DQ2.5‐glia‐γ4c/DQ8‐glia‐γ1a and DQ2.5‐glia‐γ5. In general, a lower number of CD epitopes was observed in transgenic lines generated using two plasmids, with the exception of Plasmid Combination 6.
As expected, the changes observed in the prolamin fractions led to changes in the immunotoxicity of lines generated from the different combinations of plasmids, as determined by the G12 moAb assay (Figure 2c). The 33‐mer peptide is highly resistant to digestion and one of the main immunodominant toxic peptide in patients with coeliac disease (Tye‐Din et al., 2010). The sensitivity and epitope preferences of the G12 antibody has been found to be useful for detecting gluten‐relevant peptides to predict the potential toxicity of cereal foods for patients with CD (Morón et al., 2008a). Moreover, the reactivity of G12 moAb with cereal storage proteins of different varieties of cereals has been correlated with the known dietary immunotoxicity of the different grains (Comino et al., 2011). All the combinations of plasmids, except Combination 1, resulted in a reduction in the reactivity of the G12 moAb, and consequently a decrease in the immunotoxicity of the gluten proteins. The level of reduction in the different combinations was strongly correlated (92.38%, P < 0.001) with the level of reduction in the α‐gliadin fraction, and was also well correlated with the number of α‐gliadin epitopes found in MS analysis. This observation may be explained by the fact that the G12 moAb mainly recognizes the hexapeptide QPQLPY found in the 33‐mer peptide of α2‐gliadin, although it also binds to other related peptide variants of immunotoxic gluten proteins (Morón et al., 2008a).
Our present results indicate that RNAi can be a very effective approach for obtaining wheat lines without, or with very low levels of gliadins and LMW glutenins, the major gluten proteins containing epitopes triggering coeliac disease. Six of the plasmid combinations tested showed strong reduction in the gluten content as measured by competitive anti‐gliadin 33‐mer moAb and in two combinations, this reduction was higher than 90% by comparison with the wild type. Transgenic lines from three plasmid combinations were found to be totally devoid of CD epitopes from the highly immunogenic α‐ and ω‐gliadins. These lines have potential to be used directly in breeding programs for obtaining wheat cultivars suitable for coeliac or other gluten intolerant patients, and the effective plasmid combinations identified may be used to downregulate toxic epitopes in other wheat backgrounds.
Experimental procedures
Plasmid design and construction
For the synthesis of the RNAi vectors, conserved regions of the α‐, γ‐, and ω‐gladins were PCR‐amplified from genomic DNA isolated from the bread wheat (Triticum aestivum) cv. Bobwhite 208 (BW208) and cloned in sense and antisense orientation, separated by the Ubi1 intron to form the inverted repeat (IR) sequences. The relative position of each IR on their corresponding gliadin sequences is shown in Figure 1a. In total, we synthesized five different plasmids (Figure 1b). The synthesis of plasmids pghpg8.1 and pDhp_ω/α was described in (Gil‐Humanes et al., 2008, 2011), respectively. The vectors pDhp_α/βZR, pDhp_ω4ZR and pDhp_ω8ZR were synthesized for this work using the GATEWAY (Invitrogen) recombination technology. Three different pairs of primers were used for the amplification of the IR fragments of these vectors: primers alpha/betaF (AATTGCAGCCACAAAATCCATCTCAG) and alpha/betaR (CATCCMTGCATGGAATCAGTTGTTG) for the alpha/betaZR fragment; primers omega8F (CCTATCTTTGTCCTCCTTGCC) and omega8R (CATCGTTACATTGAACGCTCA) for the omega8 and LMW fragments; and primers omega4F (CAACAATCCCCTGAACAACA) and omega4R (GCTGGGGTGGGTATGGTATT) for the omega4 fragment. The expression of the IRs was driven by an endosperm‐specific D‐hordein promoter (Piston et al., 2008), with the nopaline synthase (nos) as terminator sequence.
Plant material and genetic transformation
All lines described in this work are transgenic lines derived from bread wheat cv. BW208. Lines C655, D623, 28A, 28B, D783, E33, E42, E82 and E83 were reported previously (Piston et al., 2013). The rest of transgenic lines were produced in the present work using immature scutella as explants for genetic transformation as described in León et al., 2009;. Plasmids carrying the RNAi fragments were used in combination with plasmid pAHC25 containing the selectable bar gene (Christensen and Quail, 1996). For bombardment, plasmids were precipitated onto 0.6‐μm gold particles at 0.5 pmol/mg gold for pAHC25 and 0.75 pmol/mg gold for the plasmids containing the RNAi fragments. Putative transgenic plants were then transferred to soil and grown to maturity in the greenhouse. Homozygous progeny of plants containing the RNAi plasmids were first identified by PCR using the forward primer prHorD*3 (GGGGTACCCATTAATTGAACTCATTCGGGAAGC) and one of the reverse primers specific for each RNAi construct: SUbiR (GCGTACCTTGAAGCGGAGGTGGTCGACTCTAGATTGCAACACCAATGATCTGATCG) for the pghpg8.1 plasmid, alpha/betaR for the pDhp_α/βZR plasmid, omega8R for the pDhp_ω8ZR plasmid, omega4R for the pDhp_ω4ZR plasmid and omega_III_R_overlapping (CAGTTGTTGTTGAAATGGTTGTTGCGATGG) for the pDhp_ω/α plasmid. Then, PCR‐positive transgenic plants were analysed by A‐PAGE of endosperm proteins in lines produced by single half‐seed descent. Homozygous lines were self‐pollinated for three generations and assayed as described below.
Experimental design and statistical analysis
The homozygous transgenic lines were assayed using randomized complete block designs with three replicates of five plants each. All five plants per line and block were bulked, and each block was treated as biological replications and analysed separately. For each line and block, at least two technical replications were used. Data were analysed with the statistical software R version 3.0.1 (Ihaka and Gentleman, 1996). Figures were drawn using the user interface GrapheR (Hervé, 2013). The differences in the data were assessed using analysis of the variance (ANOVA) (function aov, package agricolae), followed by the two‐tailed Dunnett's post hoc test for median multiple comparisons. P values lower than 0.05 were considered significant.
Polyacrylamide gel electrophoresis analysis
Ten mature wheat grains per line were crushed into a fine powder and used to extract the endosperm storage proteins. Gliadins and glutenins were sequentially extracted and separated in A‐PAGE and SDS‐PAGE gels, respectively, as described in (Gil‐Humanes et al., 2012).
Reversed‐phase high‐performance liquid chromatography (RP‐HPLC)
Gliadins and glutenins were extracted and quantified by RP‐HPLC following the protocol reported by Piston et al. (2011). Three biological replications (one per block) and two technical repetitions per each block were carried out for each transgenic line and control.
Mass spectrometry analysis
Total protein was extracted from 1 g of flour with 10 ml of SDS buffer (0.5% SDS, 0.1 m sodium phosphate pH 6.9) shaking (120 r.p.m.) at 60 °C during 80 min. Sonication (Ultrasonic cleaner USLU‐5.7; Fungilab SA, Barcelona, Spain) was carried out at medium intensity during 1 min at 24 °C, and the supernatant was collected centrifuging at 16 000 g during 15 min. The extraction was performed twice using the pellet to finally obtain 30 mL of extract. Proteins were precipitated adding four volumes of cold acetone and kept at −20 °C during 30 min. After centrifuging at 16 000 g during 15 min, proteins were dissolved in 5 mL of 0.01 m acetic acid.
Pepsin digestion was carried out adjusting the pH to 1.8 with hydrochloric acid, adding pepsin (Sigma, St. Louis, MO) at a 1 : 100 ratio (w/w) and stirring during 4 h at 37 °C. The pepsin digestion was finished by bringing the pH to 7.8 with sodium hydroxide solution. A second digestion with trypsin [Sigma, 1 : 100 ratio (w/w)] was performed at the same incubation conditions. Trypsin was deactivated by heating at 85 °C for 45 min. The pH of the peptic‐tryptic (PT) digest was adjusted to 4.5 with hydrochloric acid, dialysed (1 kDa cut‐off) against 0.01 m ammonium bicarbonate and lyophilized.
The PT‐digest was cleaned using a SEP‐PAK C18 cartridge (Waters, Milford, MA), and 1.5 μg of total peptide was injected into Eksigent NanoLC‐1D Plus (AB SCIEX, Madrid, Spain, CA) coupled to TripleTOF® 5600 System (AB SCIEX) (LC‐MS/MS). The HPLC precolumn was Acclaim® PepMap 100, 100 μm × 2 cm (Thermo Fisher Scientific, Waltham, MA) and HPLC column NanoACQUITY UPLC® 1.7 μm BEH130 C18, 75 μm × 150 mm (Waters). All liquid chromatography–tandem mass spectrometry (LC‐MS/MS) data sets were searched using MASCOT version 2.4 (http://www.matrixscience.com/) against NCBI protein database of the species Triticum without any enzyme restriction, peptide error tolerance of 25 ppm and MS/MS fragment error tolerance of 0.05 Da. Only peptides with scores higher than 20 were extracted for further analyses.
CD epitope analysis
The peptides identified in LC‐MS/MS analysis were BlastP‐searched against CD epitopes described by Sollid and collaborators (Sollid et al., 2012) and the α‐gliadin peptide 31–43 [p31‐43; PGQQQPFPPQQPY (Maiuri et al., 1996) and LGQQQPFPPQQPY (Maiuri et al., 2003)], able to induce innate immune response, setting the parameters: ‐task blastp‐short, ‐ungapped, ‐seg no, ‐max_target_seqs 5 and allowing one mismatch. CD epitopes were searched in peptides longer than eight amino acids as described above.
Seed quality determinations
Kernel weight (g) was determined using 1000 seeds from each sample. Test weight (g/L) was calculated by weighing 100 mL of cleaned grains from each sample. Two measurements were carried out for each sample.
The protein content of whole flour was calculated from the Kjeldahl nitrogen content (%N × 5.7) according to the standard ICC method no. 105/2 (ICC, 1994), and the starch content was determined according to the standard ICC method no. 123/1 (ICC, 1994). Both parameters were expressed on a 14% moisture basis.
The nongluten proteins, expressed in percentage of dried weight (% DW), were calculated as follow: [Total protein in % – (Prolamin content in μg/mg*10)/(100 – moisture in %)]. The sodium dodecyl sulphate sedimentation (SDSS) volume was determined as described by (Williams et al., 1988). Three technical replicates were carried out for each biological sample.
Gluten content determination by competitive ELISA
Gluten proteins were extracted according to manufacturer's instructions using Universal Gluten Extraction Solution UGES (Biomedal SL, Seville, Spain). Maxisorp microtiter plates (Nunc, Roskilde, Denmark) were coated with Prolamin Working Group (PWG) gliadin solution and incubated overnight at 4 °C. The plates were washed with PBS‐Tween 20 buffer and blocked with blocking solution (phosphate‐buffered saline (PBS)‐5% nonfat dry milk) for 1 h at RT. Different dilutions of each sample as well as standard solution of PWG gliadin were made in PBS‐bovine serum albumin 3%, to each of which was added horseradish peroxidase–conjugated G12 moAb solution. The samples were pre‐incubated for 2 h at RT with gentle stirring, and then added to the wells. After 30 min of incubation at RT, the plates were washed, and 3,3′,5,5′‐tetramethylbenzidine (TMB) substrate solution (Sigma) was added. After 30 min of incubation at RT in the dark, the reaction was stopped with 1 m sulphuric acid, and the absorbance at 450 nm was measured (microplate reader UVM340; Asys Hitech GmbH, Eugendorf, Austria). Results were expressed in parts per million (ppm) in dry matter.
Supporting information
Figure S1 Plasmid combinations and patterns of silencing.
Figure S2 Fold change in kernel composition and agronomic traits with seven plasmid combinations.
Table S1 Sequences of the inverted repeat (IR) regions.
Table S2 Percentage of identity among all inverted repeat (IR) sequences.
Table S3 Transgenic lines used in this work.
Table S4 Protein fractions, and quality and agronomic parameters for each individual line.
Table S5 Number of CD immunogenic epitopes with one mismatch found in peptides identified by MS in seven plasmid combinations.
Acknowledgements
The Spanish Ministry of Economy and Competitiveness (Project AGL2013‐48946‐C3‐1‐R), the European Regional Development Fund (FEDER) and Junta de Andalucía (Project P11‐AGR‐7920) supported this work. The technical assistance of Ana García is also acknowledged.
References
- Abadie, V. , Sollid, L.M. and Barreiro, L.B. (2011) Integration of genetic and immunological insights into a model of celiac disease pathogenesis. Annu. Rev. Immunol. 29, 493–525. [DOI] [PubMed] [Google Scholar]
- Altenbach, S.B. and Allen, P.V. (2011) Transformation of the US bread wheat ‘Butte 86’ and silencing of omega‐5 gliadin genes. GM Crops, 2, 66–73. [DOI] [PubMed] [Google Scholar]
- Anderson, O.D. , Huo, N. and Gu, Y.Q. (2013) The gene space in wheat: the complete ɣ‐gliadin gene family from the wheat cultivar Chinese Spring. Funct. Integr. Genomics, 13, 261–273. [DOI] [PubMed] [Google Scholar]
- Arentz Hansen, H. , Mcadam, S.N. , Molberg, Ø. , Fleckenstein, B. , Lundin, K.E.A. , Jørgensen, T.J.D. , Jung, G. , Roepstorff, P. and Sollid, L.M. (2002) Celiac lesion T cells recognize epitopes that cluster in regions of gliadins rich in proline residues. Gastroenterology, 123, 803–809. [DOI] [PubMed] [Google Scholar]
- Becker, D. , Wieser, H. , Koehler, P. , Folck, A. , Mühling, K.H. and Zörb, C. (2012) Protein composition and techno‐functional properties of transgenic wheat with reduced α‐gliadin content obtained by RNA interference. J. Appl. Bot. Food Qual. 85, 23. [Google Scholar]
- Carter, B.P. , Morris, C.F. and Anderson, J.A. (1999) Optimizing the SDS sedimentation test for end‐use quality selection in a soft white and club wheat breeding program. Cereal Chem. 76, 907–911. [Google Scholar]
- Christensen, A.H. and Quail, P.H. (1996) Ubiquitin promoter‐based vectors for high‐level expression of selectable and/or screenable marker genes in monocotyledonous plants. Transgenic Res. 5, 213–218. [DOI] [PubMed] [Google Scholar]
- Comino, I. , Real, A. , de Lorenzo, L. , Cornell, H. , López‐Casado, A. , Barro, F. , Lorite, P. , Torres, M.I. , Cebolla, Á. and Sousa, C. (2011) Diversity in oat potential immunogenicity: basis for the selection of oat varieties with no toxicity in coeliac disease. Gut, 60, 915–922. [DOI] [PMC free article] [PubMed] [Google Scholar]
- Di Sabatino, A. and Corazza, G.R. (2009) Coeliac disease. Lancet, 373, 1480–1493. [DOI] [PubMed] [Google Scholar]
- Gil‐Humanes, J. , Piston, F. , Hernando, A. , Alvarez, J.B. , Shewry, P.R. and Barro, F. (2008) Silencing of γ‐gliadins by RNA interference (RNAi) in bread wheat. J. Cereal Sci. 48, 565–568. [Google Scholar]
- Gil‐Humanes, J. , Pistón, F. , Tollefsen, S. , Sollid, L.M. and Barro, F. (2010) Effective shutdown in the expression of celiac disease‐related wheat gliadin T‐cell epitopes by RNA interference. Proc. Natl Acad. Sci. USA, 107, 17023–17028. [DOI] [PMC free article] [PubMed] [Google Scholar]
- Gil‐Humanes, J. , Pistón, F. , Shewry, P.R. , Tosi, P. and Barro, F. (2011) Suppression of gliadins results in altered protein body morphology in wheat. J. Exp. Bot. 62, 4203–4213. [DOI] [PubMed] [Google Scholar]
- Gil‐Humanes, J. , Piston, F. , Giménez, M.J. , Martin, A. and Barro, F. (2012) The introgression of RNAi silencing of gamma‐gliadins into commercial lines of bread wheat changes the mixing and technological properties of the dough. PLoS ONE, 7, e45937. [DOI] [PMC free article] [PubMed] [Google Scholar]
- Gil‐Humanes, J. , Pistón, F. , Barro, F. and Rosell, C.M. (2014) The shutdown of celiac disease‐related gliadin epitopes in bread Wheat by RNAi provides flours with increased stability and better tolerance to over‐mixing. PLoS ONE, 9, e91931. [DOI] [PMC free article] [PubMed] [Google Scholar]
- ICC . (1994) Determination of crude protein in cereals and cereal products for food and for feed. International Association for Cereal Science and Technology. Method No. 105/2.
- ICC . (1994) Determination of starch content by hydrochloric acid dissolution. International Association for Cereal Science and Technology. Method No. 123/1.
- Hammond, S.M. , Bernstein, E. , Beach, D. and Hannon, G.J. (2000) An RNA‐directed nuclease mediates post‐transcriptional gene silencing in Drosophila cells. Nature, 404, 293–296. [DOI] [PubMed] [Google Scholar]
- Hervé, M. (2013) GrapheR: a multiplatform GUI for drawing customizable graphs in R. R J. 3, 45–53. [Google Scholar]
- Ihaka, R. and Gentleman, R. (1996) R: a language for data analysis and graphics. J. Comp. Graph. Stat. 5, 299–314. [Google Scholar]
- Jackson, A.L. and Linsley, P.S. (2004) Noise amidst the silence: off‐target effects of siRNAs? Trends Genet. 20, 521–524. [DOI] [PubMed] [Google Scholar]
- Jackson, A.L. , Burchard, J. , Leake, D. , Reynolds, A. , Schelter, J. , Guo, J. , Johnson, J.M. , Lim, L. , Karpilow, J. , Nichols, K. , Marshall, W. , Khvorova, A. and Linsley, P.S. (2006) Position‐specific chemical modification of siRNAs reduces ‘off‐target’ transcript silencing. RNA, 12, 1197–1205. [DOI] [PMC free article] [PubMed] [Google Scholar]
- León, E. , Marín, S. , Giménez, M.J. , Piston, F. , Rodríguez‐Quijano, M. , Shewry, P.R. and Barro, F. (2009) Mixing properties and dough functionality of transgenic lines of a commercial wheat cultivar expressing the 1Ax1, 1Dx5 and 1Dy10 HMW glutenin subunit genes. J. Cereal Sci. 49, 148–156. [Google Scholar]
- Maiuri, L. , Picarelli, A. , Boirivant, M. , Coletta, S. , Mazzilli, M.C. , De Vincenzi, M. , Londei, M. and Auricchio, S. (1996) Definition of the initial immunologic modifications upon in vitro gliadin challenge in the small intestine of celiac patients. Gastroenterology, 110, 1368–1378. [DOI] [PubMed] [Google Scholar]
- Maiuri, L. , Ciacci, C. , Ricciardelli, I. , Vacca, L. , Raia, V. , Auricchio, S. , Picard, J. , Osman, M. , Quaratino, S. and Londei, M. (2003) Association between innate response to gliadin and activation of pathogenic T cells in coeliac disease. Lancet, 362, 30–37. [DOI] [PubMed] [Google Scholar]
- Morón, B. , Bethune, M.T. , Comino, I. , Manyani, H. , Ferragud, M. , López, M.C. , Cebolla, Á. , Khosla, C. and Sousa, C. (2008a) Toward the assessment of food toxicity for celiac patients: characterization of monoclonal antibodies to a main immunogenic gluten peptide. PLoS ONE, 3, e2294. [DOI] [PMC free article] [PubMed] [Google Scholar]
- Morón, B. , Cebolla, Á. , Manyani, H. , Álvarez‐Maqueda, M. , Megías, M. , Thomas, M.C. , López, M.C. and Sousa, C. (2008b) Sensitive detection of cereal fractions that are toxic to celiac disease patients by using monoclonal antibodies to a main immunogenic wheat peptide. Am. J. Clin. Nutr. 87, 405–414. [DOI] [PubMed] [Google Scholar]
- Mustalahti, K. , Catassi, C. , Reunanen, A. , Fabiani, E. , Heier, M. , McMillan, S. , Murray, L. , Metzger, M.H. , Gasparin, M. , Bravi, E. and Mäki, M. (2010) The prevalence of celiac disease in Europe: results of a centralized, international mass screening project. Ann. Med. 42, 587–595. [DOI] [PubMed] [Google Scholar]
- Piston, F. , León, E. , Lazzeri, P.A. and Barro, F. (2008) Isolation of two storage protein promoters from Hordeum chilense and characterization of their expression patterns in transgenic wheat. Euphytica, 162, 371–379. [Google Scholar]
- Piston, F. , Gil‐Humanes, J. , Rodríguez‐Quijano, M. and Barro, F. (2011) Down‐regulating γ‐gliadins in bread wheat leads to non‐specific increases in other gluten proteins and has no major effect on dough gluten strength. PLoS ONE, 6, e24754. [DOI] [PMC free article] [PubMed] [Google Scholar]
- Piston, F. , Gil‐Humanes, J. and Barro, F. (2013) Integration of promoters, inverted repeat sequences and proteomic data into a model for high silencing efficiency of coeliac disease related gliadins in bread wheat. BMC Plant Biol. 13, 136. [DOI] [PMC free article] [PubMed] [Google Scholar]
- Qi, P.F. , Wei, Y.M. , Yue, Y.W. , Yan, Z.H. and Zheng, Y.L. (2006) Biochemical and molecular characterization of gliadins. Mol. Biol. 40, 796–807. [PubMed] [Google Scholar]
- Rosell, C.M. , Barro, F. , Sousa, C. and Mena, M.C. (2014) Cereals for developing gluten‐free products and analytical tools for gluten detection. J. Cereal Sci. 59, 354–364. [Google Scholar]
- Salentijn, E.M. , Mitea, D.C. , Goryunova, S.V. , van der Meer, I.M. , Padioleau, I. , Gilissen, L.J.W.J. , Koning, F. and Smulders, M.J.M. (2012) Celiac disease T‐cell epitopes from gamma‐gliadins: immunoreactivity depends on the genome of origin, transcript frequency, and flanking protein variation. BMC Genom. 13, 277. [DOI] [PMC free article] [PubMed] [Google Scholar]
- Sapone, A. , Lammers, K.M. , Casolaro, V. , Cammarota, M. , Giuliano, M.T. , De Rosa, M. , Stefanile, R. , Mazzarella, G. , Tolone, C. and Russo, M.I. (2011) Divergence of gut permeability and mucosal immune gene expression in two gluten‐associated conditions: celiac disease and gluten sensitivity. BMC Med. 9, 23. [DOI] [PMC free article] [PubMed] [Google Scholar]
- Senthil‐Kumar, M. , Hema, R. , Anand, A. , Kang, L. , Udayakumar, M. and Mysore, K.S. (2007) A systematic study to determine the extent of gene silencing in Nicotiana benthamiana and other Solanaceae species when heterologous gene sequences are used for virus‐induced gene silencing. New Phytol. 176, 782–791. [DOI] [PubMed] [Google Scholar]
- Shan, L. , Molberg, Ø. , Parrot, I. , Hausch, F. , Filiz, F. , Gray, G.M. , Sollid, L.M. and Khosla, C. (2002) Structural basis for gluten intolerance in celiac sprue. Science, 297, 2275–2279. [DOI] [PubMed] [Google Scholar]
- Sollid, L.M. , Qiao, S.‐W. , Anderson, R.P. , Gianfrani, C. and Koning, F. (2012) Nomenclature and listing of celiac disease relevant gluten T‐cell epitopes restricted by HLA‐DQ molecules. Immunogenetics, 64, 455–460. [DOI] [PMC free article] [PubMed] [Google Scholar]
- Tye‐Din, J.A. , Stewart, J.A. , Dromey, J.A. , Beissbarth, T. , van Heel, D.A. , Tatham, A. , Henderson, K. , Mannering, S.I. , Gianfrani, C. , Jewell, D.P. , Hill, A.V. , McCluskey, J. , Rossjohn, J. and Anderson, R.P. (2010) Comprehensive, quantitative mapping of T cell epitopes in gluten in celiac disease. Sci. Transl. Med. 2, 41ra51. [DOI] [PubMed] [Google Scholar]
- Vader, W. , Kooy, Y. , van Veelen, P. , de Ru, A. , Harris, D. , Benckhuijsen, W. , Peña, S. , Mearin, L. , Drijfhout, J.W. and Koning, F. (2002) The gluten response in children with celiac disease is directed toward multiple gliadin and glutenin peptides. Gastroenterology, 122, 1729–1737. [DOI] [PubMed] [Google Scholar]
- Wieser, H. and Koehler, P. (2009) Is the calculation of the gluten content by multiplying the prolamin content by a factor of 2 valid? Eur. Food Res. Technol. 229, 9–13. [Google Scholar]
- Williams, P. , Jaby el‐Haramein, F. , Nakkoul, H. and Rihawi, S. (1988) Crop Quality Evaluation Methods and guidelines, Cereals ‐ Food legumes ‐ Forages. Technical Manuel No 14, ICARDA, Aleppo, Syria. Second edition May, 1988. p. 145. [Google Scholar]
- Xu, P. , Zhang, Y. , Kang, L. , Roossinck, M.J. and Mysore, K.S. (2006) Computational estimation and experimental verification of off‐target silencing during posttranscriptional gene silencing in plants. Plant Physiol. 142, 429–440. [DOI] [PMC free article] [PubMed] [Google Scholar]
Associated Data
This section collects any data citations, data availability statements, or supplementary materials included in this article.
Supplementary Materials
Figure S1 Plasmid combinations and patterns of silencing.
Figure S2 Fold change in kernel composition and agronomic traits with seven plasmid combinations.
Table S1 Sequences of the inverted repeat (IR) regions.
Table S2 Percentage of identity among all inverted repeat (IR) sequences.
Table S3 Transgenic lines used in this work.
Table S4 Protein fractions, and quality and agronomic parameters for each individual line.
Table S5 Number of CD immunogenic epitopes with one mismatch found in peptides identified by MS in seven plasmid combinations.