

Summary
As an increasing number of genome sequences become available for a wide range of species, there is a growing understanding that the genome of a single individual is insufficient to represent the gene diversity within a whole species. Many studies examine the sequence diversity within genes, and this allelic variation is an important source of phenotypic variation which can be selected for by man or nature. However, the significant gene presence/absence variation that has been observed within species and the impact of this variation on traits is only now being studied in detail. The sum of the genes for a species is termed the pangenome, and the determination and characterization of the pangenome is a requirement to understand variation within a species. In this review, we explore the current progress in pangenomics as well as methods and approaches for the characterization of pangenomes for a wide range of plant species.
Keywords: pangenome, gene diversity, presence absence variation, copy number variation, PAV, CNV
Introduction
Since the sequencing of the first plant genome (Initiative, 2000), comparative genomic studies of plants often focus on single nucleotide polymorphisms (SNPs) between individuals as these can be relatively easily identified and assayed across populations (Gore et al., 2009; Lai et al., 2015; McNally et al., 2009). However, there has been an increasing awareness that a single reference genome is insufficient to capture the genomic diversity we observe in nature due to a considerable amount of structural variation including copy number variants (CNVs) and presence/absence variants (PAVs), which alter the total amount of genomic sequence found in individuals (Saxena et al., 2014). CNVs are sequences which are present in a different number of copies between individuals and encompass duplications, insertions and deletions (Saxena et al., 2014; Scherer et al., 2007). PAVs are sequences that are present in one genome and absent in another and can therefore be considered to be extreme form CNVs, where the sequence is completely missing from one or more individuals (Saxena et al., 2014). The existence of CNVs and PAVs, even between individuals belonging to the same species, has been extensively documented in plants (Bush et al., 2013; Cao et al., 2011; Ding et al., 2007; Gan et al., 2011; Gonzalez et al., 2013; Gore et al., 2009; Han and Xue, 2003; Hirsch et al., 2014; Lai et al., 2010; Lam et al., 2010; Li et al., 2014; Lin et al., 2014; McHale et al., 2012; Morgante et al., 2005; Ossowski et al., 2008; Schatz et al., 2014; Springer et al., 2009; Swanson‐Wagner et al., 2010; Tan et al., 2012; Zhang et al., 2014). To capture the entire genomic sequence present within the species, including the complete gene set, the pangenome needs to be sequenced.
The concept of the pangenome was introduced by Tettelin et al. (2005) who described the production of the first ever pangenome, for a bacterial species Streptococcus agalactiae. Since then, the concept of the pangenome has become increasingly popular with numerous examples available for bacteria (Baddam et al., 2014; Donati et al., 2010; Liu et al., 2014; Zhou et al., 2014) and other micro‐organisms (Read et al., 2013). Recently, pangenomic studies of higher organisms have emerged including in maize (Hirsch et al., 2014), soybean (Li et al., 2014), Brassica rapa (Lin et al., 2014) and rice (Schatz et al., 2014).
Pangenome genes can be divided into two groups: the core genes, which are present in all of the individuals, and the variable genes, also known as accessory (Segerman, 2012) or dispensable (Li et al., 2014; Vernikos et al., 2015) genes which are present in some, but not all, individuals. The variable gene set can further be subdivided into genes present in two or more individuals and unique genes – present in one individual only. The core and variable genes could be interpreted to represent the essence and the diversity of the species, respectively (Medini et al., 2005). The pangenome can be open or closed (restricted). In the first instance, there appears to be no finite number of genes in the species, and with each new added individual, new genes are incorporated into the pangenome. In the second instance, the gene pool is limited. After a certain number of individuals have been analysed, the addition of new individuals to the analysis will not result in an expansion of the pangenome.
Pangenome analysis
The analysis of pangenomes can answer three important questions which may help characterize the species: (i) What is the size of the core genome, in other words how many genes/gene families are present in all the individuals? (ii) What is the size of the pangenome; how many genes/gene families are present within the species? (iii) With the addition of each new individual, how many genes/gene families will be added to the pangenome? The analysis of the core genome size, the pangenome size and the number of new genes added can be conducted on two levels: individual genes and whole gene families. The summary of the functions used for pangenome modelling which help address those questions is presented in Table 1.
Table 1.
Models used for pangenome analysis. For α > 1 (γ < 0), the size of the pangenome approaches a constant as more genomes are sampled, that is, the pangenome is closed. Conversely, for α < 1 (0 < γ < 1), the size of the pangenome is an increasing and unbounded function of the number of genomes considered
| Core genome size | Pangenome size | New genes | Comments | |||
|---|---|---|---|---|---|---|
| Tettelin et al. (2005) |
|
Calculated based on parameters for new genes curve |
|
|||
| Tettelin et al. (2008) |
n = κN γ The exponent γ > 0 indicates an open pangenome species |
n = κN −α The exponent α determines whether the pangenome is open (α < 1) or closed (α > 1) |
There is a relationship between α and γ: α = 1−γ |
Factors which influence pangenome analysis include the following:
(1) Assembly quality – assembly quality is a very important factor in pangenome analysis studies. The quality of the assembly, its total size, completeness and fragmentation level often translate to the quality of the annotation. There are several metrics used to measure assembly quality, including but not limited to the total assembly length, N50 and the number of core eukaryotic genes present, as measured using CEGMA (Core Eukaryotic Genes Mapping Approach) (Parra et al., 2007).
(2) Annotation quality – accurate annotation, especially of large eukaryotic genomes, is a challenging task. The two main techniques are ab initio gene prediction and evidence‐based gene prediction. Ab initio gene discovery relies on genomic DNA sequence alone which is systematically searched for intrinsic patterns of protein‐coding genes. In contrast, evidence‐based gene prediction relies on the accurate alignment of existing expression evidence, such as expressed sequence tags (ESTs), RNA sequence data and protein sequences, to the reference sequence. Currently, there are annotation pipelines which combine ab initio and evidence‐based gene prediction to produce the most reliable gene models. A widely used annotation pipeline which performs this task is MAKER (Cantarel et al., 2008; Holt and Yandell, 2011).
(3) Orthologous gene detection – classically, orthologous gene detection aims to identify functionally equivalent genes across individuals of different species. In pangenome studies, orthologous gene detection is employed to find functionally equivalent genes across individuals of the same species, which allows identification of core and variable gene families (Li et al., 2014). Several methods of orthologous gene detection are used, most of them BLAST‐based. Those include OrthoMCL (Li et al., 2003), INPARANOID (Berglund et al., 2008) and reciprocal best blast hit. The most successful methods achieve an acceptable balance between false positives (genes which are not orthologous but classified as so) and false negatives (true orthologue relationships not detected) (Chen et al., 2007). In the BLAST‐based methods, a number of parameters can be varied including: e‐value cut‐off, per cent identity cut‐off and minimum alignment length.
- (4) Selection of appropriate samples – the selection of appropriate individuals which capture the majority of diversity within a species is crucial to successful pangenome study design. The selection of a small number of closely related individuals will result in significant underestimation of the pangenome size. On the other hand, the selection of diverse individuals gives more realistic estimates (Figure 1).
Figure 1.
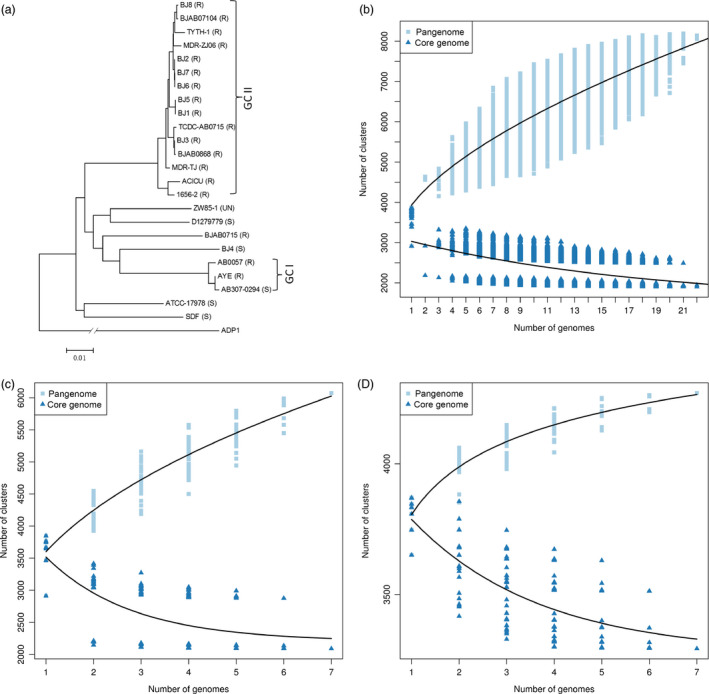 The effect of inappropriate sample choice on pangenome prediction. Relationships between all individuals (a). Pangenome estimation based on all individuals (b). Pangenome estimation based on a sample of seven diverse individuals (BJ3, BJ4, BJ8, ACICU, BJAB0715, SDF,ZW85_1). The shape of the pangenome curve is similar to the one based on all the individuals, suggesting an open pangenome. The size of core genome is similar to the core genome based on all the individuals (c). Pangenome estimation based on a sample of seven closely related individuals (BJ1, BJ2, BJ3, BJ5, BJ6, BJ7, BJ8). The shape of the pangenome curve is different than in b and c, suggesting a closed pangenome. The size of core genome is larger than in b and c (d). Panel a adapted and the data used from (Liu et al., 2014)
The majority of pangenome analysis tools have been developed for prokaryotes; however, they provide a good guide for the potential analysis which could be performed (Table 2). There are now several strategies for eukaryote pangenome assembly, including comparative de novo approach, iterative assembly and k‐mer‐based methods (Figure 2).
Table 2.
Summary of available pangenome analysis tools
| Tool | Publication | Description |
|---|---|---|
| PGAP | (Zhao et al., 2012) | Performs five analytical functions: cluster analysis of functional genes, pangenome profile analysis, genetic variation analysis of functional genes, species evolution analysis and function enrichment of gene clusters |
| PanGP | (Zhao et al., 2014) | Requires orthologous gene clusters computed by programs such as OrthoMCL or PGAP and performs scalable pangenome analysis producing core genome, pangenome and new genes curves. It also implements two subsampling algorithms, which alleviate the computational burden of analysis of very high number of samples. It also has a user‐friendly graphical user interface |
| Micropan | (Snipen and Liland, 2015) | Package which offers a set of tools designed for pangenome analysis written in R programming language. R is a language of choice for a range of bioinformatics analyses and Micropan allows integration of pangenome and additional analyses within a single programming language environment |
| GET_HOMOLOGUES | (Contreras‐Moreira and Vinuesa, 2013) | Performs customizable genome analysis and is targeted for non‐bioinformaticians. It enables clustering of orthologous genes using multiple algorithms and filtering parameters. Auxiliary scripts allow for interrogation and visualization of the core genome and pangenome sets. Theoretical core gene and pangenome size curves can also be generated |
| PanSeq | (Laing et al., 2010) | An online tool for analysis of core and accessory genomic regions. As a web server, it is platform independent and makes use of NCBI resources. It has three main modules Novel Region Finder (NRF), Core and Accessory Genome Finder (CAGF) and Loci Selector (LS) |
| SplitMem | (Marcus et al., 2014) | Generates compressed coloured de Bruijn graph of the pangenome. In the graph, nodes represent sequences which are common or unique within the population, and edges are the branch points between common or sample specific sequences |
| ITEP | (Benedict et al., 2014) | Generates and curates protein families. It can curate protein families, compute similarities to externally defined domains, analyse gene gain and loss and generate draft metabolic networks |
Figure 2.
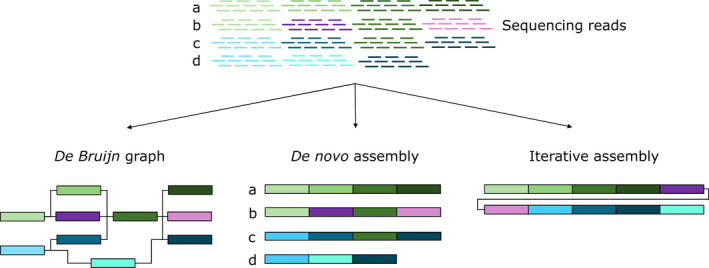
Different approaches to pangenome assembly. a, b, c, d are four genomes, which together constitute a pangenome. Each genome is composed of several genomic segments, which are represented in different colours; corresponding segments in different genomes are marked by same colour. Sequencing reads are assembled to reconstruct original sequence of four genomes. In the first approach, the pangenome sequence is stored as coloured de Bruijn graph. The genomes are decomposed into segments and the relationships between segments can be traced by following edges of the graph. In the second approach, the four genomes are individually assembled and can be compared to in order to identify the pangenome. In the third approach, the pangenome is produced by iterative mapping and assembly. A single genome is used a starting reference and reads from other genomes are sequentially mapped and assembled, creating a non‐redundant pangenome.
In the case of high coverage samples, de novo genome assemblies can be produced and compared. A range of de novo genome assembly tools are available including Velvet (Zerbino and Birney, 2008), SOAPdenovo (Li et al., 2010), ALLPATHS (Butler et al., 2008) and MaSuRCA (Zimin et al., 2013). Assembled genomes can be compared using whole‐genome alignment, to identify regions which are shared or variable (Li et al., 2014; Schatz et al., 2014). Additionally, annotation of the genomes allows the identification of orthologous gene clusters and the identification of core and variable gene families (Li et al., 2014).
In an alternative, iterative assembly approach, a single whole‐genome assembly is used as a starting reference. The reads from other samples are sequentially mapped to the reference, and the unmapped reads extracted and assembled. The reference is updated with the newly assembled sequence, and then, further samples are mapped to this new reference. The iterative assembly and updating of the reference sequence between the mappings produces a non‐redundant pangenome. For example, if a genomic segment exists in two samples, it will be assembled and integrated from the first sample. This approach does not require multiple whole‐genome de novo assemblies, which reduces the computation time and memory usage.
Finally, it is possible to take a k‐mer‐based approach to pangenome assembly. In a de Bruijn graph, each sequence is decomposed to a number of substrings of length k, termed k‐mers. The relationship between k‐mers can be represented as a graph where each k‐mer is a node and nodes which overlap by k−1 characters are connected by an edge. The graph can include multiple edges connecting the same nodes and can form loops. A genome can be reconstructed from k‐mers following relationships between the nodes. When multiple genomes are considered, additional information about the origin of the node has to be stored. This is achieved by colouring the nodes, where nodes originating from different samples are assigned unique colours and can therefore easily be traced. This way an entire pangenome can be represented as a coloured de Bruijn graph, allowing for identification of sequences which are common between the genomes or unique to one individual (Iqbal et al., 2012; Marcus et al., 2014).
Several tools for genome visualization have been developed over recent years, including GBrowse (Donlin, 2007) and EnsEMBL (Stalker et al., 2004); however, there are few tools dedicated to pangenome visualization. One of the packages designed specifically for this is FriPan (http://drpowell.github.io/FriPan). FriPan is designed for exploration of bacterial pangenomes and allows visualization of orthologous genes/gene clusters presence and absence for multiple strains. It produces dendrograms and multidimensional scaling plots. It can show additional information for a selected gene and the strain of interest can be highlighted on multiple plots at the same time. Additionally, some of the pangenome analysis tools presented in Table 2 have auxiliary scripts aiding pangenome visualization.
One challenge is to accurately describe the complex and sometimes uncertain relationships between the gene content of related individuals. In some cases, genes demonstrate true presence/absence variation, while for others, the variation is due to sequence variation without the insertion or deletion of sequence data. These scenarios may be visualized as variations in linear‐ or graph‐based formats; however, detailed visualization tools for the presentation of such annotated information are still in their infancy and more flexible genome viewers need to be developed to present this complex information in a user‐friendly manner.
Pangenomic studies in plants
The knowledge of plant pangenomes is built upon numerous studies of structural variants, especially CNVs and PAVs. In one of the early studies of Arabidopsis thaliana structural variants, comparison of two divergent ecotypes relative to the reference genome found 3.4 Mb of sequence to be extremely dissimilar, deleted or duplicated (Ossowski et al., 2008). Subsequently, sequencing of eighteen A. thaliana genomes revealed that between 2.1 and 3.7 Mb of sequence present in the reference was missing in these accessions. In each accession, there were on average 319 novel genes or gene fragments (Gan et al., 2011). An even broader survey of 80 accessions suggested that relative to the reference sequence, 10% of the genes were absent in one or more accessions, averaging 444 genes per accession (Tan et al., 2012). In another survey of 80 accessions, over 4200 genes had premature stop codons, suggesting a large number of genes with altered functions (Cao et al., 2011). Overall, genes displaying presence/absence variation were found to be shorter, have fewer paralogues and were younger in age than conserved core genes (Bush et al., 2013).
A resequencing project of 17 wild and 14 cultivated soybean genomes revealed that 10% of reference genome genes had SNPs likely to have large functional impact (Lam et al., 2010). Additionally, comparison of assembled sequence between the wild soybean genome and the reference genome revealed a total of 4444 and 1148 large PAVs (>500 bp) that were absent in the reference and the wild soybean genomes, respectively (Lam et al., 2010). Another study found that CNVs in four diverse soybean genotypes overlapped almost 700 genes, and PAV calls overlapped 133 genes (McHale et al., 2012). A de novo assembly of seven diverse accessions of wild relative of cultivated soybean found that 80% of the pangenome was present in all accessions, and the rest was variable and displayed greater sequence variation than the core genome (Li et al., 2014).
Comparison of a 2.3 Mb homologous region on rice chromosome four revealed that two rice accessions Oryza sativa ssp japonica and ssp indica differed by 27 genes in this region, with gene density higher in japonica (Han and Xue, 2003). Another study comparing ssp japonica and indica found 641 CNVs between the genomes. The CNVs varied in size from 1.1 Kb to 180.7 Kb and encompassed approximately 7.6 Mb of sequence (Yu et al., 2011). Comparison of two rice accessions estimated that at least 10% of the genes in the genomes were either under presence/absence polymorphism (5.2%) or asymmetrically located between genomes (4.7%) (Ding et al., 2007). A pangenome study of three divergent rice varieties found that 92% of the genes were core and the remaining variable. The variable genes being shorter, with fewer exons per gene (Schatz et al., 2014).
Early studies in maize suggested that 20% of genomic segments are not shared between the two maize lines B73 and Mo17 (Morgante et al., 2005). Another comparison of these lines uncovered ~3800 CNV or PAV sequences between these two maize genomes (Springer et al., 2009). Hundreds of intact, expressed genes that were present in the B73 genome were absent from the Mo17 genome (Springer et al., 2009). When six inbred lines were compared to the B73 reference, it was discovered that 296 genes present in B73 were missing from at least one of the six inbred lines. Additionally, 570 genes were found to be absent from B73 (Lai et al., 2010). A survey of 27 lines revealed that the reference genome B73 may only capture ~70% low copy fraction of the entire pangenome (Gore et al., 2009), while a study of 503 diverse maize inbred lines identified 8681 representative transcript assemblies which were not present in the reference B73 (Hirsch et al., 2014).
The pangenome and agronomic traits
In humans, associations between CNVs, PAVs and health and disease have been found (Conrad et al., 2010; Henrichsen et al., 2009; Zhang et al., 2009). In plants, much less is known about the association of CNVs and PAVs with phenotype; however, several examples are available. Known biological processes influenced by CNVs/PAVs are metabolite production, flowering time, submergence tolerance, phosphorus uptake and biotic stress response (Bakker et al., 2006; Cook et al., 2012; Díaz et al., 2012; Gonzalez et al., 2013; McHale et al., 2012; Schatz et al., 2014; Shen et al., 2006; Winzer et al., 2012; Xu et al., 2012). Opium poppy contains a 10 gene cluster which displays PAV, being only present in plants producing noscapine an antitumor alkaloid (Winzer et al., 2012). Investigation of wheat genes that regulate flowering by altering photoperiod response (Ppd‐B1 alleles) or vernalization requirement (Vrn‐A1 alleles) revealed that both of those genes display CNV. Alleles with an increased copy number of Ppd‐B1 confer an early flowering day neutral phenotype, while plants with an increased copy number of Vrn‐A1 have an increased requirement for vernalization so that longer periods of cold are required to potentiate flowering (Díaz et al., 2012).
In rice, the Sub1A gene is involved in submergence tolerance and is absent in varieties which are not submergence tolerant (Schatz et al., 2014). Also in rice, a gene encoding a protein kinase Pstol1 is responsible for a P‐uptake efficiency phenotype, and the gene is absent in phosphorus starvation‐intolerant varieties (Schatz et al., 2014). In addition, biotic stress response genes demonstrate presence/absence variation in a range of species (Bakker et al., 2006; Cook et al., 2012; Gonzalez et al., 2013; McHale et al., 2012; Shen et al., 2006; Xu et al., 2012).
It was postulated that many CNVs/PAVs affecting genes in plants may not have a large phenotypic effect because genes affected by CNVs/PAVs are parts of large multigene families, where at least partial redundancy of function is expected between members (Swanson‐Wagner et al., 2010). On the other hand, it was shown that the frequency of large gene family members with CNV is near the frequency that would be expected at random (McHale et al., 2012), so CNV genes are not necessarily members of large gene families.
Partial redundancy of function between gene family members together with high CNVs/PAVs which affect different lines may contribute to heterosis (Swanson‐Wagner et al., 2010). Considering genes influenced by CNVs/PAVs which belong to gene families, each gene can be seen as a ‘functional block’ contributing partial to complete functionality for the family. The loss of a single member of a gene family may result in a relatively minor effect on phenotype as other family members provide compensatory function. However, the cumulative effect of many gene families lacking members could result in decreased vigour (Swanson‐Wagner et al., 2010). This effect could be alleviated in hybrids, resulting in substantial hybrid vigour (Swanson‐Wagner et al., 2010). On the other hand, it is also possible that unique genes displaying PAV are contributing to heterosis on a single gene rather than gene family level. Considering this, abundance of CNVs/PAVs in the entire population used for breeding may limit potential for improvement (Swanson‐Wagner et al., 2010).
Future directions
One of the main challenges for pangenomic studies is the availability of complete, well‐annotated genome sequences. Whole‐genome alignments of fragmented genomes are very difficult. Structural variants such as inversions and trans‐locations can be missed. The main limitation in delivery of near‐complete, contiguous genome sequences is the short length of sequencing reads which renders assembly of repetitive regions difficult or impossible, resulting in large repetitive genomes being highly fragmented. New technologies including single molecule sequencing, promise reads hundreds of times longer; however, to date, the reads suffer from low accuracy (Clarke et al., 2009; Eid et al., 2009; Koren and Phillippy, 2015; Quick et al., 2014). The development of new algorithms which enable assembly of long reads promises delivery of high‐quality genomes (Berlin et al., 2015), which will fuel further pangenomic studies. The development of more accurate genome annotation tools is underway combining ab initio and evidence‐based gene predictions (Cantarel et al., 2008; Holt and Yandell, 2011), which results in higher quality annotations. Development of new pangenome analysis tools which are tailored for analysis of organisms with tens of thousands of genes is also necessary. These should enable fast and accurate detection of orthologous genes from closely related organisms, pangenome profiling, phylogenetic analysis and dynamic visualization which will enable pangenome exploration. Successful integration of functional and phenotypic information is crucial to pangenomic studies. Only accurate functional information will produce a link between the pangenome and the trait diversity observed. The development of tools which allow quality functional annotation for non‐model species will allow the science community to take full advantage of growing number of pangenomic studies.
Storage and presentation of the results of pangenomic studies is also a challenge. Databases need to be able to incorporate a range of information related to the pangenome including SNPs (single nucleotide polymorphisms), indels, noncoding RNAs and transposable elements. The integration of genomic and gene expression data will also be necessary, linking the core genome, variable genome and the expression levels. One of the challenges regarding storage and presentation of variants is developing an appropriate coordinate system. For example, a SuperGenome has been proposed which is a representation of a multiple sequence alignment with an additional common coordinate system (Herbig et al., 2012). Further development of databases for pangenomes will provide easier access to data.
The analysis of the pangenome rather than a single reference avoids single sample bias and ensures that the genomic diversity within a species is fully represented, so future studies are likely to focus on pangenomes rather than single genome studies.
References
- Baddam, R. , Kumar, N. , Shaik, S. , Lankapalli, A.K. and Ahmed, N. (2014) Genome dynamics and evolution of Salmonella Typhi strains from the typhoid‐endemic zones. Sci. Rep. 4, doi: 10.1038/srep07457. [DOI] [PMC free article] [PubMed] [Google Scholar]
- Bakker, E.G. , Toomajian, C. , Kreitman, M. and Bergelson, J. (2006) A genome‐wide survey of R gene polymorphisms in Arabidopsis . Plant Cell, 18, 1803–1818. [DOI] [PMC free article] [PubMed] [Google Scholar]
- Benedict, M. , Henriksen, J. , Metcalf, W. , Whitaker, R. and Price, N. (2014) ITEP: an integrated toolkit for exploration of microbial pan‐genomes. BMC Genom. 15, 8. [DOI] [PMC free article] [PubMed] [Google Scholar]
- Berglund, A.C. , Sjolund, E. , Ostlund, G. and Sonnhammer, E.L. (2008) InParanoid 6: eukaryotic ortholog clusters with inparalogs. Nucleic Acids Res. 36, D263–D266. [DOI] [PMC free article] [PubMed] [Google Scholar]
- Berlin, K. , Koren, S. , Chin, C.‐S. , Drake, J.P. , Landolin, J.M. and Phillippy, A.M. (2015) Assembling large genomes with single‐molecule sequencing and locality‐sensitive hashing. Nat. Biotech. 33, 623–630. [DOI] [PubMed] [Google Scholar]
- Bush, S.J. , Castillo‐Morales, A. , Tovar‐Corona, J.M. , Chen, L. , Kover, P.X. and Urrutia, A.O. (2013) Presence/absence variation in A. thaliana is primarily associated with genomic signatures consistent with relaxed selective constraints. Mol. Biol. Evol. 31, 59–69. [DOI] [PMC free article] [PubMed] [Google Scholar]
- Butler, J. , MacCallum, I. , Kleber, M. , Shlyakhter, I.A. , Belmonte, M.K. , Lander, E.S. , Nusbaum, C. et al. (2008) ALLPATHS: de novo assembly of whole‐genome shotgun microreads. Genome Res. 18, 810–820. [DOI] [PMC free article] [PubMed] [Google Scholar]
- Cantarel, B.L. , Korf, I. , Robb, S.M. , Parra, G. , Ross, E. , Moore, B. , Holt, C. et al. (2008) MAKER: an easy‐to‐use annotation pipeline designed for emerging model organism genomes. Genome Res. 18, 188–196. [DOI] [PMC free article] [PubMed] [Google Scholar]
- Cao, J. , Schneeberger, K. , Ossowski, S. , Gunther, T. , Bender, S. , Fitz, J. , Koenig, D. et al. (2011) Whole‐genome sequencing of multiple Arabidopsis thaliana populations. Nat. Genet. 43, 956–963. [DOI] [PubMed] [Google Scholar]
- Chen, F. , Mackey, A.J. , Vermunt, J.K. and Roos, D.S. (2007) Assessing performance of orthology detection strategies applied to eukaryotic genomes. PLoS ONE, 2, e383. [DOI] [PMC free article] [PubMed] [Google Scholar]
- Clarke, J. , Wu, H.‐C. , Jayasinghe, L. , Patel, A. , Reid, S. and Bayley, H. (2009) Continuous base identification for single‐molecule nanopore DNA sequencing. Nat. Nano. 4, 265–270. [DOI] [PubMed] [Google Scholar]
- Conrad, D.F. , Pinto, D. , Redon, R. , Feuk, L. , Gokcumen, O. , Zhang, Y. , Aerts, J. et al. (2010) Origins and functional impact of copy number variation in the human genome. Nature, 464, 704–712. [DOI] [PMC free article] [PubMed] [Google Scholar]
- Contreras‐Moreira, B. and Vinuesa, P. (2013) GET_HOMOLOGUES, a versatile software package for scalable and robust microbial pangenome analysis. Appl. Environ. Microbiol. 79, 7696–7701. [DOI] [PMC free article] [PubMed] [Google Scholar]
- Cook, D.E. , Lee, T.G. , Guo, X. , Melito, S. , Wang, K. , Bayless, A.M. , Wang, J. et al. (2012) Copy number variation of multiple genes at Rhg1 mediates nematode resistance in soybean. Science, 338, 1206–1209. [DOI] [PubMed] [Google Scholar]
- Díaz, A. , Zikhali, M. , Turner, A.S. , Isaac, P. and Laurie, D.A. (2012) Copy number variation affecting the photoperiod‐B1 and vernalization‐A1 genes is associated with altered flowering time in wheat (Triticum aestivum). PLoS ONE, 7, e33234. [DOI] [PMC free article] [PubMed] [Google Scholar]
- Ding, J. , Araki, H. , Wang, Q. , Zhang, P. , Yang, S. , Chen, J.Q. and Tian, D. (2007) Highly asymmetric rice genomes. BMC Genom. 8, 154. [DOI] [PMC free article] [PubMed] [Google Scholar]
- Donati, C. , Hiller, N.L. , Tettelin, H. , Muzzi, A. , Croucher, N. , Angiuoli, S. , Oggioni, M. et al. (2010) Structure and dynamics of the pan‐genome of Streptococcus pneumoniae and closely related species. Genome Biol. 11, R107. [DOI] [PMC free article] [PubMed] [Google Scholar]
- Donlin, M.J. (2007) Using the generic genome browser (GBrowse). Curr. Protoc. Bioinform. Chapter 9, doi: 10.1002/0471250953.bi0909s17. [DOI] [PubMed] [Google Scholar]
- Eid, J. , Fehr, A. , Gray, J. , Luong, K. , Lyle, J. , Otto, G. , Peluso, P. et al. (2009) Real‐time DNA sequencing from single polymerase molecules. Science, 323, 133–138. [DOI] [PubMed] [Google Scholar]
- Gan, X. , Stegle, O. , Behr, J. , Steffen, J.G. , Drewe, P. , Hildebrand, K.L. , Lyngsoe, R. et al. (2011) Multiple reference genomes and transcriptomes for Arabidopsis thaliana . Nature, 477, 419–423. [DOI] [PMC free article] [PubMed] [Google Scholar]
- Gonzalez, V. , Aventin, N. , Centeno, E. and Puigdomenech, P. (2013) High presence/absence gene variability in defense‐related gene clusters of Cucumis melo . BMC Genom. 14, 782. [DOI] [PMC free article] [PubMed] [Google Scholar]
- Gore, M.A. , Chia, J.M. , Elshire, R.J. , Sun, Q. , Ersoz, E.S. , Hurwitz, B.L. , Peiffer, J.A. et al. (2009) A first‐generation haplotype map of maize. Science, 326, 1115–1117. [DOI] [PubMed] [Google Scholar]
- Han, B. and Xue, Y. (2003) Genome‐wide intraspecific DNA‐sequence variations in rice. Curr. Opin. Plant Biol. 6, 134–138. [DOI] [PubMed] [Google Scholar]
- Henrichsen, C.N. , Chaignat, E. and Reymond, A. (2009) Copy number variants, diseases and gene expression. Hum. Mol. Genet. 18, R1–R8. [DOI] [PubMed] [Google Scholar]
- Herbig, A. , Jäger, G. , Battke, F. and Nieselt, K. (2012) GenomeRing: alignment visualization based on SuperGenome coordinates. Bioinformatics, 28, i7–i15. [DOI] [PMC free article] [PubMed] [Google Scholar]
- Hirsch, C.N. , Foerster, J.M. , Johnson, J.M. , Sekhon, R.S. , Muttoni, G. , Vaillancourt, B. , Peñagaricano, F. et al. (2014) Insights into the maize pan‐genome and pan‐transcriptome. Plant Cell Online, 26, 121–135. [DOI] [PMC free article] [PubMed] [Google Scholar]
- Holt, C. and Yandell, M. (2011) MAKER2: an annotation pipeline and genome‐database management tool for second‐generation genome projects. BMC Bioinform. 12, 491. [DOI] [PMC free article] [PubMed] [Google Scholar]
- Initiative (2000) Analysis of the genome sequence of the flowering plant Arabidopsis thaliana . Nature, 408, 796–815. [DOI] [PubMed] [Google Scholar]
- Iqbal, Z. , Caccamo, M. , Turner, I. , Flicek, P. and McVean, G. (2012) De novo assembly and genotyping of variants using colored de Bruijn graphs. Nat. Genet. 44, 226–232. [DOI] [PMC free article] [PubMed] [Google Scholar]
- Koren, S. and Phillippy, A.M. (2015) One chromosome, one contig: complete microbial genomes from long‐read sequencing and assembly. Curr. Opin. Microbiol. 23, 110–120. [DOI] [PubMed] [Google Scholar]
- Lai, J. , Li, R. , Xu, X. , Jin, W. , Xu, M. , Zhao, H. , Xiang, Z. et al. (2010) Genome‐wide patterns of genetic variation among elite maize inbred lines. Nat. Genet. 42, 1027–1030. [DOI] [PubMed] [Google Scholar]
- Lai, K. , Lorenc, M.T. , Lee, H.C. , Berkman, P.J. , Bayer, P.E. , Visendi, P. , Ruperao, P. et al. (2015) Identification and characterization of more than 4 million intervarietal SNPs across the group 7 chromosomes of bread wheat. Plant Biotechnol. J. 13, 97–104. [DOI] [PubMed] [Google Scholar]
- Laing, C. , Buchanan, C. , Taboada, E. , Zhang, Y. , Kropinski, A. , Villegas, A. , Thomas, J. et al. (2010) Pan‐genome sequence analysis using Panseq: an online tool for the rapid analysis of core and accessory genomic regions. BMC Bioinform. 11, 461. [DOI] [PMC free article] [PubMed] [Google Scholar]
- Lam, H.M. , Xu, X. , Liu, X. , Chen, W.B. , Yang, G.H. , Wong, F.L. , Li, M.W. et al. (2010) Resequencing of 31 wild and cultivated soybean genomes identifies patterns of genetic diversity and selection. Nat. Genet. 42, 1053–U1041. [DOI] [PubMed] [Google Scholar]
- Li, L. , Stoeckert, C.J. and Roos, D.S. (2003) OrthoMCL: identification of ortholog groups for eukaryotic genomes. Genome Res. 13, 2178–2189. [DOI] [PMC free article] [PubMed] [Google Scholar]
- Li, R. , Zhu, H. , Ruan, J. , Qian, W. , Fang, X. , Shi, Z. , Li, Y. et al. (2010) De novo assembly of human genomes with massively parallel short read sequencing. Genome Res. 20, 265–272. [DOI] [PMC free article] [PubMed] [Google Scholar]
- Li, Y.‐H. , Zhou, G. , Ma, J. , Jiang, W. , Jin, L.‐G. , Zhang, Z. , Guo, Y. et al. (2014) De novo assembly of soybean wild relatives for pan‐genome analysis of diversity and agronomic traits. Nat. Biotech. 32, 1045–1052. [DOI] [PubMed] [Google Scholar]
- Lin, K. , Zhang, N. , Severing, E. , Nijveen, H. , Cheng, F. , Visser, R. , Wang, X. et al. (2014) Beyond genomic variation – comparison and functional annotation of three Brassica rapa genomes: a turnip, a rapid cycling and a Chinese cabbage. BMC Genom. 15, 250. [DOI] [PMC free article] [PubMed] [Google Scholar]
- Liu, F. , Zhu, Y. , Yi, Y. , Lu, N. , Zhu, B. and Hu, Y. (2014) Comparative genomic analysis of Acinetobacter baumannii clinical isolates reveals extensive genomic variation and diverse antibiotic resistance determinants. BMC Genom. 15, 1163. [DOI] [PMC free article] [PubMed] [Google Scholar]
- Marcus, S. , Lee, H. and Schatz, M.C. (2014) SplitMEM: a graphical algorithm for pan‐genome analysis with suffix skips. Bioinformatics, 30, 3476–3483. [DOI] [PMC free article] [PubMed] [Google Scholar]
- McHale, L.K. , Haun, W.J. , Xu, W.W. , Bhaskar, P.B. , Anderson, J.E. , Hyten, D.L. , Gerhardt, D.J. et al. (2012) Structural variants in the soybean genome localize to clusters of biotic stress‐response genes. Plant Physiol. 159, 1295–1308. [DOI] [PMC free article] [PubMed] [Google Scholar]
- McNally, K.L. , Childs, K.L. , Bohnert, R. , Davidson, R.M. , Zhao, K. , Ulat, V.J. , Zeller, G. et al. (2009) Genomewide SNP variation reveals relationships among landraces and modern varieties of rice. Proc. Natl. Acad. Sci. 106, 12273–12278. [DOI] [PMC free article] [PubMed] [Google Scholar]
- Medini, D. , Donati, C. , Tettelin, H. , Masignani, V. and Rappuoli, R. (2005) The microbial pan‐genome. Curr. Opin. Genet. Dev. 15, 589–594. [DOI] [PubMed] [Google Scholar]
- Morgante, M. , Brunner, S. , Pea, G. , Fengler, K. , Zuccolo, A. and Rafalski, A. (2005) Gene duplication and exon shuffling by helitron‐like transposons generate intraspecies diversity in maize. Nat. Genet. 37, 997–1002. [DOI] [PubMed] [Google Scholar]
- Ossowski, S. , Schneeberger, K. , Clark, R.M. , Lanz, C. , Warthmann, N. and Weigel, D. (2008) Sequencing of natural strains of Arabidopsis thaliana with short reads. Genome Res. 18, 2024–2033. [DOI] [PMC free article] [PubMed] [Google Scholar]
- Parra, G. , Bradnam, K. and Korf, I. (2007) CEGMA: a pipeline to accurately annotate core genes in eukaryotic genomes. Bioinformatics, 23, 1061–1067. [DOI] [PubMed] [Google Scholar]
- Quick, J. , Quinlan, A. and Loman, N. (2014) A reference bacterial genome dataset generated on the MinIONTM portable single‐molecule nanopore sequencer. GigaScience, 3, 22. [DOI] [PMC free article] [PubMed] [Google Scholar]
- Read, B.A. , Kegel, J. , Klute, M.J. , Kuo, A. , Lefebvre, S.C. , Maumus, F. , Mayer, C. et al. (2013) Pan genome of the phytoplankton Emiliania underpins its global distribution. Nature, 499, 209–213. [DOI] [PubMed] [Google Scholar]
- Saxena, R.K. , Edwards, D. and Varshney, R.K. (2014) Structural variations in plant genomes. Brief. Funct. Genomics 13, 296–307. [DOI] [PMC free article] [PubMed] [Google Scholar]
- Schatz, M. , Maron, L. , Stein, J. , Wences, A. , Gurtowski, J. , Biggers, E. , Lee, H. et al. (2014) Whole genome de novo assemblies of three divergent strains of rice, Oryza sativa, document novel gene space of aus and indica. Genome Biol. 15, 506. [DOI] [PMC free article] [PubMed] [Google Scholar]
- Scherer, S.W. , Lee, C. , Birney, E. , Altshuler, D.M. , Eichler, E.E. , Carter, N.P. , Hurles, M.E. et al. (2007) Challenges and standards in integrating surveys of structural variation. Nat. Genet. 39, S7–S15. [DOI] [PMC free article] [PubMed] [Google Scholar]
- Segerman, B. (2012) The genetic integrity of bacterial species: the core genome and the accessory genome, two different stories. Front Cell. Infect. Microbiol. 2, 116. [DOI] [PMC free article] [PubMed] [Google Scholar]
- Shen, J. , Araki, H. , Chen, L. , Chen, J.‐Q. and Tian, D. (2006) Unique evolutionary mechanism in R‐genes under the presence/absence polymorphism in Arabidopsis thaliana. Genetics, 172, 1243–1250. [DOI] [PMC free article] [PubMed] [Google Scholar]
- Snipen, L. and Liland, K.H. (2015) micropan: an R‐package for microbial pan‐genomics. BMC Bioinform. 16, 79. [DOI] [PMC free article] [PubMed] [Google Scholar]
- Springer, N.M. , Ying, K. , Fu, Y. , Ji, T. , Yeh, C.‐T. , Jia, Y. , Wu, W. et al. (2009) Maize inbreds exhibit high levels of copy number variation (CNV) and presence/absence variation (PAV) in genome content. PLoS Genet. 5, e1000734. [DOI] [PMC free article] [PubMed] [Google Scholar]
- Stalker, J. , Gibbins, B. , Meidl, P. , Smith, J. , Spooner, W. , Hotz, H.R. and Cox, A.V. (2004) The Ensembl Web site: mechanics of a genome browser. Genome Res. 14, 951–955. [DOI] [PMC free article] [PubMed] [Google Scholar]
- Swanson‐Wagner, R.A. , Eichten, S.R. , Kumari, S. , Tiffin, P. , Stein, J.C. , Ware, D. and Springer, N.M. (2010) Pervasive gene content variation and copy number variation in maize and its undomesticated progenitor. Genome Res. 20, 1689–1699. [DOI] [PMC free article] [PubMed] [Google Scholar]
- Tan, S. , Zhong, Y. , Hou, H. , Yang, S. and Tian, D. (2012) Variation of presence/absence genes among Arabidopsis populations. BMC Evol. Biol. 12, 86. [DOI] [PMC free article] [PubMed] [Google Scholar]
- Tettelin, H. , Masignani, V. , Cieslewicz, M.J. , Donati, C. , Medini, D. , Ward, N.L. , Angiuoli, S.V. et al. (2005) Genome analysis of multiple pathogenic isolates of Streptococcus agalactiae: implications for the microbial “pan‐genome”. Proc. Natl Acad. Sci. USA, 102, 13950–13955. [DOI] [PMC free article] [PubMed] [Google Scholar]
- Tettelin, H. , Riley, D. , Cattuto, C. and Medini, D. (2008) Comparative genomics: the bacterial pan‐genome. Curr. Opin. Microbiol. 11, 472–477. [DOI] [PubMed] [Google Scholar]
- Vernikos, G. , Medini, D. , Riley, D.R. and Tettelin, H. (2015) Ten years of pan‐genome analyses. Curr. Opin. Microbiol. 23, 148–154. [DOI] [PubMed] [Google Scholar]
- Winzer, T. , Gazda, V. , He, Z. , Kaminski, F. , Kern, M. , Larson, T.R. , Li, Y. et al. (2012) A Papaver somniferum 10‐gene cluster for synthesis of the anticancer alkaloid noscapine. Science, 336, 1704–1708. [DOI] [PubMed] [Google Scholar]
- Xu, X. , Liu, X. , Ge, S. , Jensen, J.D. , Hu, F. , Li, X. , Dong, Y. et al. (2012) Resequencing 50 accessions of cultivated and wild rice yields markers for identifying agronomically important genes. Nat. Biotechnol. 30, 105–111. [DOI] [PubMed] [Google Scholar]
- Yu, P. , Wang, C. , Xu, Q. , Feng, Y. , Yuan, X. , Yu, H. , Wang, Y. et al. (2011) Detection of copy number variations in rice using array‐based comparative genomic hybridization. BMC Genom. 12, 372. [DOI] [PMC free article] [PubMed] [Google Scholar]
- Zerbino, D.R. and Birney, E. (2008) Velvet: algorithms for de novo short read assembly using de Bruijn graphs. Genome Res. 18, 821–829. [DOI] [PMC free article] [PubMed] [Google Scholar]
- Zhang, F. , Gu, W. , Hurles, M.E. and Lupski, J.R. (2009) Copy number variation in human health, disease, and evolution. Annu. Rev. Genomics Hum. Genet. 10, 451–481. [DOI] [PMC free article] [PubMed] [Google Scholar]
- Zhang, L.‐M. , Luo, H. , Liu, Z.‐Q. , Zhao, Y. , Luo, J.‐C. , Hao, D.‐Y. and Jing, H.‐C. (2014) Genome‐wide patterns of large‐size presence/absence variants in sorghum. J. Integr. Plant Biol. 56, 24–37. [DOI] [PubMed] [Google Scholar]
- Zhao, Y. , Wu, J. , Yang, J. , Sun, S. , Xiao, J. and Yu, J. (2012) PGAP: pan‐genomes analysis pipeline. Bioinformatics, 28, 416–418. [DOI] [PMC free article] [PubMed] [Google Scholar]
- Zhao, Y. , Jia, X. , Yang, J. , Ling, Y. , Zhang, Z. , Yu, J. , Wu, J. et al. (2014) PanGP: a tool for quickly analyzing bacterial pan‐genome profile. Bioinformatics, 30, 1297–1299. [DOI] [PMC free article] [PubMed] [Google Scholar]
- Zhou, Y. , Burnham, C.‐A.D. , Hink, T. , Chen, L. , Shaikh, N. , Wollam, A. , Sodergren, E. et al. (2014) Phenotypic and genotypic analysis of Clostridium difficile Isolates: a single‐center study. J. Clin. Microbiol. 52, 4260–4266. [DOI] [PMC free article] [PubMed] [Google Scholar]
- Zimin, A.V. , Marçais, G. , Puiu, D. , Roberts, M. , Salzberg, S.L. and Yorke, J.A. (2013) The MaSuRCA genome assembler. Bioinformatics, 29, 2669–2677. [DOI] [PMC free article] [PubMed] [Google Scholar]