

Summary
A characteristic feature of peanut is the subterranean fructification, geocarpy, in which the gynophore (‘peg’), a specialized organ that transitions from upward growth habit to downward outgrowth upon fertilization, drives the developing pod into the soil for subsequent development underground. As a step towards understanding this phenomenon, we explore the developmental dynamics of the peanut pod transcriptome at 11 successive stages. We identified 110 217 transcripts across developmental stages and quantified their abundance along a pod developmental gradient in pod wall. We found that the majority of transcripts were differentially expressed along the developmental gradient as well as identified temporal programs of gene expression, including hundreds of transcription factors. Thought to be an adaptation to particularly harsh subterranean environments, both up‐ and down‐regulated gene sets in pod wall were enriched for response to a broad array of stimuli, like gravity, light and subterranean environmental factors. We also identified hundreds of transcripts associated with gravitropism and photomorphogenesis, which may be involved in the geocarpy. Collectively, this study forms a transcriptional baseline for geocarpy in peanut as well as provides a considerable body of evidence that transcriptional regulation in peanut aerial and subterranean fruits is complex.
Keywords: peanut (Archis hypogaea L.), RNA‐Seq, Geocarpy, fruit development
Introduction
Peanut or groundnut (Arachis hypogaea L.) is an important food and cash crop for edible oil and protein production in tropical, subtropical and warm regions of the world. Despite a member of the Fabaceae family, its fruit is actually the subterranean pod. Peanut shows a distinctive pattern of fruit development, ‘aerial flower and subterranean fruit’ (Smith, 1950), quite different from those of other legume species. Following fertilization, the gynophore elongates to form a specialized geotropic organ (peg) (Smith, 1950). The peg‐harbouring embryo continues to grow and pushes the developing pod into the soil for the subsequent pod development underground. After penetration into soil, pod formation and embryo differentiation occur, and a seed is produced (Feng et al., 1995). The subterranean fructification is the most prominent characteristic of seed production in peanut and thus has the biologically important value for studying organogenesis and evolution. More importantly, the study of peanut pod is of significance for understanding mechanisms controlling plant reproductive development and crop improvement under dark conditions. Thought to be an adaptation to particularly harsh environments, geocarpy is severely influenced by subterranean environmental factors. Pod wall tissues in peanut provide functions not only in serving to protect the seeds, but also in delivering nutrients to seed as part of source–sink pathway, as well as producing metabolized storage products, like other legumes (Setia et al., 1987; Thorne, 1979; Wang and Grusak, 2005). Thus, a comprehensively transcriptomic foundation should help in this effort.
Transcriptomics resources for peanut research have emerged in the past decade. The peanut transcriptomes have been surveyed by cDNA sequencing, such as expressed sequence tags (EST) (Bi et al., 2010; Guo et al., 2008, 2009; Luo et al., 2005). These EST sequencing efforts have allowed the identification of functional genes resistant to abiotic and biotic stresses in peanut. Microarrays have also been used to investigate the global transcription profiles of different peanut varieties (Chen et al., 2012) as well as expression patterns in a variety of peanut tissues under various conditions (Guo et al., 2011; Li et al., 2013; Payton et al., 2009; Wang et al., 2012). Using such approaches, however, it is difficult to define the transcriptome at single‐base resolution. Recently, RNA sequencing (RNA‐Seq) using next‐generation sequencing (NGS) is becoming a revolutionary tool for transcriptomics (Wang et al., 2009) and has been widely applied in plant biology, both in model species such as Arabidopsis (Lister et al., 2008) and in crop plants including rice (Lu et al., 2010) and maize (Li et al., 2010), as well as recently in peanut (Chen et al., 2013; Xia et al., 2013; Yin et al., 2013; Zhang et al., 2012). Transcriptomics has matured to the point where complex gene regulatory networks comprising mRNA expression and transcription factors aid in elucidating complex developmental processes (Scanlon and Timmermans, 2013). Understanding the global expression profiling of peanut pods and defining their transcriptomes will provide crucial information for understanding geocarpy in peanut.
Here, we yielded the first transcriptional map of the pod developmental transcriptome at single‐base resolution using RNA‐seq. We sequenced two stages of whole pods (aerial pod and not swelling subterranean pod) and nine stages of isolated pod walls representing 11 distinct stages of pod development with the following objectives: (i) to catalogue gene expression patterns during peanut pod development across the aerial and underground developmental stages; (ii) to characterize the major biological processes like gravitropism and subterranean fruit development. Taken together, our data could serve as a valuable resource for transcriptomics studies related to peanut pod for developmental biologists, who are interested in studying fruit development under dark conditions, as well as for the general transcriptomics community.
Results and Discussions
Transcriptome sequencing of aerial pod and subterranean pod wall
For a comprehensive understanding of subterranean fructification in peanut, we selected two stages of whole pods (aerial pod, P0 and not swelling subterranean pod, P1) and nine stages of isolated pod walls (P2SH‐P10SH) (Table S1) for RNA‐Seq analysis. Using Illumina HiSeq2000 platform, between 38 and 72 million 101‐nt reads were generated for each sample (Table S2 and S3). The sequence data are deposited in NCBI Sequence Read Archive (SRA, http://www.ncbi.nlm.nih.gov/sra) under the accession number SRP033292. A reference transcriptome sequence was assembled using a genome‐guided strategy using Trinity (Grabherr et al., 2011). We aligned each individual library's data against the reference transcriptome sequence using Bowtie2 (Langmead et al., 2009). Tolerances were set to allow up to five mismatches in each alignment, and reads that aligned to multiple reference transcripts were ignored. By these criteria, 90.14%–93.15% of paired‐end reads (PEs) were uniquely mapped to the reference transcriptome and 4.02%–5.83% of PEs was filtered as reads with bad matches (Table S4 and Figure 1a). The remaining reads (2.83%–4.03%) were defined as unmapped reads. The mean number of mapped reads in different libraries ranged from 98 (P1) to 214 (P4SH) (Figure 1b).
Figure 1.
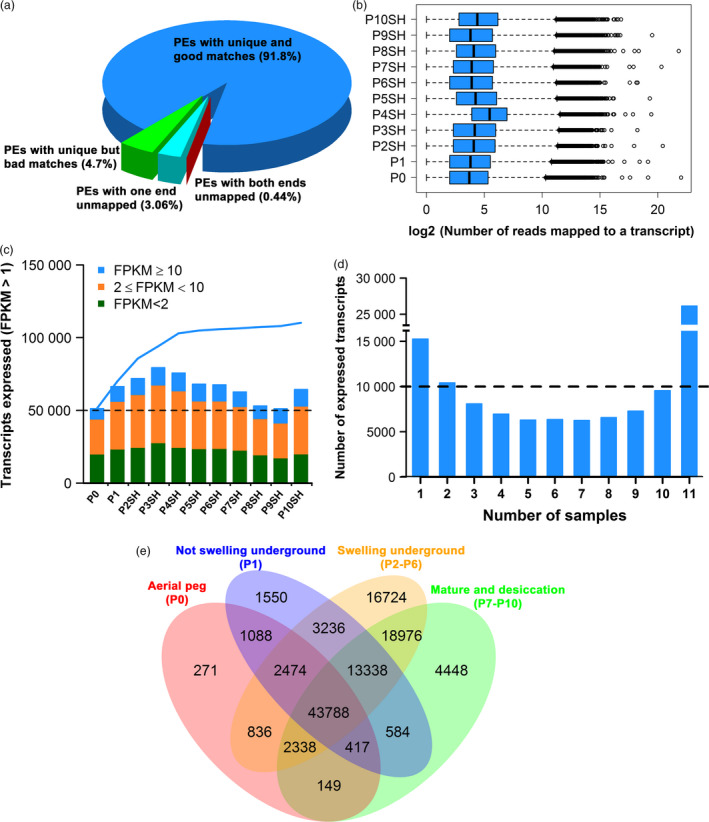
Number of genes expressed in aerial peg and subterranean pod walls. (a) Overall mapping results of paired‐end reads (PEs) for all libraries referring to the reference transcriptome. (b) Distribution of the number of uniquely mapped paired‐end reads (PEs) for each library. (c) Proportion of genes expressed at different levels (based on FPKM) during the 11 developmental stages. The bars indicate the number of transcripts expressed in each sample, and the line indicates the cumulative number of expressed transcripts. (d) Number of specific and shared transcripts expressed in single sample (1), multiple samples (2–10) or all samples (11) during pod development. (e) Venn diagram of the numbers of expressed transcripts in aerial pod (P0), whole pod not swelling underground (P1) and pod walls during pod swelling underground (P2–P6) as well as pod walls during mature and desiccation stages (P7–P10).
We estimated the expression levels of transcripts using fragments per kilobase of transcript per million mapped fragments (FPKM) (Trapnell et al., 2010). A gene was considered expressed in a sample if the FPKM was greater than one, and the lower value of the FPKM 95% confidence interval was greater than zero (Hansey et al., 2012). By this criterion, we found that 110 217 transcripts were expressed in at least one of the 11 samples, ranging from 51 293 to 79 518 (Figure 1c) in individual samples. The largest portion of transcripts showed medium expression (2 ≤ FPKM < 10), followed by low expression (FPKM < 2). The proportions of genes at three expression levels were similar in all stages. The number of transcripts expressed in single or multiple samples tended to shape a reverse parabolic distribution with stage‐specific and shared expressed transcripts being the largest group (Figure 1d). Among the 11 stages, aerial pod (P0) contained the smallest number of transcripts (271) specifically detected in this stage, while 16 724 transcripts were detected only in subterranean pod swelling stages (P2–P6). About 43 788 transcripts were shared in the four periods (Figure 1e). Despite the similar number of expressed transcripts in each sample, Pearson correlation coefficients indicated that underlying expression dynamics were greatly diverse during pod development (Figure S1). We identified 109 063 transcripts that were differentially expressed between samples pairwise (Figure S2 and Table S5). Strikingly, up‐regulated transcripts in aerial pod (P0) accounted for only ~19% of differentially expressed (DE) transcripts compared with those in subterranean samples. We employed qRT‐PCR to validate the expression levels based on RNA‐Seq. A high correlation between two approaches was observed (Figure S3).
Identification of temporally up‐ and down‐regulated genes in pod wall throughout pod development
To characterize the temporal expression patterns of genes expressed throughout pod development, we used StepMiner (Sahoo et al., 2007) to identify four temporal expression patterns including one‐step‐up (expression level transitions from low to high in two consecutive developmental stages), one‐step‐down (from high to low), two‐step‐up/down (transitions from low to high and then back down in a series of developmental stages) and two‐step‐down/up transitions (from high to low and then back up) (Figure 2a). We identified 7,702 genes with one or two transition points in expression during P0–P10 stages (Figure 2 and Table S6). One‐step patterns accounted for the majority of the identified genes, including 39.3% of genes with the one‐step‐up pattern and 32.2% of genes with the one‐step‐down pattern, while 28.5% of identified genes showed two transition points (two‐step‐up/down and two‐step‐down/up genes) (Table S6). With genes exhibiting a one‐step‐down transition point, the transition in expression level occurred mostly at P10SH stage in which desiccation occurs.
Figure 2.

Identification of temporal up‐ and down‐regulated gene sets. (a) Identification of the one‐step‐up (K1), one‐step‐down (K2), two‐step‐up/down (K3) and two‐step‐down/up (K4) transitions for all transcripts across pod development using StepMiner. The number of all transcripts (left) and transcription factors (right) is indicated in parentheses for each cluster. The scale colour bar is shown on the bottom. (b) Number of transcripts in one‐step and two‐step gene sets.
According to material collection information, pod expansion started at P2 stage and the pod size reached its maximum (~16.5 mm) at P6 stage (Table S1). Pod enlargement occurred during P2–P6 stages, suggesting that up‐at‐P2 genes, showing lower expression at P0–P1 stages and higher expression during P2SH‐P6SH, may be associated with pod swelling. We further classified these one‐step and two‐step genes based on phenotypic difference during pod swelling underground. For one‐step‐up genes, the major expression transition occurs at P2SH (Figure 2), indicating a dramatic reprogramming of pod wall transcriptome started from P2SH, consistent with phenotypic differentiation that pod swelling starts at this time point. With genes showing two‐step‐up‐down transition point, transition occurred more frequently during P2SH‐P6SH. Approximately 49% (920/1879) of two‐step‐up‐down genes may be involved in the pod enlargement. To confidently identify a set of transcripts accompanying with pod enlargement, we further filtered the 920 genes using a more stringent criteria, which required that all genes showed lower expression at P0–P1, higher expression consistently during P2SH to P6SH and then lower expression during P7SH‐P10SH. Accordingly, we obtained 43 transcripts that sufficed the criteria (Table S7). This gene set contained a number of known genes involved in cell wall expansion; for example, endoglucanase can induce extension of cell walls and play roles in the assembly of the cellulose–hemicellulose network in the expanding cell wall (Klose et al., 2015; Nicol et al., 1998; Yuan et al., 2001), consistent with cross section of pod wall (Figure S4). In addition, approximately 63% (27/43) of genes in this group are unknown (uncharacterized genes or no homologs found in the UniProt database), suggesting that pod enlargement underground is a complex biological process regulated by a series of genes not yet identified in addition to previously described genes.
Biological processes enriched in temporally up‐ and down‐regulated gene sets of pod wall
The identified temporal up‐ and down‐regulated gene sets are likely associated with specific biological processes or pathways involved in pod development. We used Cytoscape (Su et al., 2014) with plugin BiNGO (Maere et al., 2005) to identify the major biological processes that were significantly enriched (false discovery rate < 0.01) in temporally up‐ and down‐regulated gene sets.
The one‐step‐up gene sets were shown to be enriched for ‘response to stimulus’, ‘developmental process’, ‘transport’ and ‘metabolic process’ (Figure S5). The response to stimulus category included a broad range of stimuli like abiotic and biotic, external and endogenous stimuli (Figure 3a), suggesting that subterranean developing pods suffered from various adverse environmental factors. Pod wall has evolved the capacity to adapt to particularly harsh subterranean environments as a protective organ. We found that functional overrepresentations included ‘response to abscisic acid stimulus’. Significant quantities of abscisic acid were once found in legume pod walls as maturity approached (Eeuwens and Schwabe, 1975). In addition to response to endogenous stimulus, genes in peanut pod walls were shown to be enriched for response to fungus, bacterium and nematode which are soilborne major pathogens causing damages to peanut (Holbrook et al., 2000; Singh et al., 1997; Starr and Simpson, 2006). As expected, developmental process was enriched in pod walls during pod development (Figure 3b). In addition, transport was overrepresented in pod wall, consistent with its function in not only serving to protect the seeds but also delivering nutrients to the seed as part of the source–sink pathway (Wang and Grusak, 2005).
Figure 3.

Enrichment analysis of gene ontology and functional annotation of one‐ and two‐step gene sets. Overrepresented gene ontology categories in one‐step‐up (a,b), one‐step‐down (c) and two‐step‐up‐down (d) gene sets. The circles are shaded based on significance level (yellow, false discovery rate < 0.01), and the radius of each circle denotes the number of genes in each category.
The one‐step‐down genes were enriched for less diverse GO categories in comparison with one‐step‐up genes. Key functional overrepresentations included ‘response to stimulus’ and ‘metabolic process’ (Figure S6). Under the category of ‘response to stimulus’, child categories showed dramatic difference between the one‐step‐up and one‐step‐down gene sets, indicating that the two gene sets may play different roles in response to various stimuli (Figure 3c). The one‐step‐down genes were enriched for ‘response to auxin’ and ‘response to light stimulus’ as well as ‘response to gravity’ which are important to the peanut prominent feature ‘aerial flower and subterranean fruit’. Although ‘developmental process’ category was also found to be enriched in one‐step‐down genes, only few child categories were identified to be enriched, indicating developmental processes of pod walls underground were regulated mainly by up‐regulated genes but not down‐regulated genes.
The two‐step gene sets covered a narrow range of GO categories with enrichment in comparison with one‐step gene sets (Figure S7 and S8). Two‐step‐up‐down genes were enriched for ‘cell wall organization or biogenesis’ and its child categories like ‘plant‐type‐cell wall organization or biogenesis’ and ‘plant‐type cell wall loosening’ (Figure 3d), indicating that pod wall was gradually swelling during P2‐P6 stages and then ceased swelling during P7‐P10 stages.
Collectively, due to the geocarpy feature, the fructification of peanut is affected not only by terrestrial environmental factors, but also by subterranean environmental factors (Ono, 1979; Varaprasad et al., 1999, 2000), resulting in that the four temporal gene sets are enriched for ‘response to stimulus’, indicating that peanut subterranean pod develops under various endogenous and exogenous stimuli.
Identification of stage‐specific gene sets across pod development
To discover the gene expression programs that characterize pod wall during pod development, mRNA‐specific accumulation at each stage was measured using a specificity index (τ) (Yanai et al., 2005) to the genes with FPKM ≥ 2 in at least one sample. Here, τ values, varying between 0 for completely housekeeping genes and 1 for strictly one‐stage‐specific genes, shaped a parabolic distribution with intermediate specificities (0.5 ≤ τ ≤ 0.55) being the largest group (Figure 4a). In this study, genes with τ ≥ 0.9 were defined as being expressed in a stage‐specific pattern. By this criterion, 5474 stage‐specific genes were identified (Figure 4 and Table S8). The number of identified stage‐specific genes showed dramatic difference among the 11 stages, ranging from a low of 12 to a high of 2611 (Figure 4b), quite different from the similarity of the overall mRNA profiles detected among the stages (Figure 1c). The highest number of stage‐specific genes was identified in P4SH (2611 genes), followed by P10SH (1120 genes), two times more than the numbers of those genes detected in other stages. In terms of TFs, the highest number of stage‐specific TFs was detected in P10SH (475), followed by P4SH (324). Pod enlargement started at P2 stage, and then, pod size reached its maximum (~16.5 mm) at P6 stage in which the seed size remained ~ 2 mm (Table S1). The P4SH sample was collected from pod walls at the middle time point of pod enlargement, at which pod wall expanded rapidly relative to at other stages. Given desiccation occurring at P10SH stage, large numbers of genes and TFs were required to function in pod desiccation. Taken together, the variable number and proportion of stage‐specific genes and TFs suggested the more complex gene expression profiles in pod enlargement and desiccation, implying the complexity of the peanut geocarpy.
Figure 4.

Stage‐specific gene sets in aerial peg and subterranean pod wall across pod development. (a) Distribution of τ values of expressed genes from all samples. τ values varied between 0 for completely housekeeping genes and 1 for strictly stage‐specific genes. In this study, τ values were divided into twenty bins for histogram. (b) Numbers of TF and non‐TF genes in each stage‐specific gene set. (c) Heatmap of scaled FPKM values of the stage‐specific genes. Red, high expression; white, low expression.
Identification of gravitropism‐ and photomorphogenesis‐related genes during pod development
The most salient feature of peanut fruit production is that the pod does not swell until it penetrates into the soil. Penetrating into the soil and then swelling of gynophore (‘peg’) tips are essential processes described for peanut pod development, which is the crucial determinant of peanut yield. In the previous study, we elucidated why aerially developing pods could not swell normally compared with those that penetrated into soil (Chen et al., 2013). Here, we attempt to focus on the downward outgrowth and pod formation in subterranean darkness.
We searched expressed transcripts in pod wall against the gene set falling under the GO category ‘gravitropism’ (GO:0009630) or experimentally identified in Arabidopsis using an E‐value cut‐off of 1E‐10, and identified 151 gravitropism‐related genes expressed during pod development. GO enrichment analysis showed that these genes were enriched for ‘gravitropism’, ‘response to gravity’, ‘positive gravitropism’ and ‘negative gravitropism’ (Figure 5a) with the GO category including experimentally identified gravitropic genes, like Auxin influx carrier (AUX1), Altered Response to Gravity (ARG1) and Gravitropism Defective 2 (GRV2/SGR8) genes, which have been well characterized to function in gravitropism (Bennett et al., 1996; Sedbrook et al., 1999; Silady et al., 2004). Further analysis identified 25 genes likely to be gravitropic including 4 involved in gravity perception, eight in signal transduction and 13 in organ response (Table S9) based on previous functional studies (Bennett et al., 1996; Caspar and Pickard, 1989; Friml et al., 2002; Harrison and Masson, 2008; Kato et al., 2002; Morita et al., 2006; Noh et al., 2003; Sedbrook et al., 1999; Silady et al., 2004; Swarup et al., 2004; Withers et al., 2013; Yano et al., 2003; Young et al., 2006). Of them, 24 were identified in the peanut progenitor A genome (Arachis duranensis). This suggests that bona fide gravitropic genes not only were identified in the Arachis genome, but also were truly expressed during pod development.
Figure 5.

Expressed genes related to gravitropism and photomorphogenesis. (a) GO enrichment analysis of identified genes. Bars with numbers showed the number of genes involved in a particular GO category. Colours indicated P‐value of enrichment analysis (yellow, P < 0.001; orange, P < 3E‐93). (b) Heatmap showing distinct expression profiles of identified genes related to gravitropism and photomorphogenesis.
In general, fruit development is genetically controlled usually under light conditions, while peanut fruit development occurs in darkness (subterranean fructification) with peg elongation responding conversely to light/dark conditions (Shlamovitz et al., 1995; Smith, 1950). In this study, we identified 245 expressed genes associated with photomorphogenesis using similarity search against 274 photomorphogenesis‐related genes previously identified in Arabidopsis or falling under the GO category ‘photomorphogenesis’(GO:0009640). These genes were identified to be enriched for a broad array of GO categories associated with photomorphogenesis (Figure 5a). We also found two genes involved in skotomorphogenesis and six in de‐etiolation. Expression of identified photomorphogenesis‐related genes was grouped around four patterns (Figure 5b). Majority of genes were up‐regulated in P2SH and P10SH, suggesting that these genes may play roles in the regulation of peanut pod morphogenesis in subterranean darkness.
Conclusion
Collectively, through generating a highly resolved and extensive transcriptome map of developing peanut pod, we have set up a solid framework for a systemic approach to understand fruit development underground. We have shown that the peanut fruit, with its prominent characteristics of subterranean development, would provide great potential to elucidate this distinctive fruit development – ‘aerial flower, subterranean fruit’, as well as explore the fruit development under dark conditions.
Materials and Methods
Plant materials and RNA isolation
Plants of ‘Yueyou 7’, a widespread cultivar in the southern China, were grown in fields in the summer (March–July, 2011) at the experimental station of Guangdong Academy of Agricultural Sciences. Aerial and subterranean pods were collected from plants grown in the field. Selfed flowers were identified with coloured plastic thread, and elongating aerial pegs were tied with coloured tags on the eighth day after flowering (DAF). The samples were from two stages of whole pods (aerial pod and subterranean pod, not swelling) and nine stages of isolated pod walls. The stages were mainly defined by pod diameter and seed diameter with days after flowering as reference. The pod diameter was determined at the base of the pod adjacent to the gynophore, and the seed located at the base of the pod was used to measure the diameter. The fruits were classified based on size rather than time after flowering because it is more reproducible in various growing conditions. The detailed information for sample collection was provided in Table S1. Total RNA was extracted using the RNeasy Plant Mini Kit (Qiagen). The quality and quantity of each RNA sample were assayed using NanoDrop (Thermo Scientific) and the Agilent 2100 Bioanalyzer (Agilent).
Illumina sequencing and reference transcriptome
RNA sequencing was performed at MacroGen Inc. (www.macrogen.com) using Illumina HiSequation 2000 platform. Library construction and sequencing followed the standard sequencing protocols recommended by Illumina. DNA fragments in the size for each library were listed in Table S2. We employed a combined assembly strategy (Martin and Wang, 2011) to yield a peanut reference transcriptome sequence. First, reads were aligned to the peanut progenitor (Arachis duranensis) genome (unpublished data) using TopHat (Trapnell et al., 2009) with default arguments. Second, aligned reads were assembled using Trinity with a genome‐guided strategy (–genome_guided_max_intron 10000 –max_memory 64G –CPU 16). Third, de novo assembly was performed on unaligned reads using Trinity (–max_memory 64G –CPU 16 –bflyCPU 16). Fourth, both assemblies by Trinity were used for a super assembly using TGICL (version 2.0; http://sourceforge.net/projects/tgicl). Finally, redundancy and isoforms were removed using CD‐HIT‐EST (Li and Godzik, 2006) and the longest transcripts were retained, generating a reference transcriptome sequence.
RNA‐seq data alignment and transcriptome profile
We used Bowtie 2 (Langmead and Salzberg, 2012) to map paired‐end reads (PEs) to the reference transcriptome, allowing at most five mismatches. Reads with multiple matches are removed from the primary search results. For each pair of forward and reverse reads, we required that both ends should uniquely map to the same transcript. After these filtering, we collected a set of uniquely mapped pairs for the subsequent abundance estimation. Using the uniquely mapped read pairs, we estimated the expression levels of transcripts using Fragments Per Kilobase of transcript per Million mapped fragments (FPKM) (Trapnell et al., 2010) in a way similar to reads per kilobase of exons per million mapped reads (RPKM) (Mortazavi et al., 2008). The upper and lower boundary values of a FPKM 95% confidence interval were calculated using the R stats package. A gene was defined as expressed in a given sample if its low confidence boundary value was greater than zero. A gene was considered lowly expressed if the FPKM value was ≤2, moderately expressed if the FPKM value was >2 and ≤10, and highly expressed if the FPKM value was >10.
Identification of stage‐specific gene sets
The genes specifically expressed at each stage were identified using a single statistical analysis, τ value, which was developed by Yanai et al. (2005) for tissue specificity index:
where N is the number of samples, R(i, j) is the expression value of i gene in j sample, and R(i, max) is the maximal value of gene i in all samples examined. The τ values range from 0 to 1, and the higher the τ value of a gene for a stage, the more likely the genes is specifically expressed at that stage.
Assessment of gene expression
In this study, we employed two programs for the identification of DE transcripts. Transcripts that were defined as DE genes by both programs were considered to be DE transcripts. First, DE transcripts were calculated from different samples using an R package (DEGseq) proposed by Wang et al. (2010). The DEGseq analysis was performed on read counts of expressed genes as defined above. For each gene, the P‐value and Q‐value were calculated. The significant threshold to control the FDR at a given value was computed. Then, we identified DE transcripts using the GFOLD package (Feng et al., 2012). GFOLD assigned reliable statistics for expression changes based on the posterior distribution of log fold change. We used an in‐house Perl script to extract DE transcripts from the output files generated by both programs. DE transcripts that were detected by only one program were ignored and not used for further analysis.
Functional annotation and analysis
Expressed genes were subjected to BLASTX analysis against the following databases: (i) Uniprot Viridiplantae database for deducing putative function; (ii) the Arabidopsis protein database (TAIR10_pep_20101214_update ftp://ftp.arabidopsis.org) for GO enrichment analysis. An E‐value threshold of 1E‐5 was used to determine the significant hits. The putative functions of query transcripts were defined by the first subject hits. An in‐house Perl script was used to perform gene ontology (GO) annotation based on UniProtKB GOA file (ftp://ftp.ebi.ac.uk). Identification of significantly enriched gene ontology (GO) categories (P‐value ≤ 0.05) was performed using the Cytoscape (version 3.0) with a plugin BiNGO (Maere et al., 2005; Su et al., 2014).
qRT‐PCR analysis
To validate RNA‐seq results, quantitative real‐time RT‐PCRT was conducted as previously described (Chen et al., 2013). All assays for a particular gene were performed in triplicate synchronously under identical conditions. All qRT‐PCR experiments were run in a 25‐μl volume with the Roche LightCyler 480 system (Roche). The actin gene was used as a reference. Relative quantification analyses of all target genes were performed using the E (Efficiency)‐method from Roche Applied Science (Tellmann and Geulen, 2006). The expression level of each target gene was normalized to the level of the reference gene. The relative expression values were then validated for the RNA‐seq data.
Supporting information
Figure S1 Correlation of gene expression levels between samples using RNA‐seq data.
Figure S2 Differentially expressed genes (DEGs) between samples pairwise.
Figure S3 Validation of the RNA‐seq results by qRT‐PCR.
Figure S4 Cross sections of pod wall with 1‐5 mm diameter.
Figure S5 Enrichment analysis of gene ontology (GO) categories assigned to one‐step‐up transcripts using BiNGO.
Figure S6 Enrichment analysis of gene ontology (GO) categories belonging to Biological Process assigned to one‐step‐down transcripts using BiNGO.
Figure S7 Enrichment analysis of gene ontology (GO) categories belonging to Biological Process assigned to two‐step‐up‐down transcripts using BiNGO.
Figure S8 Enrichment analysis of gene ontology (GO) categories belonging to Biological Process assigned to two‐step‐down‐up transcripts using BiNGO.
Table S1 Summary of pod wall samples during pod development in peanut.
Table S2 Information of library construction for high‐throughput sequencing.
Table S3 Raw and filtered reads of paired‐end libraries.
Table S4 Summary of RNA‐seq mapping results.
Table S5 Numbers of differentially expressed genes (DEGs) between pairwise samples.
Table S6 Temporal up‐ and down‐regulated genes identified using StepMiner.
Table S7 Two‐step‐up‐down genes showing lower expression at P0‐P1 and higher expression during P2SH‐P6SH and then lower expression during P7SH‐P10SH.
Table S8 τ values for stage‐specific genes.
Table S9 Gravitropism‐related genes identified in previous studies in Arabidopsis and their homologs in the Arachis duranensis genome and in the peanut pod transcriptome.
Acknowledgements
This research was funded by grants from Science and Technology Planning Project of Guangdong Province (No. 2012B050700007, 2011B010500019, 2013B050800021), Pearl River Science and Technology Nova of Guangzhou (No. 2011J2200035, 2013J2200088), National Natural Science Foundation of China (No. 31200155, 31501246, 31271767) and Natural Science Foundation of Guangdong Province (S2013020012647) and supported by the earmarked fund for Modern Agro‐industry Technology Research System (CARS‐14). The founders had no role in study design, data collection and analysis, decision to publish or preparation of the manuscript. We declare no conflict of interests.
References
- Bennett, M.J. , Marchant, A. , Green, H.G. , May, S.T. , Ward, S.P. , Millner, P.A. , Walker, A.R. et al. (1996) Arabidopsis AUX1 gene: a permease‐like regulator of root gravitropism. Science, 273, 948–950. [DOI] [PubMed] [Google Scholar]
- Bi, Y.P. , Liu, W. , Xia, H. , Su, L. , Zhao, C.Z. , Wan, S.B. and Wang, X.J. (2010) EST sequencing and gene expression profiling of cultivated peanut (Arachis hypogaea L.). Genome, 53, 832–839. [DOI] [PubMed] [Google Scholar]
- Caspar, T. and Pickard, B.G. (1989) Gravitropism in a starchless mutant of Arabidopsis : Implications for the starch‐statolith theory of gravity sensing. Planta, 177, 185–197. [PubMed] [Google Scholar]
- Chen, X. , Hong, Y. , Zhang, E. , Liu, H. , Zhou, G. , Li, S. , Zhu, F. et al. (2012) Comparison of gene expression profiles in cultivated peanut (Arachis hypogaea) under strong artificial selection. Plant Breeding, 131, 620–630. [Google Scholar]
- Chen, X. , Zhu, W. , Azam, S. , Li, H. , Zhu, F. , Li, H. , Hong, Y. et al. (2013) Deep sequencing analysis of the transcriptomes of peanut aerial and subterranean young pods identifies candidate genes related to early embryo abortion. Plant Biotechnol. J. 11, 115–127. [DOI] [PubMed] [Google Scholar]
- Eeuwens, C.J. and Schwabe, W.W. (1975) Seed and pod wall development in Pisum sativum, L. in relation to extracted and applied hormones. J. Exp. Bot. 26, 1–14. [Google Scholar]
- Feng, Q.L. , Stalker, H.T. , Pattee, H.E. and Isleib, T.G. (1995) Arachis hypogaea plant recovery through in vitro culture of peg tips. Peanut Sci. 22, 129–135. [Google Scholar]
- Feng, J. , Meyer, C.A. , Wang, Q. , Liu, J.S. , Shirley Liu, X. and Zhang, Y. (2012) GFOLD: a generalized fold change for ranking differentially expressed genes from RNA‐seq data. Bioinformatics, 28, 2782–2788. [DOI] [PubMed] [Google Scholar]
- Friml, J. , Wisniewska, J. , Benkova, E. , Mendgen, K. and Palme, K. (2002) Lateral relocation of auxin efflux regulator PIN3 mediates tropism in Arabidopsis. Nature, 415, 806–809. [DOI] [PubMed] [Google Scholar]
- Grabherr, M.G. , Haas, B.J. , Yassour, M. , Levin, J.Z. , Thompson, D.A. , Amit, I. , Adiconis, X. et al. (2011) Full‐length transcriptome assembly from RNA‐Seq data without a reference genome. Nat. Biotechnol. 29, 644–652. [DOI] [PMC free article] [PubMed] [Google Scholar]
- Guo, B. , Chen, X. , Dang, P. , Scully, B.T. , Liang, X. , Holbrook, C.C. , Yu, J. et al. (2008) Peanut gene expression profiling in developing seeds at different reproduction stages during Aspergillus parasiticus infection. BMC Dev. Biol. 8, 12. [DOI] [PMC free article] [PubMed] [Google Scholar]
- Guo, B. , Chen, X. , Hong, Y. , Liang, X. , Dang, P. , Brenneman, T. , Holbrook, C. et al. (2009) Analysis of gene expression profiles in leaf tissues of cultivated peanuts and development of EST‐SSR markers and gene discovery. Int. J. Plant Genomics, 2009, 715605. [DOI] [PMC free article] [PubMed] [Google Scholar]
- Guo, B. , Fedorova, N.D. , Chen, X. , Wan, C. , Wang, W. , Nierman, W.C. , Bhatnagar, D. et al. (2011) Gene expression profiling and identification of resistance genes to Aspergillus flavus Infection in peanut through EST and microarray strategies. Toxins, 3, 737–753. [DOI] [PMC free article] [PubMed] [Google Scholar]
- Hansey, C.N. , Vaillancourt, B. , Sekhon, R.S. , de Leon, N. , Kaeppler, S.M. and Buell, C.R. (2012) Maize (Zea mays L.) genome diversity as revealed by RNA‐sequencing. PLoS ONE, 7, e33071. [DOI] [PMC free article] [PubMed] [Google Scholar]
- Harrison, B.R. and Masson, P.H. (2008) ARL2, ARG1 and PIN3 define a gravity signal transduction pathway in root statocytes. Plant J., 53, 380–392. [DOI] [PubMed] [Google Scholar]
- Holbrook, C.C. , Kvien, C.K. , Rucker, K.S. , Wilson, D.M. and Hook, J.E. (2000) Preharvest aflatoxin contamination in drought tolerant and intolerant peanut genotypes. Peanut Sci., 27, 45–48. [Google Scholar]
- Kato, T. , Morita, M.T. , Fukaki, H. , Yamauchi, Y. , Uehara, M. , Niihama, M. and Tasaka, M. (2002) SGR2, a phospholipase‐like protein, and ZIG/SGR4, a SNARE, are involved in the shoot gravitropism of Arabidopsis. Plant Cell, 14, 33–46. [DOI] [PMC free article] [PubMed] [Google Scholar]
- Klose, H. , Gunl, M. , Usadel, B. , Fischer, R. and Commandeur, U. (2015) Cell wall modification in tobacco by differential targeting of recombinant endoglucanase from Trichoderma reesei. BMC Plant Biol. 15, 54. [DOI] [PMC free article] [PubMed] [Google Scholar]
- Langmead, B. and Salzberg, S.L. (2012) Fast gapped‐read alignment with Bowtie 2. Nat. Methods, 9, 357–359. [DOI] [PMC free article] [PubMed] [Google Scholar]
- Langmead, B. , Trapnell, C. , Pop, M. and Salzberg, S.L. (2009) Ultrafast and memory‐efficient alignment of short DNA sequences to the human genome. Genome Biol. 10, R25. [DOI] [PMC free article] [PubMed] [Google Scholar]
- Li, W. and Godzik, A. (2006) Cd‐hit: a fast program for clustering and comparing large sets of protein or nucleotide sequences. Bioinformatics, 22, 1658–1659. [DOI] [PubMed] [Google Scholar]
- Li, P. , Ponnala, L. , Gandotra, N. , Wang, L. , Si, Y. , Tausta, S.L. , Kebrom, T.H. et al. (2010) The developmental dynamics of the maize leaf transcriptome. Nat. Genet. 42, 1060–1067. [DOI] [PubMed] [Google Scholar]
- Li, H. , Chen, X. , Zhu, F. , Liu, H. , Hong, Y. and Liang, X. (2013) Transcriptome profiling of peanut (Arachis hypogaea) gynophores in gravitropic response. Funct. Plant Biol. 40, 1249–1260. doi: 10.1071/FP13075. [DOI] [PubMed] [Google Scholar]
- Lister, R. , O'Malley, R.C. , Tonti‐Filippini, J. , Gregory, B.D. , Berry, C.C. , Millar, A.H. and Ecker, J.R. (2008) Highly integrated single‐base resolution maps of the epigenome in Arabidopsis. Cell, 133, 523–536. [DOI] [PMC free article] [PubMed] [Google Scholar]
- Lu, T. , Lu, G. , Fan, D. , Zhu, C. , Li, W. , Zhao, Q. , Feng, Q. et al. (2010) Function annotation of the rice transcriptome at single‐nucleotide resolution by RNA‐seq. Genome Res. 20, 1238–1249. [DOI] [PMC free article] [PubMed] [Google Scholar]
- Luo, M. , Dang, P. , Guo, B.Z. , He, G. , Holbrook, C.C. , Bausher, M.G. and Lee, R.D. (2005) Generation of expressed sequence tags (ESTs) for gene discovery and marker development in cultivated peanut. Crop Sci., 45, 346–353. [Google Scholar]
- Maere, S. , Heymans, K. and Kuiper, M. (2005) BiNGO: a Cytoscape plugin to assess overrepresentation of gene ontology categories in biological networks. Bioinformatics, 21, 3448–3449. [DOI] [PubMed] [Google Scholar]
- Martin, J.A. and Wang, Z. (2011) Next‐generation transcriptome assembly. Nat. Rev. Genet. 12, 671–682. [DOI] [PubMed] [Google Scholar]
- Morita, M.T. , Sakaguchi, K. , Kiyose, S. , Taira, K. , Kato, T. , Nakamura, M. and Tasaka, M. (2006) A C2H2‐type zinc finger protein, SGR5, is involved in early events of gravitropism in Arabidopsis inflorescence stems. Plant J. 47, 619–628. [DOI] [PubMed] [Google Scholar]
- Mortazavi, A. , Williams, B.A. , McCue, K. , Schaeffer, L. and Wold, B. (2008) Mapping and quantifying mammalian transcriptomes by RNA‐Seq. Nat. Methods, 5, 621–628. [DOI] [PubMed] [Google Scholar]
- Nicol, F. , His, I. , Jauneau, A. , Vernhettes, S. , Canut, H. and Hofte, H. (1998) A plasma membrane‐bound putative endo‐1,4‐beta‐D‐glucanase is required for normal wall assembly and cell elongation in Arabidopsis. EMBO J. 17, 5563–5576. [DOI] [PMC free article] [PubMed] [Google Scholar]
- Noh, B. , Bandyopadhyay, A. , Peer, W.A. , Spalding, E.P. and Murphy, A.S. (2003) Enhanced gravi‐ and phototropism in plant mdr mutants mislocalizing the auxin efflux protein PIN1. Nature, 423, 999–1002. [DOI] [PubMed] [Google Scholar]
- Ono, Y. (1979) Flowering and fruiting of peanut plants. Jap. Agric. Res. Quart. 13, 226–229. [Google Scholar]
- Payton, P. , Kottapalli, K.R. , Rowland, D. , Faircloth, W. , Guo, B. , Burow, M. , Puppala, N. et al. (2009) Gene expression profiling in peanut using high density oligonucleotide microarrays. BMC Genom., 10, 265. [DOI] [PMC free article] [PubMed] [Google Scholar]
- Sahoo, D. , Dill, D.L. , Tibshirani, R. and Plevritis, S.K. (2007) Extracting binary signals from microarray time‐course data. Nucleic Acids Res. 35, 3705–3712. [DOI] [PMC free article] [PubMed] [Google Scholar]
- Scanlon, M. and Timmermans, M. (2013) Growth and development: from genes to networks and a mechanistic understanding of plant development. Curr. Opin. Plant Biol. 16, 1–4. [DOI] [PubMed] [Google Scholar]
- Sedbrook, J.C. , Chen, R. and Masson, P.H. (1999) ARG1 (altered response to gravity) encodes a DnaJ‐like protein that potentially interacts with the cytoskeleton. Proc. Natl. Acad. Sci. USA, 96, 1140–1145. [DOI] [PMC free article] [PubMed] [Google Scholar]
- Setia, R.C. , Setia, N. and Malik, C.P. (1987) The pod wall structure and function in relation to seed development in some legumes. Phyton, 27, 205–220. [Google Scholar]
- Shlamovitz, N. , Ziv, M. and Zamski, E. (1995) Light, dark and growth regulator involvement in groundnut (Arachis hypogaea L.) pod development. Plant Growth Regul. 16, 37–42. [Google Scholar]
- Silady, R.A. , Kato, T. , Lukowitz, W. , Sieber, P. , Tasaka, M. and Somerville, C.R. (2004) The gravitropism defective 2 mutants of Arabidopsis are deficient in a protein implicated in endocytosis in Caenorhabditis elegans. Plant Physiol. 136, 3095–3103; discussion 3002. [DOI] [PMC free article] [PubMed] [Google Scholar]
- Singh, A.K. , Mehan, V.K. and Nigam, S.N. (1997) Sources of resistance to groundnut fungi and bacterial diseases: an update and appraisal. Information Bulletin No 50 International Crops Research Institute for the Semi‐Arid Tropics, Patancheru, Andhra Pradesh, India.
- Smith, B.W. (1950) Arachis hypogaea. Aerial flower and subterranean fruit. Am. J. Bot. 37, 802–815. [Google Scholar]
- Starr, J.L. and Simpson, C.E. (2006) Improving the utility of nematode resistance in groundnut. Commun. Agric. Appl. Biol. Sci., 71 , 647–651. [PubMed] [Google Scholar]
- Su, G. , Morris, J.H. , Demchak, B. and Bader, G.D. (2014) Biological network exploration with cytoscape 3. Curr. Protoc. Bioinformatics, 47, 8.13.1–8.13.24. [DOI] [PMC free article] [PubMed] [Google Scholar]
- Swarup, R. , Kargul, J. , Marchant, A. , Zadik, D. , Rahman, A. , Mills, R. , Yemm, A. et al. (2004) Structure‐function analysis of the presumptive Arabidopsis auxin permease AUX1. Plant Cell, 16, 3069–3083. [DOI] [PMC free article] [PubMed] [Google Scholar]
- Tellmann, G. and Geulen, O. (2006) LightCycler 480 Real‐Time PCR system: Innovative solutions for relative quantification. Biochemica, 4, 16–17. [Google Scholar]
- Thorne, J.H. (1979) Assimilate redistribution from soybean pod walls during seed development. Agron. J. 71, 812–816. [Google Scholar]
- Trapnell, C. , Pachter, L. and Salzberg, S.L. (2009) TopHat: discovering splice junctions with RNA‐Seq. Bioinformatics, 25, 1105–1111. [DOI] [PMC free article] [PubMed] [Google Scholar]
- Trapnell, C. , Williams, B.A. , Pertea, G. , Mortazavi, A. , Kwan, G. , van Baren, M.J. , Salzberg, S.L. et al. (2010) Transcript assembly and quantification by RNA‐Seq reveals unannotated transcripts and isoform switching during cell differentiation. Nat. Biotechnol. 28, 511–515. [DOI] [PMC free article] [PubMed] [Google Scholar]
- Varaprasad, P.V. , Craufurd, D.Q. and Summerfield, R.J. (1999) Sensitivity of peanut to timing of heat stress during reproductive development. Crop Sci. 539, 1352–1357. [Google Scholar]
- Varaprasad, P.V. , Craufurd, D.Q. and Summerfield, R.J. (2000) Effect of high air and soil temperature on dry matter production, pod yield and yield components of groundnut. Plant Soil, 222, 231–239. [Google Scholar]
- Wang, H.L. and Grusak, M.A. (2005) Structure and development of Medicago truncatula pod wall and seed coat. Ann. Bot. 95, 737–747. [DOI] [PMC free article] [PubMed] [Google Scholar]
- Wang, Z. , Gerstein, M. and Snyder, M. (2009) RNA‐Seq: a revolutionary tool for transcriptomics. Nat. Rev. Genet. 10, 57–63. [DOI] [PMC free article] [PubMed] [Google Scholar]
- Wang, L. , Feng, Z. , Wang, X. and Zhang, X. (2010) DEGseq: an R package for identifying differentially expressed genes from RNA‐seq data. Bioinformatics, 26, 136–138. [DOI] [PubMed] [Google Scholar]
- Wang, T. , Chen, X. , Li, H. , Liu, H. , Hong, Y. , Yang, Q. , Chi, X. et al. (2012) Transcriptome identification of the resistance‐associated genes (RAGs) to Aspergillus flavus infection in pre‐harvested peanut (Arachis hypogaea). Funct. Plant Biol. 40, 292–303. [DOI] [PubMed] [Google Scholar]
- Withers, J.C. , Shipp, M.J. , Rupasinghe, S.G. , Sukumar, P. , Schuler, M.A. , Muday, G.K. and Wyatt, S.E. (2013) Gravity Persistent Signal 1 (GPS1) reveals novel cytochrome P450s involved in gravitropism. Am. J. Bot. 100, 183–193. [DOI] [PubMed] [Google Scholar]
- Xia, H. , Zhao, C. , Hou, L. , Li, A. , Zhao, S. , Bi, Y. , An, J. et al. (2013) Transcriptome profiling of peanut gynophores revealed global reprogramming of gene expression during early pod development in darkness. BMC Genom. 14, 517. [DOI] [PMC free article] [PubMed] [Google Scholar]
- Yanai, I. , Benjamin, H. , Shmoish, M. , Chalifa‐Caspi, V. , Shklar, M. , Ophir, R. , Bar‐Even, A. et al. (2005) Genome‐wide midrange transcription profiles reveal expression level relationships in human tissue specification. Bioinformatics, 21, 650–659. [DOI] [PubMed] [Google Scholar]
- Yano, D. , Sato, M. , Saito, C. , Sato, M.H. , Morita, M.T. and Tasaka, M. (2003) A SNARE complex containing SGR3/AtVAM3 and ZIG/VTI11 in gravity‐sensing cells is important for Arabidopsis shoot gravitropism. Proc. Natl. Acad. Sci. USA, 100, 8589–8594. [DOI] [PMC free article] [PubMed] [Google Scholar]
- Yin, D. , Wang, Y. , Zhang, X. , Li, H. , Lu, X. , Zhang, J. , Zhang, W. et al. (2013) De novo assembly of the peanut (Arachis hypogaea L.) seed transcriptome revealed candidate unigenes for oil accumulation pathways. PLoS ONE, 8, e73767. [DOI] [PMC free article] [PubMed] [Google Scholar]
- Young, L.S. , Harrison, B.R. , Narayana Murthy, U.M. , Moffatt, B.A. , Gilroy, S. and Masson, P.H. (2006) Adenosine kinase modulates root gravitropism and cap morphogenesis in Arabidopsis. Plant Physiol. 142, 564–573. [DOI] [PMC free article] [PubMed] [Google Scholar]
- Yuan, S. , Wu, Y. and Cosgrove, D.J. (2001) A fungal endoglucanase with plant cell wall extension activity. Plant Physiol. 127, 324–333. [DOI] [PMC free article] [PubMed] [Google Scholar]
- Zhang, J. , Liang, S. , Duan, J. , Wang, J. , Chen, S. , Cheng, Z. , Zhang, Q. et al. (2012) De novo assembly and characterisation of the transcriptome during seed development, and generation of genic‐SSR markers in Peanut (Arachis hypogaea L.). BMC Genom., 13, 90. [DOI] [PMC free article] [PubMed] [Google Scholar]
Associated Data
This section collects any data citations, data availability statements, or supplementary materials included in this article.
Supplementary Materials
Figure S1 Correlation of gene expression levels between samples using RNA‐seq data.
Figure S2 Differentially expressed genes (DEGs) between samples pairwise.
Figure S3 Validation of the RNA‐seq results by qRT‐PCR.
Figure S4 Cross sections of pod wall with 1‐5 mm diameter.
Figure S5 Enrichment analysis of gene ontology (GO) categories assigned to one‐step‐up transcripts using BiNGO.
Figure S6 Enrichment analysis of gene ontology (GO) categories belonging to Biological Process assigned to one‐step‐down transcripts using BiNGO.
Figure S7 Enrichment analysis of gene ontology (GO) categories belonging to Biological Process assigned to two‐step‐up‐down transcripts using BiNGO.
Figure S8 Enrichment analysis of gene ontology (GO) categories belonging to Biological Process assigned to two‐step‐down‐up transcripts using BiNGO.
Table S1 Summary of pod wall samples during pod development in peanut.
Table S2 Information of library construction for high‐throughput sequencing.
Table S3 Raw and filtered reads of paired‐end libraries.
Table S4 Summary of RNA‐seq mapping results.
Table S5 Numbers of differentially expressed genes (DEGs) between pairwise samples.
Table S6 Temporal up‐ and down‐regulated genes identified using StepMiner.
Table S7 Two‐step‐up‐down genes showing lower expression at P0‐P1 and higher expression during P2SH‐P6SH and then lower expression during P7SH‐P10SH.
Table S8 τ values for stage‐specific genes.
Table S9 Gravitropism‐related genes identified in previous studies in Arabidopsis and their homologs in the Arachis duranensis genome and in the peanut pod transcriptome.