

Summary
Brassica napus is one of the most important oil crops in the world, and stem rot caused by the fungus Sclerotinia sclerotiorum results in major losses in yield and quality. To elucidate resistance genes and pathogenesis‐related genes, genome‐wide association analysis of 347 accessions was performed using the Illumina 60K Brassica SNP (single nucleotide polymorphism) array. In addition, the detached stem inoculation assay was used to select five highly resistant (R) and susceptible (S) B. napus lines, 48 h postinoculation with S. sclerotiorum for transcriptome sequencing. We identified 17 significant associations for stem resistance on chromosomes A8 and C6, five of which were on A8 and 12 on C6. The SNPs identified on A8 were located in a 409‐kb haplotype block, and those on C6 were consistent with previous QTL mapping efforts. Transcriptome analysis suggested that S. sclerotiorum infection activates the immune system, sulphur metabolism, especially glutathione (GSH) and glucosinolates in both R and S genotypes. Genes found to be specific to the R genotype related to the jasmonic acid pathway, lignin biosynthesis, defence response, signal transduction and encoding transcription factors. Twenty‐four genes were identified in both the SNP‐trait association and transcriptome sequencing analyses, including a tau class glutathione S‐transferase ( GSTU ) gene cluster. This study provides useful insight into the molecular mechanisms underlying the plant's response to S. sclerotiorum.
Keywords: association mapping, differential expression, Sclerotinia sclerotiorum, Brassica napus
Introduction
Sclerotinia sclerotiorum (Lib.) de Bary is a necrotrophic pathogen that has no specific host and infects more than 400 different plant species, including sunflower (Hellianthus annuus), chickpea (Cicer arietinum), soybean (Glycine max) and rapeseed (Brassica napus) (Bolton et al., 2006). Brassica napus is one of the most economically important oil crops, and stem rot, caused by S. sclerotiorum, results in major losses in yield and quality (Purdy, 1979; Sharma et al., 2015).
Ascospores of S. sclerotiorum infect plants through senescing, old or injured plant tissue, lower stems and flower petals (Garg et al., 2010b). The mycelium then spreads throughout the stem and leaves (Jamaux et al., 1995) producing enzymes that degrade keratin and cell wall components and leading to a build‐up in toxic substances, such as oxalic acid (Bolton et al., 2006). Infection causes pale or dark lesions followed by white patches of fungus, which eventually leads to stem rot and the collapse of the plant.
When a plant and pathogen interact, a number of plant genes are involved in eliciting a response. Resistance (R) genes detect the pathogen attack and activate a signal transduction pathway that in turn triggers the transcription of a large number of defence response (DR) genes (Gururani et al., 2012; Singh et al., 2015). The expression patterns of defence genes in B. napus have mainly been studied using B. napus or Arabidopsis microarrays to compare resistant versus susceptible B. napus cultivars. Gene differential expression levels were found to peak 48 h postinoculation, and differentially expressed genes included those involved in oxidative burst, molecular transport, signal transduction, cell maintenance and development; as well as biosynthesis genes for jasmonic acid, ethylene, auxin, glucosinolate and phenylpropanoid metabolism (Yang et al., 2007; Zhao et al., 2007, 2009). In addition, Garg et al. (2013) using protein profiling identified a number of B. napus proteins related to resistance to S. sclerotiorum, such as pathogenesis‐related proteins and proteins involved in primary metabolism and ethylene biosynthesis. However, to date no study has investigated the defence mechanism of B. napus using an RNA sequencing (RNA‐Seq) approach, which is more sensitive and accurate, offers higher throughput and is more cost‐effective than microarray analysis. RNA‐Seq has emerged as a powerful tool to examine differences in global gene expression.
Resistance to S. sclerotiorum showed quantitative inheritance with additive effects and medium heritability (Fusari et al., 2012). Early studies looking for resistance genes in B. napus were conducted through QTL mapping, and some pathogen‐resistant QTLs were identified on chromosomes A1, A2, A3, A5, A6, A8, A9, C2, C4, C6, C7, C8 and C9 (Behla et al., 2009; Wei et al., 2014; Wu et al., 2013; Yin et al., 2010; Zhao and Meng, 2003; Zhao et al., 2006). However, due to the lack of common markers, overlapping QTLs were difficult to identify. With the recent release of the B. napus genome sequence (Chalhoub, 2014), the physical positions occupied by QTLs can be identified by aligning the QTL primers with the B. napus genome. Li et al. (2015) integrated and compared QTLs for resistance to S. sclerotiorum from previous mapping efforts, and conserved QTLs were identified on chromosomes A9 (22.5–27.5 Mb) and C6 (29.5–36.1 Mb). Nevertheless, QTL mapping based on a biparental population is limited due to fewer recombination events.
With the development of high‐throughput sequencing technology, genome‐wide association study (GWAS) based on linkage disequilibrium (LD) has emerged as the main tool for gene mapping in plants. GWAS can take advantage of the phenotypic variation and historical recombination in natural populations without the need to construct a mapping population (Nordborg and Weigel, 2008). In recent years, GWAS has been widely used to identify genes involved in complex traits in B. napus. Cai et al. (2014) identified 43 loci related to yield traits using 451 short sequence repeats (SSR) and 740 amplified fragment length polymorphism (AFLP) markers in192 B. napus inbred lines using the Q + K model. Li et al. (2014a) found two loci associated with erucic acid content, four SNP clusters associated with glucosinolate content and two loci associated with seed weight using the Illumina 60 K Brassica SNP microarray and 472 B. napus accessions through GWAS. Lu et al. (2014) identified 26 genes related to glucosinolate metabolism using a GWAS method termed ‘associative transcriptomics’ analysis. In addition, GWAS has been used to identify resistance genes in crops infected with stem rust (Yu et al., 2014; Zhang et al., 2014a), tan spot in wheat (Triticum aestivum; (Kollers et al., 2014), southern leaf blight (Kump et al., 2011), head smut in maize (Zea mays; (Wang et al., 2012a), blast disease in rice (Oryza sativa; (Wang et al., 2014a) and stem canker in B. napus (Fopa Fomeju et al., 2014). However, there are no reports of GWAS being used to study resistance to S. sclerotiorum in B. napus.
In this study, we carried out a GWAS of S. sclerotiorum resistance in the stems of 347 B. napus accessions genotyped with the 60 K Illumina Brassica SNP microarray and identified significant associated SNP loci. In addition, we performed transcriptome sequencing of resistant (R) and susceptible (S) accessions inoculated with S. sclerotiorum. Defence genes, expressed in both accessions, and those specific to the R accessions only were identified. Among the genes identified in both the GWAS and transcriptome analysis, a tau class glutathione S‐transferase (GSTU) gene cluster was included, which was verified by quantitative real‐time PCR (qRT‐PCR). Our results reveal candidate genes involved in stem rot resistance and provide an insight into the genetic mechanisms of resistance to S. sclerotiorum in B. napus.
Results
Phenotypic variation
We evaluated stem resistance to S. sclerotiorum in 347 B. napus accessions during 2013 and 2014, with two replications performed each year. Extensive phenotypic variations were observed in relative susceptibility (Table 1). Relative susceptibility was calculated according to the formula: the lesion length on the tested accession divided by the control, ‘Zhongshuang 9’. The relative susceptibility, stem resistance assessment (RA), ranged from 0.58 to 1.36, with an average of 0.918, in 2013 and from 0.59 to 1.44, with an average of 0.917, in 2014. ANOVA of stem RA revealed significant differences among the genotypes, but no significant differences between the data collected in the two years (F = 0.02, P = 0.88) (Table S3). Stem resistance assessment in B. napus showed continuous variation and approximated a normal distribution (Figure 1), suggesting that resistance was controlled by multiple genes. The broad sense heritability of stem resistance was 84%, which is consistent with the results of Mei et al. (2013) (78%).
Table 1.
Phenotypic variation in Brassica napus
Standard deviation.
Coefficient of variation.
Figure 1.
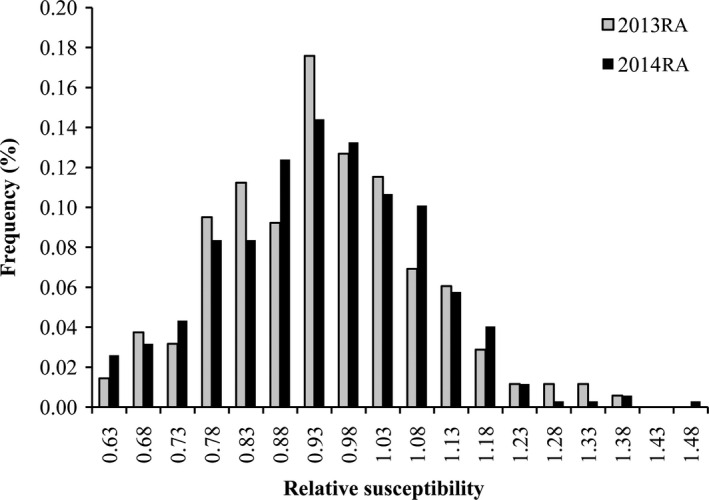
Frequency distribution of stem resistance in Brassica napus. 2013RA and 2014RA refers to the stem resistance assessment (RA) evaluated in 2013 and 2014, respectively. The frequency represents the proportion of accessions.
Relative kinship
SNPs from the 60 K Illumina Brassica SNP array were used as queries for BLASTn searches against the B. napus genome; 10 112 of the 52 157 SNPs were not mapped and were excluded. An additional 11 113 SNPs (with call frequencies of <90% or minor allele frequencies (MAFs) of <0.05) were removed. Therefore, 30 932 polymorphic SNPs were used for further analysis (Table S4).
We evaluated the relative kinships among the 347 accessions using SPAGeDi, and found that 80.9% of the kinship coefficients between lines were <0.05 and 55% were equal to 0 (Figure S1). Furthermore, 14.6% of the coefficients were between 0.05 and 0.15. Therefore, the kinship analysis results show that the majority of the accessions have a null or weak relationship with the other accessions in this population of B. napus.
Genome‐wide association analysis
Trait‐SNP association analysis was performed using the P+K model (Price et al., 2006). The QQ plot displayed in Figure 2a shows that the model could be used to identify association signals. A total of 17 significant associations were detected on A8 and C6 at P < 3.23 × 10⁻⁵ (P = 1/30932, −log10 P = 4.49), with a false discovery rate (FDR) of 1.2% and 0.8% (Figure 2b). The location and MAF of these 17 loci are listed in Table 2. In addition, one SNP was found on the C3‐random chromosome, but this was not analysed further.
Figure 2.
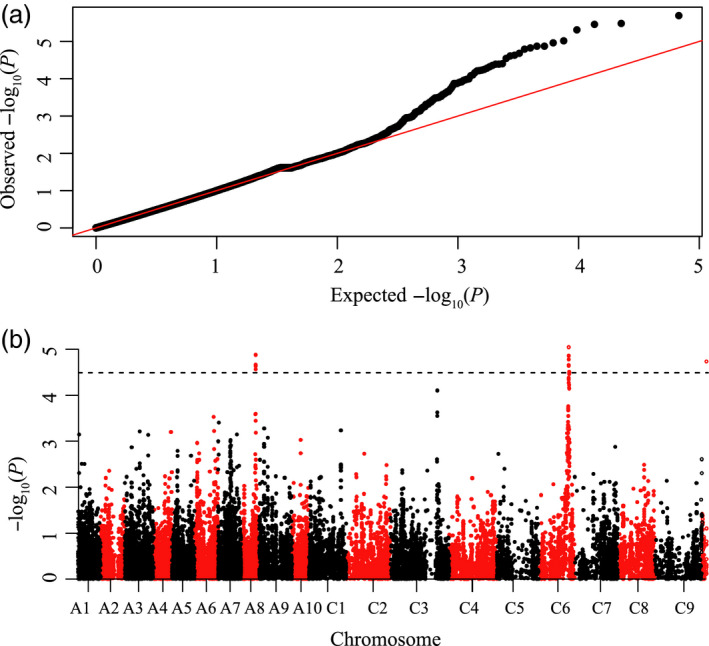
Manhatttan and quantile–quantile plots resulting from the GWAS results for stem resistance in Brassica napus. (a) Quantile–quantile plot for stem resistance; (b) Manhattan plot for stem resistance. The dashed horizontal line indicates the Bonferroni‐adjusted significance threshold (3.23 × 10⁻⁵).
Table 2.
Markers with significant association for resistance to Sclerotinia sclerotiorum
| Chromosome | Position | SNP Allele | MAF | P value |
|---|---|---|---|---|
| A8 | 15094063 | T/G | 0.485 | 1.32E‐05 |
| A8 | 15095383 | A/G | 0.499 | 2.74E‐05 |
| A8 | 15096961 | C/T | 0.477 | 2.15E‐05 |
| A8 | 15101546 | A/G | 0.46 | 2.34E‐05 |
| A8 | 15101600 | A/G | 0.465 | 2.28E‐05 |
| C3_random | 4568807 | T/C | 0.276 | 1.83E‐05 |
| C6 | 30784152 | T/G | 0.357 | 2.20E‐05 |
| C6 | 30791903 | A/G | 0.388 | 5.98E‐06 |
| C6 | 30811671 | A/G | 0.377 | 8.93E‐06 |
| C6 | 30812107 | A/C | 0.371 | 9.06E‐06 |
| C6 | 30812416 | T/C | 0.38 | 8.93E‐06 |
| C6 | 30812429 | A/G | 0.385 | 9.06E‐06 |
| C6 | 30813043 | A/G | 0.393 | 9.08E‐06 |
| C6 | 30813372 | A/G | 0.356 | 1.38E‐05 |
| C6 | 30813377 | T/C | 0.354 | 2.30E‐05 |
| C6 | 30813548 | T/C | 0.364 | 1.66E‐05 |
| C6 | 30815877 | A/G | 0.38 | 8.93E‐06 |
| C6 | 31344734 | T/C | 0.392 | 3.11E‐05 |
Haplotype block structures were investigated for chromosomes A8 and C6. A total of 31 and 13 haplotype blocks were found on A8 and C6, respectively. Significant SNPs on A8 were located in a haplotype block of 409 kb (from 15.01 Mb to 15.42 Mb; Figure 3). For C6, the region of significant association ranged from 30.78 Mb to 31.34 Mb, which was consistent with previous QTL mapping results (Figure 4) (Wu et al., 2013; Zhao et al., 2006).
Figure 3.
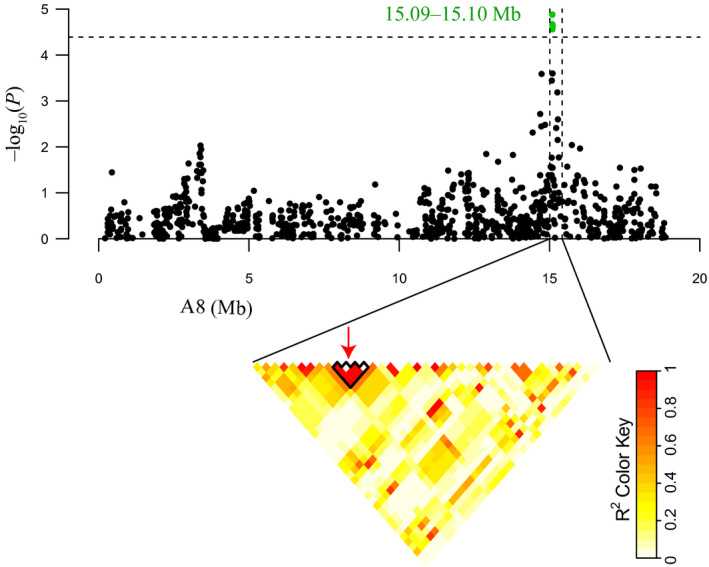
Genomic location of SNP loci associated with stem resistance (15.09–15.10 Mb) and pairwise LD estimates in A8 haplotype block (15.01–15.42 Mb). The red arrows denote the significantly associated SNPs located in the haplotype block.
Figure 4.
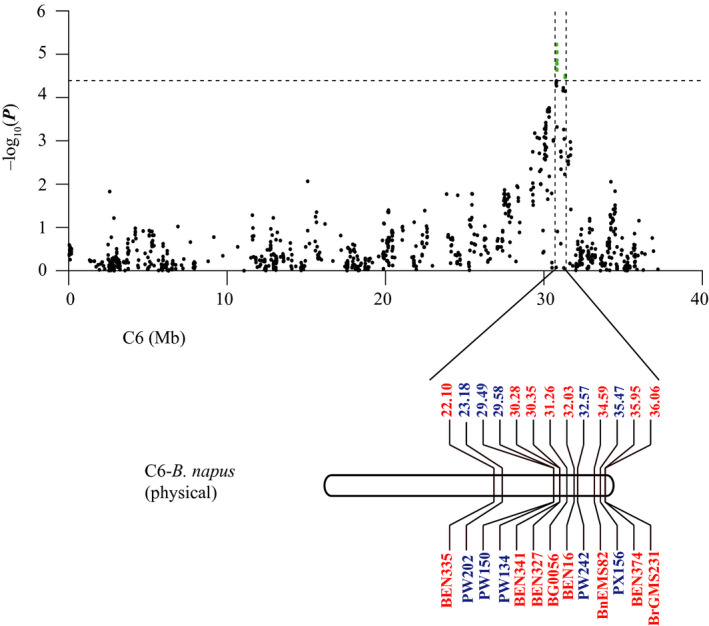
Comparison of the GWAS results with those of previous QTL mapping reported in Zhao et al. (2006) and Wu et al. (2013). The markers that lie within the confidence interval of the Sclerotinia stem resistance QTL are in blue for Zhao et al. (2006) and red for Wu et al. (2013).
Prediction of stem resistance
The ability to predict stem resistance using genome‐wide markers was assessed. The predictive ability represented the correlation between the predicted and measured field data. We used 20–90% of the training population and all of the 30 932 SNP markers, and found that the predictive ability and standard deviation increased with the size of the training population. Higher predictive ability and lower standard deviation were optimum; therefore, 60% of the training population was selected based on both predictive abilities and standard deviation (Table S5).
When using 60% of the training population (145 accessions), and all SNP markers for the prediction, the predictive ability was only 0.27, indicating that these makers were not suitable for stem resistance prediction. In addition, 300 and 1200 randomly selected markers were also used and the predictive ability of both sets of markers was low (0.17) (Table S5, Figure 5). Markers significantly associated with the trait could be detected in GWAS by setting a certain P value, such as P < 0.001, P < 0.01 and P < 0.05 (Zhang et al., 2014b). We then selected significant association markers identified in GWAS with a certain threshold for the prediction, including markers with P < 0.001 (69 SNPs), P < 0.01 (288), and P < 0.05 (1203), and the predictive abilities were 0.58, 0.77 and 0.80, respectively. Therefore, loci detected using GWAS improved the predictive ability of stem resistance.
Figure 5.
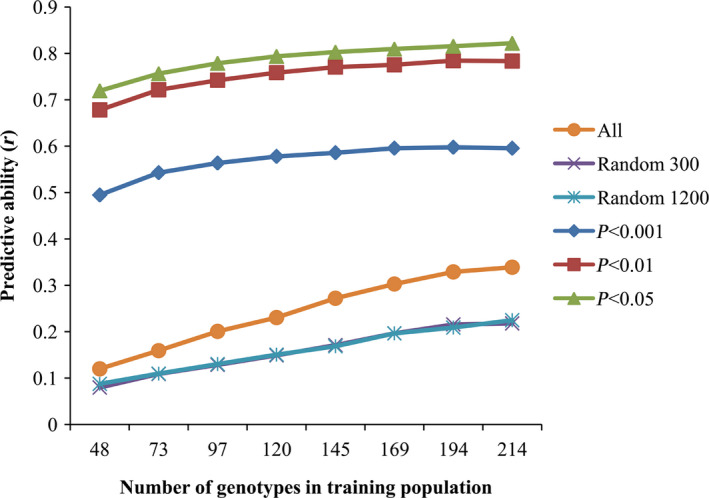
Predictive abilities with different training populations and SNP markers. ‘All’, means all of the 30932 SNP markers; ‘Random 300’, randomly selected 300 markers; ‘Random 1200’, randomly selected 1200 markers; ‘P < 0.001, P < 0.01, P < 0.05’, significant association markers identified in GWAS with the certain P value, P < 0.001, P < 0.01 and P < 0.05, respectively.
Transcriptome sequencing
RNA from five R and five S genotypes was pooled 48 h postinoculation to generate R48 and S48, while mock‐inoculated B. napus was dubbed R0 and S0. A total of 22.0, 20.2, 22.1 and 19.2 million raw sequence reads were generated from four libraries of R0, R48, S0 and S48 (Table S6). After the removal of low‐quality reads and adaptor sequences, 18.4, 16.9, 18.6 and 16.0 million clean reads were obtained, respectively. Eighty per cent of the reads were successfully mapped to the reference genome, B. napus, in which unique reads that only aligned with one loci of the genome accounted for about 89%.
A total of 6,821 significant differentially expressed genes (DEGs) were identified in the two genotypes based on the criterion, ¦log2(FPKM48/FPKM0)¦≥2 and FDR < 0.01. Of the 5384 DEGs in the R genotype, 2356 (43.8%) were up‐regulated and 3028 (56.2%) were down‐regulated. A total of 5386 differentially expressed genes were identified in the S genotype, 41.4% (2229) of which were up‐regulated and 58.6% (3157) of which were down‐regulated (Figure S2a). In addition, for the up‐regulated genes, 1784 were common to both genotypes (R and S), 572 genes were specific to the R genotype only and 445 were specific to the S genotype. For the down‐regulated genes, 2,166 were commonly down‐regulated (both R and S), 862 were specific to R and 991 specific to the S genotype (Figure S2b). Finally, hierarchical cluster analysis was performed based on the expression levels of the DEGs (Figure S2c). The R and S genotypes had similar expression patterns, but the main differences in gene expression were quantitative.
Transcription factors (TFs) play an important role in plant resistance response (Seo and Choi, 2015). In this study, 495 (7.3%) genes encoding TFs were identified as being differentially expressed in the two genotypes, of which 84 were differentially expressed only in the R genotype, 133 only in the S genotype and 278 in both genotypes. These genes were divided into 36 families, including ERF (64), MYB (63), NAC (61), bHLH (55), WRKY (48) and C 2 H 2 (37) (Tables 3 and S7). Nearly all ERF and WRKY genes were up‐regulated, while 78% of the bHLH genes were down‐regulated, and MYB, NAC and C 2 H 2 genes were up‐ and down‐regulated to similar extents. As numerous ERF and WRKY genes were found to be mostly up‐regulated, our results indicate that these two families play a role in the response of B. napus to S. sclerotiorum.
Table 3.
Differentially expressed genes belonging to transcription factor families
| TF family | Total number | Change | Common | R specific | S specific |
|---|---|---|---|---|---|
| AP2 | 6 | Up | 2 | 0 | 0 |
| Down | 0 | 3 | 1 | ||
| ARF | 6 | Up | 0 | 0 | 0 |
| Down | 4 | 0 | 2 | ||
| ARR‐B | 5 | Up | 0 | 0 | 0 |
| Down | 1 | 3 | 1 | ||
| B3 | 3 | Up | 0 | 0 | 0 |
| Down | 0 | 1 | 2 | ||
| BES1 | 1 | Up | 1 | 0 | 0 |
| Down | 0 | 0 | 0 | ||
| bHLH | 55 | Up | 4 | 4 | 4 |
| Down | 20 | 11 | 12 | ||
| bZIP | 13 | Up | 1 | 1 | 1 |
| Down | 6 | 0 | 4 | ||
| C2H2 | 37 | Up | 15 | 1 | 3 |
| Down | 6 | 6 | 6 | ||
| C3H | 7 | Up | 0 | 0 | 0 |
| Down | 4 | 1 | 2 | ||
| CO‐like | 6 | Up | 0 | 0 | 0 |
| Down | 2 | 1 | 3 | ||
| CPP | 1 | Up | 0 | 1 | 0 |
| Down | 0 | 0 | 0 | ||
| DBB | 6 | Up | 0 | 0 | 0 |
| Down | 3 | 1 | 2 | ||
| Dof | 10 | Up | 3 | 0 | 0 |
| Down | 3 | 1 | 3 | ||
| ERF | 64 | Up | 37 | 7 | 15 |
| Down | 1 | 1 | 3 | ||
| G2‐like | 8 | Up | 3 | 0 | 0 |
| Down | 2 | 1 | 2 | ||
| GATA | 7 | Up | 0 | 0 | 2 |
| Down | 2 | 0 | 3 | ||
| GeBP | 1 | Up | 0 | 0 | 0 |
| Down | 1 | 0 | 0 | ||
| GRAS | 8 | Up | 0 | 0 | 1 |
| Down | 2 | 1 | 4 | ||
| HD‐ZIP | 18 | Up | 2 | 0 | 0 |
| Down | 10 | 3 | 3 | ||
| HSF | 8 | Up | 5 | 0 | 0 |
| Down | 1 | 0 | 2 | ||
| LBD | 3 | Up | 1 | 0 | 0 |
| Down | 1 | 0 | 1 | ||
| MIKC | 6 | Up | 1 | 0 | 2 |
| Down | 1 | 0 | 2 | ||
| MYB | 63 | Up | 18 | 5 | 6 |
| Down | 22 | 4 | 8 | ||
| MYB_related | 10 | Up | 0 | 1 | 0 |
| Down | 4 | 1 | 4 | ||
| NAC | 61 | Up | 23 | 5 | 11 |
| Down | 13 | 6 | 3 | ||
| NF‐YB | 1 | Up | 0 | 0 | 0 |
| Down | 1 | 0 | 0 | ||
| Nin‐like | 1 | Up | 0 | 0 | 0 |
| Down | 0 | 0 | 1 | ||
| RAV | 1 | Up | 0 | 0 | 1 |
| Down | 0 | 0 | 0 | ||
| SBP | 5 | Up | 0 | 0 | 0 |
| Down | 2 | 2 | 1 | ||
| SRS | 2 | Up | 0 | 0 | 0 |
| Down | 0 | 1 | 1 | ||
| TALE | 10 | Up | 0 | 0 | 0 |
| Down | 6 | 3 | 1 | ||
| TCP | 1 | Up | 0 | 0 | 1 |
| Down | 0 | 0 | 0 | ||
| Trihelix | 7 | Up | 2 | 1 | 3 |
| Down | 1 | 0 | 0 | ||
| WOX | 4 | Up | 2 | 0 | 0 |
| Down | 2 | 0 | 0 | ||
| WRKY | 48 | Up | 31 | 3 | 2 |
| Down | 4 | 1 | 7 | ||
| ZF‐HD | 2 | Up | 0 | 0 | 0 |
| Down | 1 | 1 | 0 |
Mitogen‐activated protein kinase (MAPK) is a type of serine/threonine protein kinase, and the MAPK cascade signalling pathway is important for plant defence response (Zhang and Klessig, 2001). In our study, genes encoding for the common MAPK cascade signalling pathway MAPKKK19‐MKK9‐MPK5 (Sun et al., 2014) were up‐regulated in both genotypes, suggesting that this pathway is associated with response to S. sclerotiorum in B. napus.
Functional classification of common and specifically expressed genes
To monitor the gene expression pattern after infection, Gene Ontology (GO) enrichment analysis of commonly expressed genes in both genotypes (R and S) was conducted (Figure S3). The analysis showed that genes involved in metabolism, cellular processes and defence response were up‐ or down‐regulated after infection with S. sclerotiorum in B. napus. Most genes located in organelles, mainly the chloroplast, were down‐regulated in both genotypes, suggesting that photosynthetic damage was occurring during infection. In addition, KEGG pathway analysis of genes that were differentially expressed in both genotypes (common genes) was performed (Table S8). The KEGG analysis showed that after B. napus was infected with S. sclerotiorum, photosynthesis, glyoxalic acid and carbon metabolism were suppressed, while the biosynthesis of secondary metabolites such as sulphur metabolism (especially GSH and glucosinolates) and 2‐oxocarboxylic acid metabolism was activated.
To decipher the resistance mechanism of B. napus, we functionally classified and determined the metabolic pathways of 1434 genes differentially expressed only in the R genotype (Figure S2b) using MapMan. Genes involved in the jasmonic acid (JA) pathway, lignin biosynthesis, signal transduction, defence response and encoding transcription factors were identified and divided into groups. Group one contains specific genes related to the JA pathway and lignin biosynthesis (Table S9).
The second group contains genes involved in signal transduction including MAPK cascade signalling pathway, calcium signalling and G protein‐coupled receptors. The 12 specific genes involved in calcium signalling and 5 genes encoding for G protein‐coupled receptors were all induced. Genes involved in the signalling module MEKK1‐BnaMKK4‐BnaMPK3‐BnaWRKY26 (Liang et al., 2013) were all up‐regulated in the R genotype. Another gene family, the MLO genes, MLO1 and MLO11, was down‐regulated. Previous research shows that loss‐of‐function of MLO results in broad‐spectrum resistance to powdery mildew in Hordeum vulgare (barley) (Piffanelli et al., 2004).
The third group includes a total of 15 genes involved in defence response, such as chitinase genes (CHI and CHIB), BGLU16, seven disease‐resistant protein genes and five receptor protein genes (RLP6, 32, 41, 54 and 56).
Group four contains genes encoding transcription factors. A total of 82 TFs were found in the R genotype, of which 29 were up‐regulated in response to inoculation, including seven ERFs, five MYBs (two MYB108s, two MYB37s and MYB84), five NACs, four bHLHs and three WRKYs (two WRKY61s and WRKY8) (Table S9).
Combined analysis of GWAS and transcriptome sequencing
The candidate gene regions on chromosomes A8 and C6 as determined by GWAS analysis were 15.01–15.42 Mb and 30.78–31.34 Mb, respectively. When we combined these results with those of transcriptome sequencing analysis, 21 genes that were differentially expressed in the R or S genotype were found in this interval. Eight of these genes were on A8 and 13 were on C6, including four genes with unknown function (Figure 6, Table 4). In addition, a GSTU gene cluster, BnaC06g31020D (W22), BnaC06g31030D (W23) and BnaC06g31040D (W24), that occurred 330 kb downstream of the peak SNP on C6 was up‐regulated about 64‐fold. Both BnaC06g31020D and BnaC06g31030D showed homology with GSTU12 from Arabidopsis thaliana, and BnaC06g31040D was homologous with AtGSTU11 (Table 4, Figure 6). These genes have been shown to play an important role in the defence response of plants (Jiang and Deyholos, 2009; Liao et al., 2014).
Figure 6.
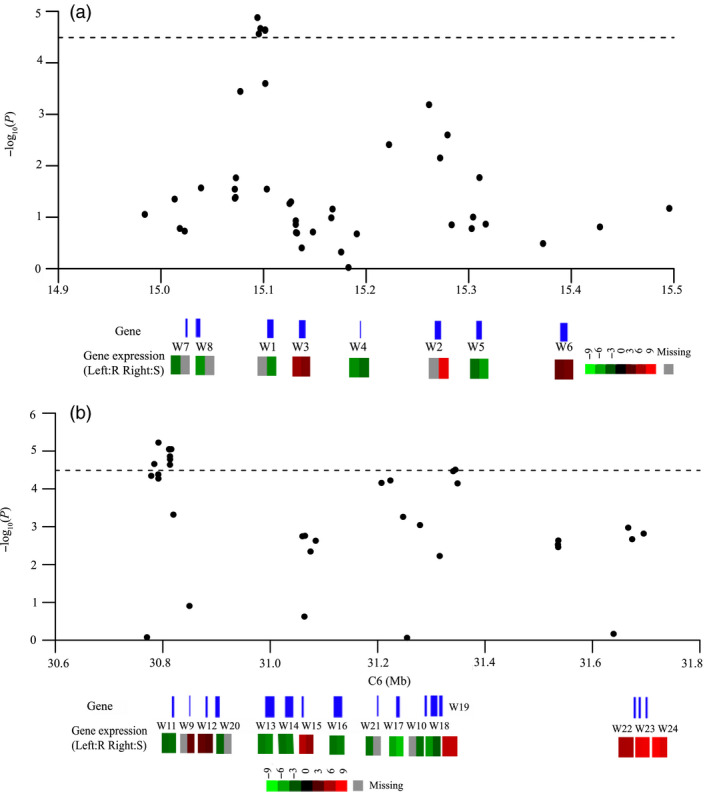
The differentially expressed genes in the interval identified through the GWAS mapping. (a) A8; (b) C6. Top, the candidate gene regions on chromosomes A8 and C6 as determined by GWAS analysis. Middle, the position of differentially expressed genes within the interval. Bottom, the expression levels in the resistant (R) and susceptible (S) genotype. Red denotes up‐regulated genes; green represents down‐regulated genes; and gray represents the missing value.
Table 4.
Common candidate genes identified by GWAS and transcriptome sequencing
| Code | Gene | Arabidopsis homologue | Description | R log2(fold change) | S log2(fold change) |
|---|---|---|---|---|---|
| W1 | BnaA08g19770D | AT1G26560 | Beta glucosidase 40 (BGLU40) | −4.86** | |
| W2 | BnaA08g20100D | AT1G27110 | Tetratricopeptide repeat‐like superfamily protein | 8.32*** | |
| W3 | BnaA08g19850D | AT1G35350 | EXS family protein | 5.54*** | 4.58** |
| W4 | BnaA08g19990D | AT1G26920 | Unknown protein | −5.04** | −3.88* |
| W5 | BnaA08g20190D | AT1G27210 | ARM repeat superfamily protein | −3.95** | −5.67*** |
| W6 | BnaA08g20360D | AT1G23560 | Domain of unknown function (DUF220) | 3.71* | 4.19** |
| W7 | BnaA08g19560D | AT1G26100 | Cytochrome b561 | −4.19* | |
| W8 | BnaA08g19580D | AT1G26120 | Isoprenyl cysteine methylesterase‐like 1 (ICME‐LIKE1) | −5.18* | |
| W9 | BnaC06g30020D | AT1G68430 | Unknown protein | 3.67* | |
| W10 | BnaC06g30560D | AT1G69390 | Homologue of bacterial MinE 1 (MINE1) | −3.88* | |
| W11 | BnaC06g29990D | AT1G69160 | Unknown protein | −3.62* | −3.94** |
| W12 | BnaC06g30030D | AT1G68440 | Unknown protein | 3.58* | 3.05* |
| W13 | BnaC06g30160D | AT1G68560 | Alpha‐xylosidase 1 (XYL1) | −4.37** | −4.91*** |
| W14 | BnaC06g30180D | AT1G68570 | Major facilitator superfamily protein (MFS) | −4*** | −4.5** |
| W15 | BnaC06g30250D | AT4G39670 | Glycolipid transfer proteinfamily protein (GLTP) | 6.48*** | 5.23*** |
| W16 | BnaC06g30370D | AT1G68740 | PHO1 | −4.04** | −4.53** |
| W17 | BnaC06g30470D | AT1G26450 | Carbohydrate‐binding X8 domain superfamily protein | −5.84*** | −7.09*** |
| W18 | BnaC06g30580D | AT1G69420 | DHHC‐type zinc finger family protein | −5.39*** | −3.13* |
| W19 | BnaC06g30610D | AT1G33590 | Leucine‐rich repeat (LRR) family protein | 6.78*** | 7.01*** |
| W20 | BnaC06g30040D | AT1G68470 | Exostosin family protein | −3.62* | |
| W21 | BnaC06g30280D | AT1G68590 | Ribosomal protein PSRP‐3/Ycf65 | −4.08** | |
| W22 | BnaC06g31020D | AT1G69920 | Glutathione S‐transferase TAU 12 (GSTU12) | 5.96*** | 6.05*** |
| W23 | BnaC06g31030D | AT1G69920 | Glutathione S‐transferase TAU 12 (GSTU12) | 8.31*** | 8.57*** |
| W24 | BnaC06g31040D | AT1G69930 | Glutathione S‐transferase TAU 11 (GSTU11) | 8.96*** | 7.85*** |
***P < 0.001; **P < 0.01; *P < 0.05.
Verification of transcriptome sequencing
To validate our transcriptome sequencing results, qRT‐PCR was used to determine differential gene expression for the genes that were commonly identified. The real‐time PCR results confirm and verify the expression patterns obtained with transcriptome sequencing (Figure 7).
Figure 7.
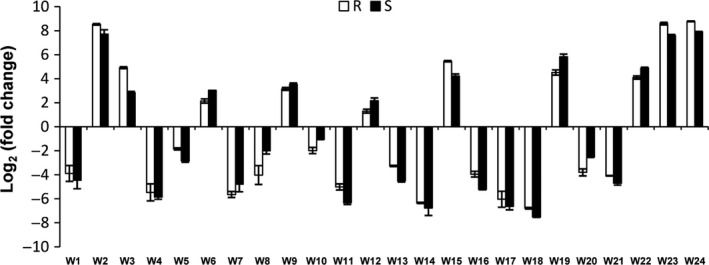
qRT‐PCR validation of the expression patterns of 24 genes identified both in GWAS and transcriptome sequencing.
Discussion
Culture of Sclerotinia sclerotiorum and the screening method for stem resistance
The isolate of S. sclerotiorum used in this study (kindly provided by Dr. Mei) was collected from the field, incubated and grown in the laboratory. Different B. napus accessions vary in their pathogenicity and resistance to different isolates of S. sclerotiorum (Garg et al., 2010a). In this study, the resistant accessions could be correctly and effectively identified using the same criteria as would be expected when there is a single isolate infection of S. sclerotiorum. If mixed populations of S. sclerotiorum were used, the efficiency of screening for resistance would have been reduced and GWAS mapping could not have been performed. The QTL identification for resistance to S. sclerotiorum of B. napus also used the isolate of S. sclerotiorum (Mei et al., 2013; Wu et al., 2013). However, there are still biological limitations when using a single isolate, in that it cannot represent the diversity that would generally be observed in the field. For example, a number of S. sclerotiorum isolates can be found in a field. Sexton et al. (2006) identified 55 unique S. sclerotiorum haplotypes with genotypic diversity ranging from 0.40 to 0.71 in a rapeseed field. Furthermore, the aggressiveness of the different isolates was variable due to physiological specialization (Taylor et al., 2015). Due to this variability, it would be difficult to identify all of the QTLs in B. napus that are associated with resistance to all of the S. sclerotiorum isolates. Wei et al. (2014) showed that QTLs identified using the detached stem inoculation assay overlapped with those found in a diseased field; however, some QTLs were found in the field but not in the laboratory.
In this study, the detached stem assay was used to assess the resistance of B. napus to S. sclerotiorum. Previous methods for screening stem resistance to S. sclerotiorum have included petal inoculation, toothpick inoculation and plug inoculation in the field (Yin et al., 2010; Zhao and Meng, 2003). However, the efficiency of these methods greatly depends on environmental conditions, such as rain and/or temperature. Screening could be better controlled in the glasshouse, but this involves using expensive infrastructure to maintain temperature and humidity. In addition, field and glasshouse experiments for screening are fairly time‐consuming. The detached stem assay is a flexible, fast and reliable identification method that can easily be performed in a controlled uniform environment (Mei et al., 2012). Very little space was needed, and a large‐scale estimation, about 150 stems, only needed a 2‐m2 space (Mei et al., 2012). Furthermore, there was no correlation between lesion length and the diameter of stems (Mei et al., 2012), which meant that stem resistance could be accurately evaluated regardless of different sizes.
The PDA media that S. sclerotiorum is cultured on affects its virulence. Guo and Stotz (2007)showed that using PDA relative to minimal medium, disease symptoms occurred 1 day earlier in leaves of Arabidopsis. This is advantageous when using the detached stem inoculation technique, as it allows for quick and accurate evaluation of stem resistance with minimized water loss from the stem. In addition, using isolates with increased virulence, it may be easier to identify the most significant QTLs. As such, we identified two QTLs on A8 and C6 in this study. Future genetic research should take into consideration the virulence of the pathogen used for screening. Minimal media (relative to PDA) would be better used for inoculation trials to identify how an isolate, with different virulence, performs in plant–pathogen interactions. Furthermore, additional QTLs can also be identified.
In this study, we wounded the plant stem to allow S. sclerotiorum infection. The pathogen does not need to penetrate the natural structural defence barriers during infection. This provides favourable conditions for pathogen attack, but may circumvent any mechanical defence mechanisms of the plant or any defence mechanisms specific to the plant epidermal tissue during the initial infection. As a consequence, some defence‐associated QTLs might not be detected. Many similar QTLs were detected in wounding and nonwounding tests examining S. sclerotiorum resistance in common bean, but one specific QTL probably related to initial defence was identified in the nonwounding assay (Soule et al., 2011). Therefore, future research could also include nonwounding assays to identify QTLs associated with the initial defence mechanism.
The identification of candidate genes
S. sclerotiorum is one of the most damaging agricultural diseases in China and can lead to considerable yield loss in B. napus. Previous studies into the resistance of B. napus to S. sclerotiorum were mainly conducted using QTL mapping, but in this study, we used GWAS implemented with GenABEL software for this purpose. We identified 17 SNPs that had significant associations with S. sclerotiorum response on chromosomes A8 and C6. Identification of SNPs on C6 (30.7–31.3 Mb) is consistent with previous QTL mapping results (Li et al., 2015; Wu et al., 2013; Zhao et al., 2006). Zhao et al. (2006) evaluated S. sclerotiorum resistance in the petioles of B. napus DH lines, and a QTL was repeatedly detected in the region of 23.1–35.4 Mb on C6. Wu et al. (2013) detected a QTL from 30.3 Mb to 36 Mb using B. napus stems inoculated with mycelial agar plugs. Li et al. (2015) also identified conserved stem resistance QTLs on C6 from 29.6 to 36.1 Mb through integration analysis of resistance QTLs.
A comparison of our GWAS and transcriptome sequencing results revealed 21 common genes and a GSTU gene cluster, which were verified by qRT‐PCR. Eight common candidate genes found on chromosome A8 were analysed: BnaA08g19770D, BnaA08g20100D, BnaA08g19850D, BnaA08g19990D, BnaA08g20190D, BnaA08g20360D, BnaA08g19560D and BnaA08g19580D. On chromosome C6, a total of 13 candidate genes were found (Figure 6, Table 4).
Two of these 21 genes encoded for glucosidases, BnaA08g19770D (W1) which is homologous to At1 g26560 (BGLU40) and BnaC06g30160D (W13) which is homologous to XYL1. Zhao et al. (2007) found that BGLU40 was expressed 48 h after inoculation with S. sclerotiorum in susceptible B. napus. Glucosidases catalyse the cleavage of the glucoside plant defence molecules, such as cyanogenic glucosides and glucosinolates, during the interaction between plant and pathogen (Morant et al., 2008). Gucosidases have also been suggested to play a role in activating phytohormones (Lee et al., 2006). Increased expression of BGLU1 has been demonstrated to be associated with resistance to the necrotrophic pathogen, Cochliobolus heterostrophus in maize (Simmons et al., 2001). The resistance has been shown to not depend on the antimicrobial compound or hydroxamic acids, but operates via other mechanisms (Simmons et al., 2001). In our study, BGLU40 expression decreased 29.04‐fold in B. napus which may lead to increased susceptibility in plants infected by S. sclerotiorum.
XYL1 (BnaC06g30160D), which encodes for α‐xylosidase, has been shown to catalyse the hydrolysis reaction of xylogucan ologosaccharides, a member of glycoside hydrolase (GH) family 31 (Henrissat and Bairoch, 1993). Miedes et al. (2014) showed that an increase in xyloglucan content increased resistance to pathogens in Aradidopsis. In Arabidopsis, the xly1‐2 mutant shows enhanced resistance to the necrotrophic fungus P. cucumerina due to the structural changes in xyloglucan (Delgado‐Cerezo et al., 2012). However, in our study, the expression level of XYL1 in the S genotype decreased (30.06‐fold) more than that of the R genotype (20.68‐fold). Therefore, the role of glucosidases in the defence response of B. napus to S. sclerotiorum may need to be investigated further.
The common gene BnaC06g30470D (W17) found on C6 encodes for the pathogenesis‐related (PR‐2 family) gene, β‐1,3 glucanase. PR proteins are strongly induced by pathogens or related factors (Stintzi et al., 1993). β‐1,3‐glucanase inhibits the growth of fungi by hydrolysing the fungal cell wall, which contains the primary polysaccharide, β‐1,3 glucan. In addition, β‐1,3‐glucanase triggers the release of oligosaccharide elicitors, which activate the production of antifungal compounds such as phytoalexin and other PR proteins (Keen and Yoshikawa, 1983; Klarzynski et al., 2000). β‐1,3‐glucanase has also been shown to be responsible for the decreased infection of S. sclerotiorum in B. napus (Fernando et al., 2007). When the β‐1,3‐glucanase gene (bgn13.1) from the fungus Trichoderma virens‐10 was transformed and overexpressed in B. napus, the transgenic lines inhibited hyphal growth of S. sclerotiorum (Kheiri et al., 2014). In our study, the expression of BnaC06g30470D in S genotype decreased (136.24‐fold) more than that in R (55.71‐fold), which might increase susceptibility to B. napus.
The gene (BnaC06g30610D, W19) encodes for a leucine‐rich repeat (LRR) family protein which was induced in both genotypes in our study, and this finding was verified by qRT‐PCR. The LRRs are important conserved domains in R genes and have been shown to be involved in the interaction between plants and pathogens (Kohler et al., 2008; Porter et al., 2009).
The transcription factor BnaC06g30580D (W18) that encodes for the DHHC‐type zinc finger protein (ZFP) was significantly down‐regulated in the R genotype (41.93‐fold, P < 0.01). TFs play an important role in plant resistance response (Seo et al., 2015). ZFPs can be classified into several different types such as C2H2, C2C2, CCCH, GATA and DHHC, some of which have been found to be involved in abiotic and biotic stress (Cui et al., 2002; Jan et al., 2013). There are relatively few DHHC types of ZFPs, and very little is known about their function. It has been shown that DHHC‐type ZFPs were repressed by Magnaporthe oryzae in rice (Li et al., 2014b). However, the mechanism for this is still unknown. In addition, many of the other TFs identified in this study belonged to ERF and WRKY families and most were up‐regulated upon inoculation with S. sclerotiorum (Tables 3 and S7). The ERF and WRKY transcription factor are known to be involved in biotic and abiotic stress response (Chen et al., 2013a,b; Son et al., 2012; Wang et al., 2014b; Yang et al., 2009; Zhao et al., 2007). In Arabidopsis, ERF5 negatively regulates chitin‐induced innate immunity response (Son et al., 2012).
Resistance genes have been shown to generally cluster in the genome (Graham et al., 2002). In this study, a GSTU gene cluster was identified 330 kb away from the peak SNP on chromosome C6; BnaC06g31020D and BnaC06g31030D are homologues of GSTU12 (AT1G69920), and BnaC06g31040D is a homologue of GSTU11 (AT1G69930). All of these genes were up‐regulated in both genotypes upon S. sclerotiorum infection. GSTU plays an important role in the response to biotic and abiotic stress (including S. sclerotiorum) as cellular protectants, reducing free radicals and reactive species (Jiang and Deyholos, 2009; Liao et al., 2014). In previous studies, following infection with S. sclerotiorum in B. napus, the homologues of AT1G69920 (GSTU12) and AT1G69930 (GSTU11) were also up‐regulated and GST proteins were expressed in resistant B. napus (Garg et al., 2013; Zhao et al., 2007, 2009). The GSTU gene cluster identified in this study confirms their importance in response to S. sclerotiorum by possibly acting as an antioxidant defence mechanism.
Another gene, BnaC.IGMT5.a, an indole glucosinolate methyltransferase, located on C6 at 35.5 Mb, about 4 Mb away from our peak SNP, has previously been identified and cloned as a candidate gene for resistance to Sclerotinia (Wu et al., 2013). RT‐PCR analysis showed that no expression was observed in the susceptible B. napus lines, and increased expression was observed in the resistant (R) lines 24 to 96 h postinoculation (Wu et al., 2013). However, in our study, the expression of BnaC.IGMT5.a (BnaC06g37610D) was also increased 48 h postinoculation in both R and S genotypes.
It has also been shown that the presence of susceptibility factors (genes) in susceptible genotypes could increase susceptibility to necrotrophic fungal pathogens in wheat (Liu et al., 2006). Therefore, it could be argued that resistance may be governed by the absence of a susceptibility gene in the resistant genotypes as opposed to the presence of a resistance gene. Specific susceptibility genes in the S genotype were detected in this study; however, the presence of these genes needs to be validated in future studies. To follow up on the genes identified in this study, we aim to clone the above candidate genes in order to elucidate the differences observed between the R and S genotypes in order to confirm their roles in the response to Sclerotinia.
Transcriptome sequencing
Zhao et al. (2009) found that the greatest number of differentially expressed genes between the resistant B. napus variety Zhongyou 821 and susceptible cultivar Westar occurred 48 h after inoculation with S. sclerotiorum. Therefore, we conducted our transcriptome sequencing analysis on B. napus stems 48 h after inoculation. Genes involved in photosynthesis, glyoxalic acid and carbon metabolism pathways were mostly down‐regulated upon inoculation. Soybean and tomato had a similar response to Pseudomonas syringae; genes involved in photosynthesis were down‐regulated after inoculation (Berger et al., 2004; Zou et al., 2005).
Conversely, we found that the biosynthesis of secondary metabolites, sulphur metabolism (especially of GSH and glucosinolates) and 2‐oxocarboxylic acid metabolism were increased, suggesting that the plant immune system was activated and plays a key role in the defence response to S. sclerotiorum. A total of 81 up‐regulated genes were involved in sulphur metabolism, and sulphur is an essential macronutrient for plant growth and development. Recent research into sulphur‐induced resistance (SIR) or sulphur‐enhanced defence (SED) (Rausch and Wachter, 2005) shows that GSH and glucosinolates induce SIR/SED. GSH is a major antioxidant molecule in plants and is reported to be involved in the interaction between plants and microbes, including necrotrophic pathogens (Ball et al., 2004; Frendo et al., 2013; Parisy et al., 2007). GSH has been shown to increase after inoculation with S. sclerotiorum in B. napus (Bloem et al., 2012). Glucosinolates have also been shown to be important for the defence response in Brassicaceae (Wittstock and Halkier, 2002). Glucosinolate was probably associated with S. sclerotiorum resistance in B. napus (Li et al., 1999). And as discussed above, BnaC.IGMT5.a, an indole glucosinolate methyltransferase, is a candidate gene for S. sclerotiorum resistance (Wu et al., 2013). We therefore conclude that the increased metabolism of sulphur‐containing compounds, such as GSH and glucosinolate, plays a key role in plant defence.
Specific genes in JA signalling and lignin biosynthesis were found only in the R genotype, indicating that these two pathways have important functions in the defence response. JA, synthesized from linoleic acid by a series of enzymes (i.e. LOX, AOS, AOC, and OPR), is an endogenous hormone involved in plant defence against necrotrophic pathogens (Frendo et al., 2013). Using microarray analysis, Yang et al. (2007) and Zhao et al. (2009) found that genes associated with the JA pathway were induced in response to S. sclerotiorum in B. napus. The sequential activation of salicylic acid (SA) signalling and JA signalling has also been shown to be important in the defence response against S. sclerotiorum in B. napus (Wang et al., 2012b). The JA‐mediated defence response is thought to be though the regulation of protease inhibitor and secondary metabolites, such as anthocyanin and glucosinolates (van Dam et al., 2004; Mengiste, 2012).
Lignin in the plant cell wall contributes to disease defence, not only by enhancing the mechanical strength of the plant, but also by preventing infection and colonization of the pathogen due to its hydrophobic properties (Vanholme et al., 2008). Lignification protects cotton from the fungal necrotrophic pathogen Verticillium dahliae (Shi et al., 2012; Xu et al., 2011). In our study, specific lignin synthesis‐related genes, that is C4H, CCoAOMT, COMT and CAD5, were up‐regulated in the R genotype, which shows that lignin contributes to the response to S. sclerotiorum in B. napus. Miedes et al. (2014) summarized and explained the effect of lignin on plant pathogen resistance or susceptibility, which was mainly through the alternation of cell walls and the production of some soluble phenolic compounds. However, a greater understanding of the biochemical mechanisms is still necessary to fully understand the lignin host–pathogen interactions.
The relationship between GSH and other stress response genes has been studied in response to abiotic and biotic stress (Han et al., 2013; Kumar et al., 2015; Wingate et al., 1988). GSH was found to induce biosynthesis of phenylpropanoid, lignin, dihydro flavonols pathway, JA signalling, and the expression of TFs and various PR proteins (Garg et al., 2013; Han et al., 2013; Kumar et al., 2015). These genes and pathways were also induced in our study. Therefore, it could be speculated that GSH may also play a role in modulating the JA and lignin pathways in response to necrotrophic pathogens such as S. sclerotiorum in B. napus. GSH may act as a master switch in regulating pathogen response in plants. The increased levels of GST could enhance GSH activity (Garg et al., 2013), and GSTU detected above may play a major role in the response to S. sclerotiorum in B. napus.
Genome‐wide prediction
We performed a genome‐wide prediction to evaluate the breeding value of a plant based on its genetic loci with rrBLUP. rrBLUP performed better in the prediction accuracies for the complex traits, such as flowering time, oil content, plant height and glucosinolate content in B. napus, than the method of BayesB (Wurschum et al., 2014). The predictive ability was related to training population, the number of markers and broad sense heritability (Owens et al., 2014; Slavov et al., 2014). In our study, prediction abilities also increased with the size of the training population, but the standard deviation increased also. Therefore, it was better to select 60% of the training population (145) for genome predictions. When all SNP markers were used, the predictive ability was too low (0.27) that the markers failed to predict stem resistance. It is well known that GWAS and genomic prediction are performed on the same phenotype and same genotype data sets, and that GWAS is able to detect markers significantly associated with the trait by setting a certain P value, such as P < 0.001, P < 0.01 and P < 0.05 (Zhang et al., 2014b). When using the significantly associated SNPs with S. sclerotiorum resistance produced by GWAS including P < 0.001 (69 SNPs), P < 0.01 (288) and P < 0.05 (1203), the predictive ability increased from 0.58 (P < 0.001) to 0.8 (P < 0.05). Therefore, these significant markers detected in GWAS could be used to predict stem resistance in efforts to breed B. napus lines that are resistant to stem rot. Zhang et al. (2014b) also showed that GWAS could improve the accuracy of genomic prediction in animal breeding, rice breeding and human genetics, when the significant SNPs detected by GWAS and located in QTL regions are employed in genomic prediction. With the help of genetic architecture and population structure revealed by GWAS, the efficiency of genomic prediction and further breeding processes is increased (Spindel et al., 2015).
Experimental procedures
Plant material and phenotypic evaluation
A total of 347 B. napus lines were collected from spring, winter and semi‐winter accessions and cultivated in Southwest University of Beibei, Chongqing, China, in 2012 and 2013 (Table S1). Each line was planted in two rows of 10 plants per row, with 30 cm between rows and a distance of 20 cm between plants within each row.
The S. sclerotiorum isolate was provided by Dr. Jiaqin Mei from Southwest University and was cultured on potato dextrose agar medium (20% potato, 2% dextrose and 1.5% agar) at 22 °C in darkness. The detached stem inoculation assay was used to evaluate resistance to Sclerotinia at the end of flowering time according to Mei et al. (2012), with ‘Zhongshuang 9’ as control, which is known to be resistant to stem rot. A 40‐cm segment of stem that was 10 cm above the soil was cut off the plants. The cut ends were sealed in plastic wrap, and the stems were wrapped in moist towels and filter papers and placed on a board. Each stem was wounded at two points with a 4‐mm‐diameter punch, and Sclerotinia mycelium agar plugs (6 mm in diameter) were placed on each wound. The stems were sprayed with water mist, and the board was covered with plastic film. The infection temperature was maintained at 22 °C. Lesions first appeared 24 h after inoculation and expanded to the two sides of the stem. After 72 h, lesions were watery and encircled the stems. The lesion lengths on the stems were recorded 72 h after inoculation. The resistance assessment (RA) was calculated according to relative susceptibility, RA = L/Lcontrol, where L denotes the lesion length of the tested accession and Lcontrol represents that of ‘Zhongshuang 9’. The resistance was conducted with two replications for each of 347 lines during 2013 and 2014 using the detached stem inoculation assay.
SNP genotyping and in silico mapping of SNPs
SNP genotyping was performed using the Brassica 60K Illumina SNP array (http://www.illumina.com/technology/beadarray-technology/infinium-hd-assay.html), and SNP data were analysed using Illumina BeadStudio genotyping software. SNP call frequencies of <0.9 or minor allele frequencies (MAFs) of <0.05 were excluded in the study.
To identify the physical position of SNPs in the B. napus genome, SNP array sequences were aligned with the genome sequences of B. napus (Chalhoub, 2014) using local BLASTn with E values of <‘1.0E−10’. SNP positions with a minimum E value and a maximum score were selected. SNPs with the same E values and scores were removed.
Relative kinship and haplotype block construction
The relative kinship matrix of 347 B. napus lines was computed using SPAGeDi software (Hardy and Vekemans, 2002). Negative kinship values were set to zero. Haplotype blocks were constructed using the four gamete rule (Lorenz et al., 2010) with Haploview software (Barrett et al., 2005). The parameters were set as follows: P value cut‐off of Hardy–Weinberg was 0.001, MAF was 0.05, and the maximum number of Mendel errors was 1.
Genome‐wide association analysis
The best linear unbiased prediction (BLUP) of a stem resistance trait with two replicates over two years was estimated using an R script (www.eXtension.org/pages/61006) based on a linear model. An association analysis was performed using the P+K model implemented in GenABEL software (Aulchenko et al., 2007). P values were calculated based on the mm score function of GenABEL. The quantile–quantile plot was displayed with –log10 (P) of each SNP and expected P value. The Manhattan plot was displayed using qqman software (Turner, 2014). The threshold of GWAS was set to P < 3.23 × 10⁻⁵ (1/total SNPs used). The false discovery rate (FDR) was calculated based on the formula: [(m × P)/n] ×100%, where m was the number of total SNPs, P was the threshold of GWAS, and n was the number of significant SNPs.
Stem resistance prediction
To evaluate the prediction ability of markers for stem resistance among 243 lines (miss rate<10%), prediction accuracy was examined using ridge regression best linear unbiased prediction rrBLUP (Endelman, 2011) in the R package. The prediction ability (r) of the model representing the correlation between the predicted and field data was estimated (Slavov et al., 2014). To assess the performance of genomic prediction, 20–90% of the population was selected at random as the training population and markers (P < 0.001, P < 0.01, P < 0.05 and all SNPs) were also used.
Transcriptome sequencing and the identification of transcription factor genes
Five highly resistant (R) and susceptible (S) lines were selected from the GWAS population, and two stems were used per line and two inoculation sites on each stem. The R lines were WH‐57, 2011‐7103, Huayou14, Chuxianbaihua and Youyan2, and the S lines were Yangjian8, P685, Guangde138, SWU69 and 07037, respectively (F = 48.69, P < 0.0001). Mock‐inoculated lines were treated with agar plug only. The stem tissues extending 10 mm beyond the inoculation point and 1 mm deep were harvested 48 h postinoculation with a razor blade, and immediately placed in liquid nitrogen and stored at −80 °C. Five R and S lines (20 inoculation points) before and after inoculation were pooled to yield four RNA samples, that isR0, R48, S0 and S48. Sequencing libraries were generated using the Illumina RNA Library Prep Kit following the manufacturer's recommendations. The library preparations were sequenced on an Illumina Hiseq 2000 platform, and 100‐bp paired‐end reads were generated.
The B. napus reference genome was constructed using bowtie 2 (Broad Institute, Cambridge, MA, USA). Sequencing reads were aligned to the B. napus reference genome and then assembled using TopHat 2.0.0 and Cufflinks (Trapnell et al., 2012). Gene expression levels were estimated using FPKM (fragments per kilobase of exon per million mapped fragments). Differentially expressed genes (DEGs) between two samples were identified with Cuffdiff, based on the criteria FDR<0.01 and |log2 (FPKM48/FPKM0)|>2. To identify possible transcription factors (TFs), DEGs in the R and S genotypes were aligned to TFs in A. thaliana, which were downloaded from the Plant Transcription Factor Database (http://planttfdb.cbi.pku.edu.cn/index.php).
GO and KEGG enrichment analysis of DEGs
GO enrichment analysis was implemented using BiNGO in Cytoscape v3.1.0 (Maere et al., 2005; Smoot et al., 2011), and significantly enriched GO terms (FDR < 0.01) were displayed using the online tool WEGO (Web Gene Ontology annotations Plot, http://wego.genomics.org.cn) (Ye et al., 2006). The enrichment of DEGs in the KEGG pathway analysis was conducted in the KOBAS2.0 website (http://kobas.cbi.pku.edu.cn/home.do). To analyse the metabolic pathway and functional classification of DEGs, expression data were mapped to metabolic pathways using MapMan software (Thimm et al., 2004).
qRT‐PCR analysis
Total cDNA was synthesized from 1 μg RNA according to the manufacturer's instructions (Bio‐Rad, Foster City, CA). Primers are listed in Table S2. PCRs contained 10 μL SSoAdvanced SYBR Green Supermix (Bio‐Rad), 2.0 μL cDNA, 1 μL primer and distilled water to a final volume of 20 μL. The PCR program was as follows: 95 °C for 30 s and 35 cycles of 95 °C for 5 s, followed by 56–67 °C (depending on the primers used) for 30 s. Three technical replicates were run for test and reference genes. Relative expression levels were evaluated using the 2−ΔΔCT method. Actin was used as an internal control for normalization, and the inoculated group was compared to the mock‐inoculated control group.
Supporting information
Figure S1 Distribution of relative kinship values in 347 Brassica napus accessions.
Figure S2 Genes that are differentially expressed in the resistant (R) and susceptible (S) Brassica napus lines following Sclerotinia sclerotiorum infection.
Figure S3 GO categories of DEGs in the stem of Brassica napus induced by Sclerotinia sclerotiorum.
Table S1 Accessions used in the study.
Table S2 Primers used for qRT‐qPCR verification.
Table S3 ANOVA of stem resistance in Brassica napus.
Table S4 SNPs used for genome‐wide association analysis.
Table S5 Mean prediction ability (r) and standard deviation (SD) in 243 Brassica napus lines based on different training populations and markers
Table S6 Summary of RNA‐Seq reads.
Table S7 Differentially expressed genes in transcription factor families.
Table S8 List of KEGG pathways mapped by common up‐ and down‐ regulated genes.
Table S9 Specific up‐regulated genes involved in jasmonic acid, lignin biosynthesis, signal transduction, stress response and transcription factors in resistant (R) Brassica napus genotype.
Acknowledgements
We thank Prof. for William John Lucas kindly discussion and comments on the manuscript. This work was supported by the National High Technology Research and Development (‘863’) Programs of China (2011AA10A104, 2013AA102602), the National Natural Science Foundation of China (31171619, 31371655 and U1302266), the Earmarked Fund for Modern Agro‐industry Technology Research System (CARS‐13) and the ‘111’ Project (B12006).
References
- Aulchenko, Y.S. , Ripke, S. , Isaacs, A. and van Duijn, C.M. (2007) GenABEL: an R library for genome‐wide association analysis. Bioinformatics, 23, 1294–1296. [DOI] [PubMed] [Google Scholar]
- Ball, L. , Accotto, G.P. , Bechtold, U. , Creissen, G. , Funck, D. , Jimenez, A. , Kular, B. et al. (2004) Evidence for a direct link between glutathione biosynthesis and stress fefense gene expression in Arabidopsis . Plant Cell, 16, 2448–2462. [DOI] [PMC free article] [PubMed] [Google Scholar]
- Barrett, J.C. , Fry, B. , Maller, J. and Daly, M.J. (2005) Haploview: analysis and visualization of LD and haplotype maps. Bioinformatics, 21, 263–265. [DOI] [PubMed] [Google Scholar]
- Behla, R.S. , Fernando, W.G.D. and Li, G. (2009) Identification of quantitative trait loci for resistance against sclerotinia stem rot in Brassica napus . Can. J. Plant Pathol. 31, 477–478. [Google Scholar]
- Berger, S. , Papadopoulos, M. , Schreiber, U. , Kaiser, W. and Roitsch, T. (2004) Complex regulation of gene expression, photosynthesis and sugar levels by pathogen infection in tomato. Physiol. Plant. 122, 419–428. [Google Scholar]
- Bloem, E. , Haneklaus, S. , Kesselmeier, J. and Schnug, E. (2012) Sulfur fertilization and fungal infections affect the exchange of H2S and COS from Agricultural Crops. J. Agric. Food Chem. 60, 7588–7596. [DOI] [PubMed] [Google Scholar]
- Bolton, M.D. , Thomma, B.P.H.J. and Nelson, B.D. (2006) Sclerotinia sclerotiorum (Lib.) de Bary: biology and molecular traits of a cosmopolitan pathogen. Mol. Plant Pathol. 7, 1–16. [DOI] [PubMed] [Google Scholar]
- Cai, D.F. , Xiao, Y.J. , Yang, W. , Ye, W. , Wang, B. , Younas, M. , Wu, J.S. et al. (2014) Association mapping of six yield‐related traits in rapeseed (Brassica napus L.). Theor. Appl. Genet. 127, 85–96. [DOI] [PubMed] [Google Scholar]
- Chalhoub, B. (2014) Early allopolyploid evolution in the post‐Neolithic Brassica napus oilseed genome. Science, 345, 1255–1255. [DOI] [PubMed] [Google Scholar]
- Chen, L.G. , Zhang, L.P. , Li, D.B. , Wang, F. and Yu, D.Q. (2013a) WRKY8 transcription factor functions in the TMV‐cg defense response by mediating both abscisic acid and ethylene signaling in Arabidopsis . Proc. Natl Acad. Sci. USA, 110, E1963–E1971. [DOI] [PMC free article] [PubMed] [Google Scholar]
- Chen, X. , Liu, J. , Lin, G. , Wang, A. , Wang, Z. and Lu, G. (2013b) Overexpression of AtWRKY28 and AtWRKY75 in Arabidopsis enhances resistance to oxalic acid and Sclerotinia sclerotiorum . Plant Cell Rep. 32, 1589–1599. [DOI] [PubMed] [Google Scholar]
- Cui, J.P. , Jander, G. , Racki, L.R. , Kim, P.D. , Pierce, N.E. and Ausubel, F.M. (2002) Signals involved in Arabidopsis resistance to Trichoplusia ni caterpillars induced by virulent and avirulent strains of the phytopathogen Pseudomonas syringae . Plant Physiol. 129, 551–564. [DOI] [PMC free article] [PubMed] [Google Scholar]
- van Dam, N.M. , Witjes, L. and Svatos, A. (2004) Interactions between aboveground and belowground induction of glucosinolates in two wild Brassica species. New Phytol. 161, 801–810. [DOI] [PubMed] [Google Scholar]
- Delgado‐Cerezo, M. , Sanchez‐Rodriguez, C. , Escudero, V. , Miedes, E. , Fernandez, P.V. , Jorda, L. , Hernandez‐Blanco, C. et al. (2012) Arabidopsis heterotrimeric G‐protein regulates cell wall defense and resistance to necrotrophic fungi. Mol. Plant, 5, 98–114. [DOI] [PubMed] [Google Scholar]
- Endelman, J.B. (2011) Ridge regression and other kernels for genomic selection with R package rrBLUP. Plant Genome. 4, 250–255. [Google Scholar]
- Fernando, W.G.D. , Nakkeeran, S. , Zhang, Y. and Savchuk, S. (2007) Biological control of Sclerotinia sclerotiorum (Lib.) de Bary by Pseudomonas and Bacillus species on canola petals. Crop Prot. 26, 100–107. [Google Scholar]
- Fopa Fomeju, B. , Falentin, C. , Lassalle, G. , Manzanares‐Dauleux, M.J. and Delourme, R. (2014) Homoeologous duplicated regions are involved in quantitative resistance of Brassica napus to stem canker. BMC Genom. 15, 498. [DOI] [PMC free article] [PubMed] [Google Scholar]
- Frendo, P. , Baldacci‐Cresp, F. , Benyamina, S.M. and Puppo, A. (2013) Glutathione and plant response to the biotic environment. Free Radic. Biol. Med. 65, 724–730. [DOI] [PubMed] [Google Scholar]
- Fusari, C.M. , Di Rienzo, J.A. , Troglia, C. , Nishinakamasu, V. , Moreno, M.V. , Maringolo, C. , Quiroz, F. et al. (2012) Association mapping in sunflower for Sclerotinia Head Rot resistance. BMC Plant Biol. 12, 93. [DOI] [PMC free article] [PubMed] [Google Scholar]
- Garg, H. , Kohn, L.M. , Andrew, M. , Li, H. , Sivasithamparam, K. and Barbetti, M.J. (2010a) Pathogenicity of morphologically different isolates of Sclerotinia sclerotiorum with Brassica napus and B. juncea genotypes. Eur. J. Plant Pathol. 126, 305–315. [Google Scholar]
- Garg, H. , Li, H. , Sivasithamparam, K. , Kuo, J. and Barbetti, M.J. (2010b) The infection processes of Sclerotinia sclerotiorum in cotyledon tissue of a resistant and a susceptible genotype of Brassica napus . Ann. Bot. 106, 897–908. [DOI] [PMC free article] [PubMed] [Google Scholar]
- Garg, H. , Li, H. , Sivasithamparam, K. and Barbetti, M.J. (2013) Differentially expressed proteins and associated histological and disease progression changes in cotyledon tissue of a resistant and susceptible genotype of Brassica napus infected with Sclerotinia sclerotiorum . PLoS ONE, 8, e65205. [DOI] [PMC free article] [PubMed] [Google Scholar]
- Graham, M.A. , Marek, L.F. and Shoemaker, R.C. (2002) Organization, expression and evolution of a disease resistance gene cluster in soybean. Genetics, 162, 1961–1977. [DOI] [PMC free article] [PubMed] [Google Scholar]
- Guo, X.M. and Stotz, H.U. (2007) Defense against Sclerotinia sclerotiorum in Arabidopsis is dependent on jasmonic acid, salicylic acid, and ethylene signaling. Mol. Plant Microbe Interact. 20, 1384–1395. [DOI] [PubMed] [Google Scholar]
- Gururani, M.A. , Venkatesh, J. , Upadhyaya, C.P. , Nookaraju, A. , Pandey, S.K. and Park, S.W. (2012) Plant disease resistance genes: current status and future directions. Physiol. Mol. Plant Pathol. 78, 51–65. [Google Scholar]
- Han, Y. , Mhamdi, A. , Chaouch, S. and Noctor, G. (2013) Regulation of basal and oxidative stress‐triggered jasmonic acid‐related gene expression by glutathione. Plant, Cell Environ. 36, 1135–1146. [DOI] [PubMed] [Google Scholar]
- Hardy, O.J. and Vekemans, X. (2002) SPAGEDi: a versatile computer program to analyse spatial genetic structure at the individual or population levels. Mol. Ecol. Notes, 2, 618–620. [Google Scholar]
- Henrissat, B. and Bairoch, A. (1993) New families in the classification of glycosyl hydrolases based on amino‐acid‐sequence similarities. Biochem. J. 293, 781–788. [DOI] [PMC free article] [PubMed] [Google Scholar]
- Jamaux, I. , Gelie, B. and Lamarque, C. (1995) Early stages of infection of rapeseed petals and leaves by Sclerotinia sclerotiorum revealed by scanning electron microscopy. Plant. Pathol. 44, 22–30. [Google Scholar]
- Jan, A. , Maruyama, K. , Todaka, D. , Kidokoro, S. , Abo, M. , Yoshimura, E. , Shinozaki, K. et al. (2013) OsTZF1, a CCCH‐Tandem zinc finger protein, confers delayed senescence and stress tolerance in rice by regulating stress‐related genes. Plant Physiol. 161, 1202–1216. [DOI] [PMC free article] [PubMed] [Google Scholar]
- Jiang, Y. and Deyholos, M.K. (2009) Functional characterization of Arabidopsis NaCl‐inducible WRKY25 and WRKY33 transcription factors in abiotic stresses. Plant Mol. Biol. 69, 91–105. [DOI] [PubMed] [Google Scholar]
- Keen, N.T. and Yoshikawa, M. (1983) Beta‐1,3‐endoglucanase from soybean releases elicitor active carbohydrates from fungus cell‐walls. Plant Physiol. 71, 460–465. [DOI] [PMC free article] [PubMed] [Google Scholar]
- Kheiri, H.‐R. , Mostafa, M. , Mohammad‐Reza, Z. and Ali, D. (2014) Beta glucanase (Bgn13.1) expressed in transgenic Brassica napus confers antifungal activity against Sclerotinia sclerotiorum . J. Crop Prot. 3, 31–42. [Google Scholar]
- Klarzynski, O. , Plesse, B. , Joubert, J.M. , Yvin, J.C. , Kopp, M. , Kloareg, B. and Fritig, B. (2000) Linear beta‐1,3 glucans are elicitors of defense responses in tobacco. Plant Physiol. 124, 1027–1038. [DOI] [PMC free article] [PubMed] [Google Scholar]
- Kohler, A. , Rinaldi, C. , Duplessis, S. , Baucher, M. , Geelen, D. , Duchaussoy, F. , Meyers, B.C. et al. (2008) Genome‐wide identification of NBS resistance genes in Populus trichocarpa . Plant Mol. Biol. 66, 619–636. [DOI] [PubMed] [Google Scholar]
- Kollers, S. , Rodemann, B. , Ling, J. , Korzun, V. , Ebmeyer, E. , Argillier, O. , Hinze, M. et al. (2014) Genome‐wide association mapping of tan spot resistance (Pyrenophora tritici‐repentis) in European winter wheat. Mol. Breeding 34, 363–371. [Google Scholar]
- Kumar, D. , Datta, R. , Hazra, S. , Sultana, A. , Mukhopadhyay, R. and Chattopadhyay, S. (2015) Transcriptomic profiling of Arabidopsis thaliana Mutant pad2.1 in response to combined cold and osmotic stress. PLoS ONE, 10, e0122690. [DOI] [PMC free article] [PubMed] [Google Scholar]
- Kump, K.L. , Bradbury, P.J. , Wisser, R.J. , Buckler, E.S. , Belcher, A.R. , Oropeza‐Rosas, M.A. , Zwonitzer, J.C. et al. (2011) Genome‐wide association study of quantitative resistance to southern leaf blight in the maize nested association mapping population. Nat. Genet. 43, 163–168. [DOI] [PubMed] [Google Scholar]
- Lee, K.H. , Piao, H.L. , Kim, H.Y. , Choi, S.M. , Jiang, F. , Hartung, W. , Hwang, I. et al. (2006) Activation of glucosidase via stress‐induced polymerization rapidly increases active pools of abscisic acid. Cell, 126, 1109–1120. [DOI] [PubMed] [Google Scholar]
- Li, Y. , Kiddle, G. , Bennett, R.N. and Wallsgrove, R.M. (1999) Local and systemic changes in glucosinolates in Chinese and European cultivars of oilseed rape (Brassica napus L.) after inoculation with Sclerotinia sclerotiorum (stem rot). Ann. Appl. Biol. 134, 45–58. [Google Scholar]
- Li, F. , Chen, B. , Xu, K. , Wu, J. , Song, W. , Bancroft, I. , Harper, A.L. et al. (2014a) Genome‐wide association study dissects the genetic architecture of seed weight and seed quality in rapeseed (Brassica napus L.). DNA Res. 21, 355–367. [DOI] [PMC free article] [PubMed] [Google Scholar]
- Li, W. , Chen, W. , Yang, C. , Wang, J. , Yang, L. , He, M. , Wang, J. et al. (2014b) Identification and network construction of zinc finger protein (ZFP) genes involved in the rice‐Magnaporthe oryzae interaction. Plant Omics J. 7, 540–548. [Google Scholar]
- Li, J. , Zhao, Z. , Hayward, A. , Cheng, H. and Fu, D. (2015) Integration analysis of quantitative trait loci for resistance to Sclerotinia sclerotiorum in Brassica napus . Euphytica, 205, 483–489. [Google Scholar]
- Liang, W. , Yang, B. , Yu, B.J. , Zhou, Z. , Li, C. , Jia, M. , Sun, Y. et al. (2013) Identification and analysis of MKK and MPK gene families in canola (Brassica napus L.). BMC Genom. 14, 392. [DOI] [PMC free article] [PubMed] [Google Scholar]
- Liao, W.H. , Ji, L.X. , Wang, J. , Chen, Z. , Ye, M.X. , Ma, H.D. and An, X.M. (2014) Identification of glutathione S‐transferase genes responding to pathogen infestation in Populus tomentosa . Funct. Integr. Genomics, 14, 517–529. [DOI] [PubMed] [Google Scholar]
- Liu, Z.H. , Friesen, T.L. , Ling, H. , Meinhardt, S.W. , Oliver, R.P. , Rasmussen, J.B. and Faris, J.D. (2006) The Tsn1‐ToxA interaction in the wheat‐Stagonospora nodorum pathosystem parallels that of the wheat‐tan spot system. Genome, 49, 1265–1273. [DOI] [PubMed] [Google Scholar]
- Lorenz, A.J. , Hamblin, M.T. and Jannink, J.L. (2010) Performance of single nucleotide polymorphisms versus haplotypes for genome‐wide association analysis in barley. PLoS ONE, 5, e14079. [DOI] [PMC free article] [PubMed] [Google Scholar]
- Lu, G. , Harper, A.L. , Trick, M. , Morgan, C. , Fraser, F. , O'Neill, C. and Bancroft, I. (2014) Associative transcriptomics study dissects the genetic architecture of seed glucosinolate content in Brassica napus . DNA Res. 21, 613–625. [DOI] [PMC free article] [PubMed] [Google Scholar]
- Maere, S. , Heymans, K. and Kuiper, M. (2005) BiNGO: a Cytoscape plugin to assess overrepresentation of Gene Ontology categories in Biological Networks. Bioinformatics, 21, 3448–3449. [DOI] [PubMed] [Google Scholar]
- Mei, J.Q. , Wei, D.Y. , Disi, J.O. , Ding, Y.J. , Liu, Y. and Qian, W. (2012) Screening resistance against Sclerotinia sclerotiorum in Brassica crops with use of detached stem assay under controlled environment. Eur. J. Plant Pathol. 134, 599–604. [Google Scholar]
- Mei, J. , Ding, Y. , Lu, K. , Wei, D. , Liu, Y. , Disi, J.O. , Li, J. et al. (2013) Identification of genomic regions involved in resistance against Sclerotinia sclerotiorum from wild Brassica oleracea . Theor. Appl. Genet. 126, 549–556. [DOI] [PubMed] [Google Scholar]
- Mengiste, T. (2012) Plant immunity to necrotrophs. Annu. Rev. Phytopathol. 50, 267–294. [DOI] [PubMed] [Google Scholar]
- Miedes, E. , Vanholme, R. , Boerjan, W. and Molina, A. (2014) The role of the secondary cell wall in plant resistance to pathogens. Front. Plant Sci. 5, 358. [DOI] [PMC free article] [PubMed] [Google Scholar]
- Morant, A.V. , Jorgensen, K. , Jorgensen, C. , Paquette, S.M. , Sanchez‐Perez, R. , Moller, B.L. and Bak, S. (2008) Beta‐glucosidases as detonators of plant chemical defense. Phytochemistry, 69, 1795–1813. [DOI] [PubMed] [Google Scholar]
- Nordborg, M. and Weigel, D. (2008) Next‐generation genetics in plants. Nature, 456, 720–723. [DOI] [PubMed] [Google Scholar]
- Owens, B.F. , Lipka, A.E. , Magallanes‐Lundback, M. , Tiede, T. , Diepenbrock, C.H. , Kandianis, C.B. , Kim, E. et al. (2014) A foundation for provitamin A biofortification of maize: genome‐wide association and genomic prediction models of carotenoid Levels. Genetics, 198, 1699–1716. [DOI] [PMC free article] [PubMed] [Google Scholar]
- Parisy, V. , Poinssot, B. , Owsianowski, L. , Buchala, A. , Glazebrook, J. and Mauch, F. (2007) Identification of PAD2 as a gamma‐glutamylcysteine synthetase highlights the importance of glutathione in disease resistance of Arabidopsis . Plant J. 49, 159–172. [DOI] [PubMed] [Google Scholar]
- Piffanelli, P. , Ramsay, L. , Waugh, R. , Benabdelmouna, A. , D'Hont, A. , Hollricher, K. , Jorgensen, J.H. et al. (2004) A barley cultivation‐associated polymorphism conveys resistance to powdery mildew. Nature, 430, 887–891. [DOI] [PubMed] [Google Scholar]
- Porter, B.W. , Paidi, M. , Ming, R. , Alam, M. , Nishijima, W.T. and Zhu, Y.J. (2009) Genome‐wide analysis of Carica papaya reveals a small NBS resistance gene family. Mol. Genet. Genomics, 281, 609–626. [DOI] [PubMed] [Google Scholar]
- Price, A.L. , Patterson, N.J. , Plenge, R.M. , Weinblatt, M.E. , Shadick, N.A. and Reich, D. (2006) Principal components analysis corrects for stratification in genome‐wide association studies. Nat. Genet. 38, 904–909. [DOI] [PubMed] [Google Scholar]
- Purdy, L.H. (1979) Sclerotinia Sclerotiorum: history, diseases and sympto‐matology, host range, geographic‐distribution, and impact. Phytopathology, 69, 875–880. [Google Scholar]
- Rausch, T. and Wachter, A. (2005) Sulfur metabolism: a versatile platform for launching defence operations. Trends Plant Sci. 10, 503–509. [DOI] [PubMed] [Google Scholar]
- Seo, E. and Choi, D. (2015) Functional studies of transcription factors involved in plant defenses in the genomics era. Brief. Funct. Genomics, 14, 260–267. [DOI] [PubMed] [Google Scholar]
- Sexton, A.C. , Whitten, A.R. and Howlett, B.J. (2006) Population structure of Sclerotinia sclerotiorum in an Australian canola field at flowering and stem‐infection stages of the disease cycle. Genome, 49, 1408–1415. [DOI] [PubMed] [Google Scholar]
- Sharma, P. , Meena, P.D. , Verma, P.R. , Saharan, G.S. , Mehta, N. , Singh, D. and Kumar, A. (2015) Sclerotinia sclerotiorum (Lib.) de Bary causing Sclerotinia rot in oilseed Brassicas: a review. J. Oilseed Brassica, 6, 1–44. [Google Scholar]
- Shi, H.Y. , Liu, Z.H. , Zhu, L. , Zhang, C.J. , Chen, Y. , Zhou, Y. , Li, F.G. et al. (2012) Overexpression of cotton (Gossypium hirsutum) dirigent1 gene enhances lignification that blocks the spread of Verticillium dahliae . Acta Biochim. Biophys. Sin. 44, 555–564. [DOI] [PubMed] [Google Scholar]
- Simmons, C.R. , Grant, S. , Altier, D.J. , Dowd, P.F. , Crasta, O. , Folkerts, O. and Yalpani, N. (2001) Maize rhm1 resistance to Bipolaris maydis is associated with few differences in pathogenesis‐related proteins and global mRNA profiles. Mol. Plant Microbe Interact. 14, 947–954. [DOI] [PubMed] [Google Scholar]
- Singh, S. , Chand, S. , Singh, N.K. and Sharma, T.R. (2015) Genome‐Wide distribution, organisation and functional characterization of disease resistance and defence response genes across rice species. PLoS ONE, 10, e0125964. [DOI] [PMC free article] [PubMed] [Google Scholar]
- Slavov, G.T. , Nipper, R. , Robson, P. , Farrar, K. , Allison, G.G. , Bosch, M. , Clifton‐Brown, J.C. et al. (2014) Genome‐wide association studies and prediction of 17 traits related to phenology, biomass and cell wall composition in the energy grass Miscanthus sinensis . New Phytol. 201, 1227–1239. [DOI] [PMC free article] [PubMed] [Google Scholar]
- Smoot, M.E. , Ono, K. , Ruscheinski, J. , Wang, P.L. and Ideker, T. (2011) Cytoscape 2.8: new features for data integration and network visualization. Bioinformatics, 27, 431–432. [DOI] [PMC free article] [PubMed] [Google Scholar]
- Son, G.H. , Wan, J. , Kim, H.J. , Nguyen, X.C. , Chung, W.S. , Hong, J.C. and Stacey, G. (2012) Ethylene‐responsive element‐binding factor 5, ERF5, is involved in chitin‐induced innate immunity response. Mol. Plant Microbe Interact. 25, 48–60. [DOI] [PubMed] [Google Scholar]
- Soule, M. , Porter, L. , Medina, J. , Santana, G.P. , Blair, M.W. and Miklas, P.N. (2011) Comparative QTL map for white mold resistance in common bean, and characterization of partial resistance in dry bean lines VA19 and I9365‐31. Crop Sci. 51, 123–139. [Google Scholar]
- Spindel, J. , Begum, H. , Akdemir, D. , Virk, P. , Collard, B. , Redona, E. , Atlin, G. et al. (2015) Genomic selection and association mapping in rice (Oryza sativa): effect of trait genetic architecture, training population composition, marker number and statistical model on accuracy of rice genomic selection in elite, tropical rice breeding lines. PLoS Genet. 11, e1004982. [DOI] [PMC free article] [PubMed] [Google Scholar]
- Stintzi, A. , Heitz, T. , Prasad, V. , Wiedemannmerdinoglu, S. , Kauffmann, S. , Geoffroy, P. , Legrand, M. et al. (1993) Plant pathogenesis‐related proteins and their role in defense against pathogens. Biochimie, 75, 687–706. [DOI] [PubMed] [Google Scholar]
- Sun, Y. , Wang, C. , Yang, B. , Wu, F. , Hao, X. , Liang, W. , Niu, F. et al. (2014) Identification and functional analysis of mitogen‐activated protein kinase kinase kinase (MAPKKK) genes in canola (Brassica napus L.). J. Exp. Bot. 65, 2171–2188. [DOI] [PMC free article] [PubMed] [Google Scholar]
- Taylor, A. , Coventry, E. , Jones, J.E. and Clarkson, J.P. (2015) Resistance to a highly aggressive isolate of Sclerotinia sclerotiorum in a Brassica napus diversity set. Plant. Pathol. 64, 932–940. [Google Scholar]
- Thimm, O. , Blasing, O. , Gibon, Y. , Nagel, A. , Meyer, S. , Kruger, P. , Selbig, J. et al. (2004) MAPMAN: a user‐driven tool to display genomics data sets onto diagrams of metabolic pathways and other biological processes. Plant J. 37, 914–939. [DOI] [PubMed] [Google Scholar]
- Trapnell, C. , Roberts, A. , Goff, L. , Pertea, G. , Kim, D. , Kelley, D.R. , Pimentel, H. et al. (2012) Differential gene and transcript expression analysis of RNA‐seq experiments with TopHat and Cufflinks. Nat. Protoc. 7, 562–578. [DOI] [PMC free article] [PubMed] [Google Scholar]
- Turner, S.D. (2014) qqman: an R package for visualizing GWAS results using Q‐Q and manhattan plots.
- Vanholme, R. , Morreel, K. , Ralph, J. and Boerjan, W. (2008) Lignin engineering. Curr. Opin. Plant Biol. 11, 278–285. [DOI] [PubMed] [Google Scholar]
- Wang, M. , Yan, J. , Zhao, J. , Song, W. , Zhang, X. , Xiao, Y. and Zheng, Y. (2012a) Genome‐wide association study (GWAS) of resistance to head smut in maize. Plant Sci. 196, 125–131. [DOI] [PubMed] [Google Scholar]
- Wang, Z. , Tan, X.L. , Zhang, Z.Y. , Gu, S.L. , Li, G.Y. and Shi, H.F. (2012b) Defense to Sclerotinia sclerotiorum in oilseed rape is associated with the sequential activations of salicylic acid signaling and jasmonic acid signaling. Plant Sci. 184, 75–82. [DOI] [PubMed] [Google Scholar]
- Wang, C. , Yang, Y. , Yuan, X. , Xu, Q. , Feng, Y. , Yu, H. , Wang, Y. et al. (2014a) Genome‐wide association study of blast resistance in indica rice. BMC Plant Biol. 14, 311. [DOI] [PMC free article] [PubMed] [Google Scholar]
- Wang, Z. , Fang, H. , Chen, Y. , Chen, K. , Li, G. , Gu, S. and Tan, X. (2014b) Overexpression of BnWRKY33 in oilseed rape enhances resistance to Sclerotinia sclerotiorum . Mol. Plant Pathol. 15, 677–689. [DOI] [PMC free article] [PubMed] [Google Scholar]
- Wei, D. , Mei, J. , Fu, Y. , Disi, J.O. , Li, J. and Qian, W. (2014) Quantitative trait loci analyses for resistance to Sclerotinia sclerotiorum and flowering time in Brassica napus . Mol. Breeding, 34, 1797–1804. [Google Scholar]
- Wingate, V.P.M. , Lawton, M.A. and Lamb, C.J. (1988) Glutathione causes a massive and selective induction of plant defense genes. Plant Physiol. 87, 206–210. [DOI] [PMC free article] [PubMed] [Google Scholar]
- Wittstock, U. and Halkier, B.A. (2002) Glucosinolate research in the Arabidopsis era. Trends Plant Sci. 7, 263–270. [DOI] [PubMed] [Google Scholar]
- Wu, J. , Cai, G. , Tu, J. , Li, L. , Liu, S. , Luo, X. , Zhou, L. et al. (2013) Identification of QTLs for resistance to sclerotinia stem rot and BnaC.IGMT5.a as a candidate gene of the major resistant QTL SRC6 in Brassica napus . PLoS ONE, 8, e67740. [DOI] [PMC free article] [PubMed] [Google Scholar]
- Wurschum, T. , Abel, S. and Zhao, Y.S. (2014) Potential of genomic selection in rapeseed (Brassica napus L.) breeding. Plant Breeding, 133, 45–51. [Google Scholar]
- Xu, L. , Zhu, L.F. , Tu, L.L. , Liu, L.L. , Yuan, D.J. , Jin, L. , Long, L. et al. (2011) Lignin metabolism has a central role in the resistance of cotton to the wilt fungus Verticillium dahliae as revealed by RNA‐Seq‐dependent transcriptional analysis and histochemistry. J. Exp. Bot. 62, 5607–5621. [DOI] [PMC free article] [PubMed] [Google Scholar]
- Yang, B. , Srivastava, S. , Deyholos, M.K. and Kav, N.N.V. (2007) Transcriptional profiling of canola (Brassica napus L.) responses to the fungal pathogen Sclerotinia sclerotiorum . Plant Sci. 173, 156–171. [Google Scholar]
- Yang, B. , Jiang, Y. , Rahman, M.H. , Deyholos, M.K. and Kav, N.N. (2009) Identification and expression analysis of WRKY transcription factor genes in canola (Brassica napus L.) in response to fungal pathogens and hormone treatments. BMC Plant Biol. 9, 68. [DOI] [PMC free article] [PubMed] [Google Scholar]
- Ye, J. , Fang, L. , Zheng, H. , Zhang, Y. , Chen, J. , Zhang, Z. , Wang, J. et al. (2006) WEGO: a web tool for plotting GO annotations. Nucleic Acids Res. 34, W293–W297. [DOI] [PMC free article] [PubMed] [Google Scholar]
- Yin, X.R. , Yi, B. , Chen, W. , Zhang, W.J. , Tu, J.X. , Fernando, W.G.D. and Fu, T.D. (2010) Mapping of QTLs detected in a Brassica napus DH population for resistance to Sclerotinia sclerotiorum in multiple environments. Euphytica, 173, 25–35. [Google Scholar]
- Yu, L.X. , Morgounov, A. , Wanyera, R. , Keser, M. , Singh, S.K. and Sorrells, M. (2014) Identification of Ug99 stem rust resistance loci in winter wheat germplasm using genome‐wide association analysis. Theor. Appl. Genet. 125, 749–758. [DOI] [PubMed] [Google Scholar]
- Zhang, S. and Klessig, D.F. (2001) MAPK cascades in plant defense signaling. Trends Plant Sci. 6, 520–527. [DOI] [PubMed] [Google Scholar]
- Zhang, D. , Bowden, R.L. , Yu, J. , Carver, B.F. and Bai, G. (2014a) Association analysis of stem rust resistance in U.S. winter wheat. PLoS ONE, 9, e103747. [DOI] [PMC free article] [PubMed] [Google Scholar]
- Zhang, Z. , Ober, U. , Erbe, M. , Zhang, H. , Gao, N. , He, J.L. , Li, J.Q. et al. (2014b) Improving the accuracy of whole genome prediction for complex traits using the results of genome wide association studies. PLoS ONE, 9, e93017. [DOI] [PMC free article] [PubMed] [Google Scholar]
- Zhao, J. and Meng, J. (2003) Genetic analysis of loci associated with partial resistance to Sclerotinia sclerotiorum in rapeseed (Brassica napus L.). Theor. Appl. Genet. 106, 759–764. [DOI] [PubMed] [Google Scholar]
- Zhao, J. , Udall, J.A. , Quijada, P.A. , Grau, C.R. , Meng, J. and Osborn, T.C. (2006) Quantitative trait loci for resistance to Sclerotinia sclerotiorum and its association with a homeologous non‐reciprocal transposition in Brassica napus L. Theor. Appl. Genet. 112, 509–516. [DOI] [PubMed] [Google Scholar]
- Zhao, J. , Wang, J. , An, L. , Doerge, R.W. , Chen, Z.J. , Grau, C.R. , Meng, J. et al. (2007) Analysis of gene expression profiles in response to Sclerotinia sclerotiorum in Brassica napus . Planta, 227, 13–24. [DOI] [PubMed] [Google Scholar]
- Zhao, J.W. , Buchwaldt, L. , Rimmer, S.R. , Sharpe, A. , McGregor, L. , Bekkaoui, D. and Hegedus, D. (2009) Patterns of differential gene expression in Brassica napus cultivars infected with Sclerotinia sclerotiorum . Mol. Plant Pathol. 10, 635–649. [DOI] [PMC free article] [PubMed] [Google Scholar]
- Zou, J. , Rodriguez‐Zas, S. , Aldea, M. , Li, M. , Zhu, J. , Gonzalez, D.O. , Vodkin, L.O. et al. (2005) Expression profiling soybean response to Pseudomonas syringae reveals new defense‐related genes and rapid HR‐specific downregulation of photosynthesis. Mol. Plant Microbe Interact. 18, 1161–1174. [DOI] [PubMed] [Google Scholar]
Associated Data
This section collects any data citations, data availability statements, or supplementary materials included in this article.
Supplementary Materials
Figure S1 Distribution of relative kinship values in 347 Brassica napus accessions.
Figure S2 Genes that are differentially expressed in the resistant (R) and susceptible (S) Brassica napus lines following Sclerotinia sclerotiorum infection.
Figure S3 GO categories of DEGs in the stem of Brassica napus induced by Sclerotinia sclerotiorum.
Table S1 Accessions used in the study.
Table S2 Primers used for qRT‐qPCR verification.
Table S3 ANOVA of stem resistance in Brassica napus.
Table S4 SNPs used for genome‐wide association analysis.
Table S5 Mean prediction ability (r) and standard deviation (SD) in 243 Brassica napus lines based on different training populations and markers
Table S6 Summary of RNA‐Seq reads.
Table S7 Differentially expressed genes in transcription factor families.
Table S8 List of KEGG pathways mapped by common up‐ and down‐ regulated genes.
Table S9 Specific up‐regulated genes involved in jasmonic acid, lignin biosynthesis, signal transduction, stress response and transcription factors in resistant (R) Brassica napus genotype.