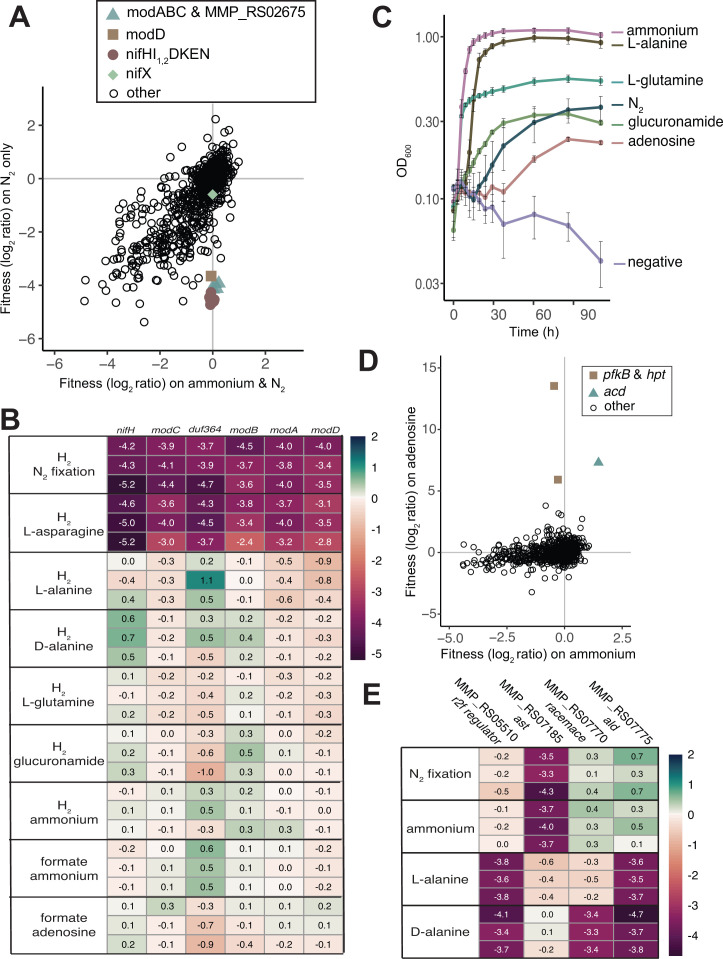
Fig 3.
Gene fitness for diazotrophic growth and growth on various nitrogen sources. (A) Comparison of fitness values between growth with ammonium and N2 as nitrogen sources versus N2 only (both in the presence of acetate and H2). MMP_RS02675 encodes a DUF364. Each value is the average of three replicate experiments. (B) Heatmap showing overview of fitness data for select genes strongly cofit with nifH across conditions with varying nitrogen sources added. N2 is present in all conditions. (C) Growth of M. maripaludis with various nitrogen sources. Averages and standard deviations are calculated from four replicate cultures. N2 is absent in all conditions except N2 fixing (blue circles). (D) Fitness for growth in formate oxidizing conditions with ammonium or adenosine added as a nitrogen source. Values are averages of three experiments. (E) Heatmap showing fitness data for genes of interest for alanine metabolism. N2 is present in all conditions.

