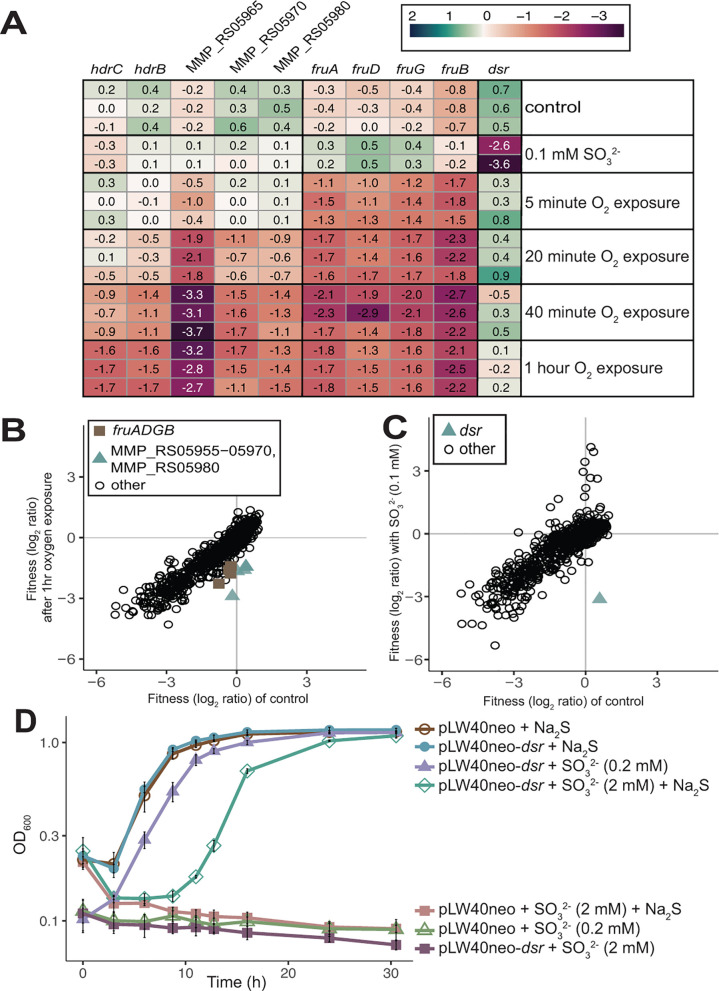
Fig 4.
Comparison of genes with strong phenotypes in oxygen versus sulfite stress. (A) Heatmap showing fitness of select genes across control, oxygen (O2), and sulfite (SO32−) stress conditions. (B) Comparison of fitness between control and oxygen exposed cultures. Values are replicates of triplicate cultures. (C) Comparison of fitness between control and sulfite containing cultures. Values are replicates of two cultures for sulfite and three replicates for control. (D) Growth of M. maripaludis with an empty vector (pLW40neo) or vector containing MMP_RS00450 (dsr) across SO32− stress conditions with or without sulfide (Na2S) added as a sulfur source. Values are averages of three replicates. Error bars represent standard deviation.

